| Param | Original file | Final file |
|---|---|---|
| Filename | modeM0/AS1C09_011T07_9000006488_53110cztM0_level2.fits | modeM0/AS1C09_011T07_9000006488_53110cztM0_level2_quad_clean.evt |
| Size (bytes) | 464,091,840 | 48,683,520 |
| Size | 442.6 MB | 46.4 MB |
| Events in quadrant A | 6,920,058 | 207,065 |
| Events in quadrant B | 3,571,592 | 362,798 |
| Events in quadrant C | 4,197,445 | 306,206 |
| Events in quadrant D | 2,184,752 | 320,119 |
| Mode SS | |||
|---|---|---|---|
| Quadrant | BADHDUFLAG | Total packets | Discarded packets |
| A | 0 | 80 | 0 |
| B | 0 | 80 | 0 |
| C | 0 | 80 | 0 |
| D | 0 | 80 | 0 |
| Mode M0 | |||
|---|---|---|---|
| Quadrant | BADHDUFLAG | Total packets | Discarded packets |
| A | 0 | 23256 | 0 |
| B | 0 | 13404 | 0 |
| C | 0 | 15212 | 0 |
| D | 0 | 9517 | 0 |
| Quadrant | Total seconds | Saturated seconds | Saturation percentage |
|---|---|---|---|
| A | 3927 | 1866 | 47.517189% |
| B | 3927 | 336 | 8.556150% |
| C | 3928 | 551 | 14.027495% |
| D | 3928 | 68 | 1.731161% |
Noise dominated data is calculated using 1-second bins in cleaned event files. If a bin has >2000 counts, and if more than 50% of those come from <1% of pixels, then it is considered to be noise-dominated and hence unusable.
| Quadrant | # 1 sec bins | Bins with >0 counts | Bins with >2000 counts | High rate bins dominated by noise | Noise dominated (total time) | Noise dominated (detector-on time) | Marked lightcurve |
|---|---|---|---|---|---|---|---|
| A | 3926 | 3926 | 1792 | 1792 | 45.64% | 45.64% | 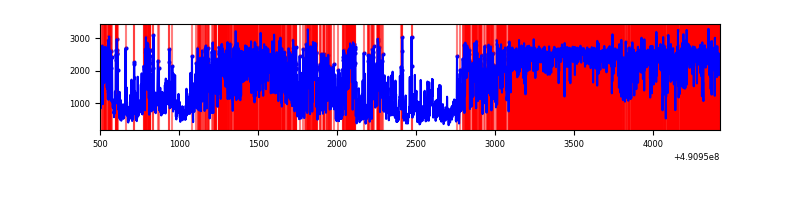 |
| B | 3927 | 3927 | 307 | 307 | 7.82% | 7.82% | 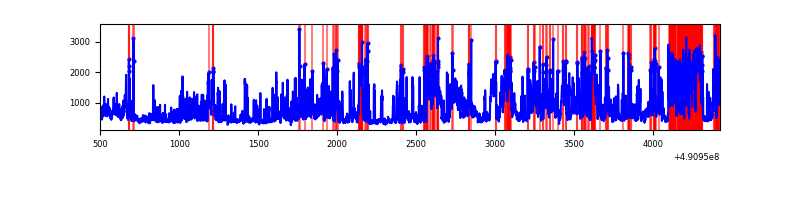 |
| C | 3928 | 3928 | 592 | 592 | 15.07% | 15.07% | 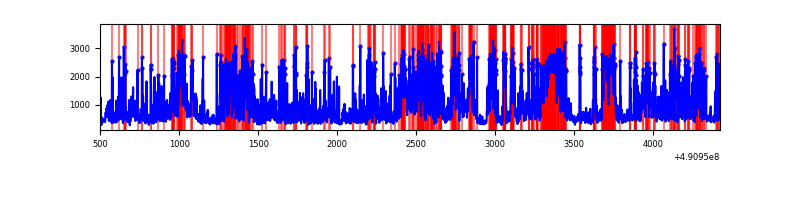 |
| D | 3928 | 3928 | 63 | 63 | 1.60% | 1.60% | 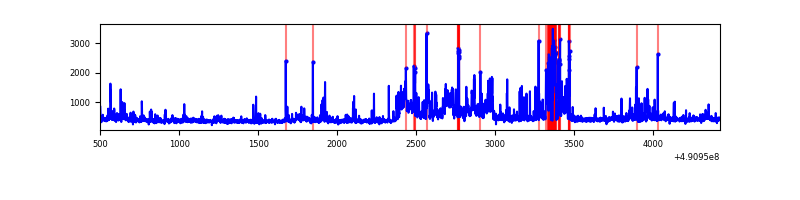 |
Top three noisy pixels from each quadrant. If the there are fewer than three noisy pixels in the level2.evt file, extra rows are filled as -1
| Pixel properties | Quadrant properties | ||||||
|---|---|---|---|---|---|---|---|
| Quadrant | DetID | PixID | Counts | Sigma | Mean | Median | Sigma |
| A | 9 | 191 | 4936038 | 62782.88 | 310 | 302 | 78.6 |
| A | 12 | 80 | 323132 | 4106.42 | 310 | 302 | 78.6 |
| A | 0 | 8 | 136888 | 1737.38 | 310 | 302 | 78.6 |
| B | 10 | 28 | 909970 | 11295.74 | 369 | 356 | 80.5 |
| B | 10 | 254 | 564478 | 7005.36 | 369 | 356 | 80.5 |
| B | 4 | 171 | 285213 | 3537.4 | 369 | 356 | 80.5 |
| C | 15 | 224 | 1580637 | 16250.38 | 349 | 346 | 97.2 |
| C | 0 | 240 | 597404 | 6139.64 | 349 | 346 | 97.2 |
| C | 7 | 80 | 138286 | 1418.46 | 349 | 346 | 97.2 |
| D | 2 | 62 | 245373 | 2304.05 | 368 | 352 | 106.3 |
| D | 10 | 172 | 132567 | 1243.28 | 368 | 352 | 106.3 |
| D | 2 | 120 | 108871 | 1020.45 | 368 | 352 | 106.3 |
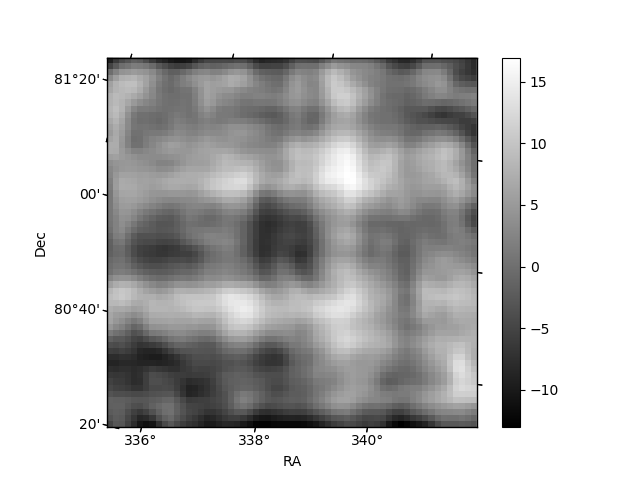
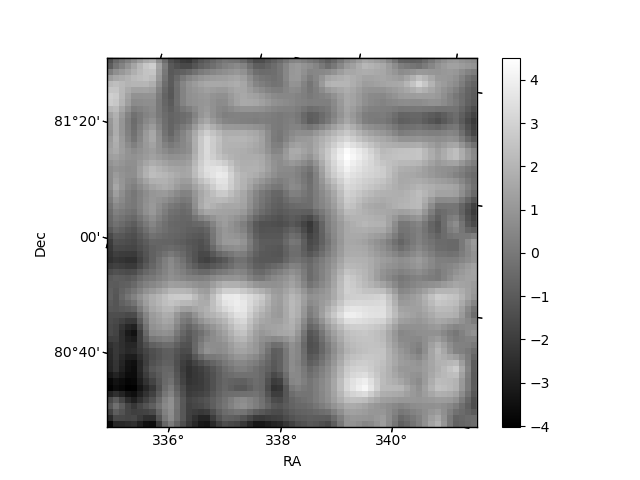
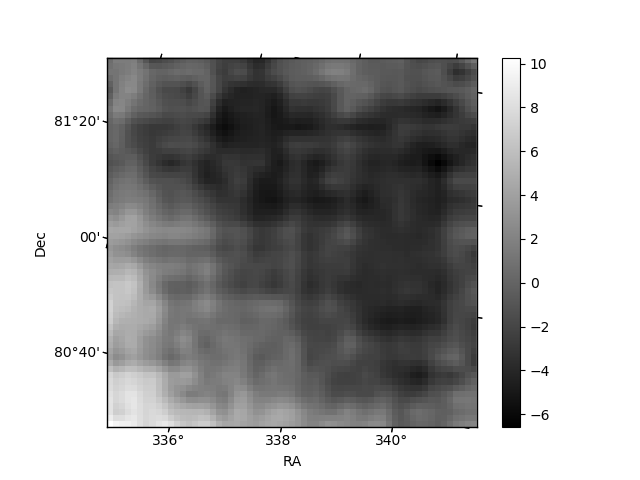
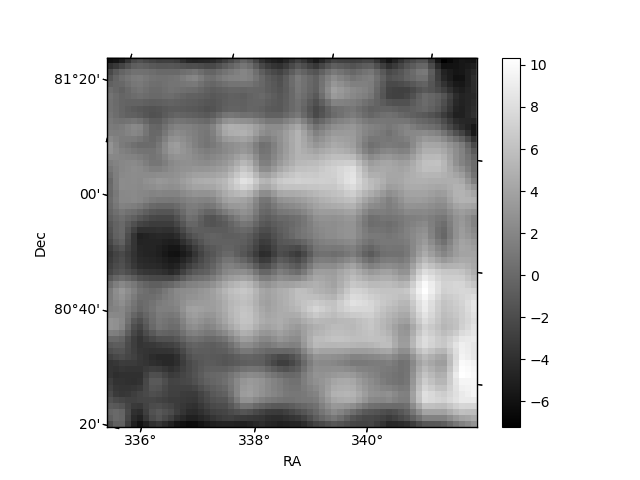
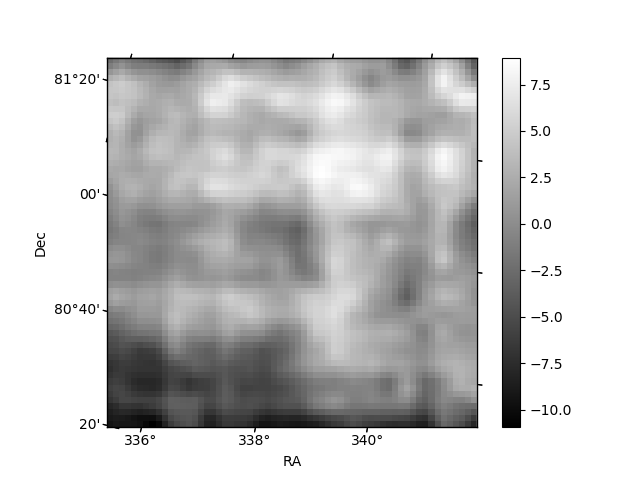
Histogram calculated using DETX and DETY for each event in the final _common_clean file
| Quadrant A | 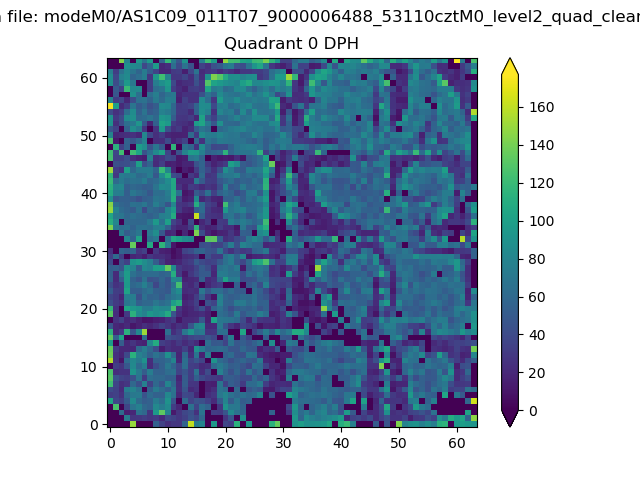 |
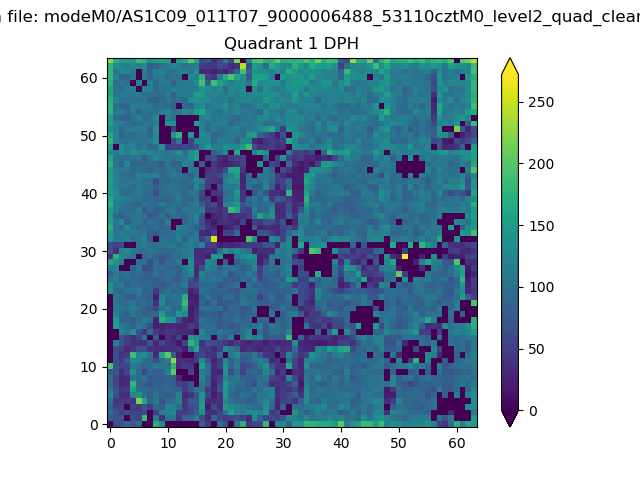 |
Quadrant B |
|---|---|---|---|
| Quadrant D | 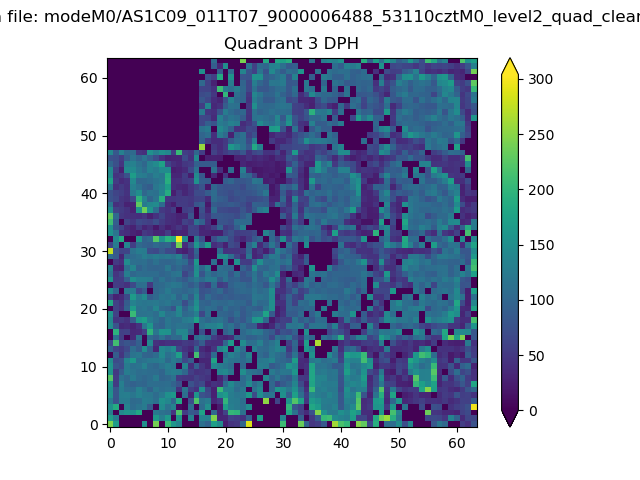 |
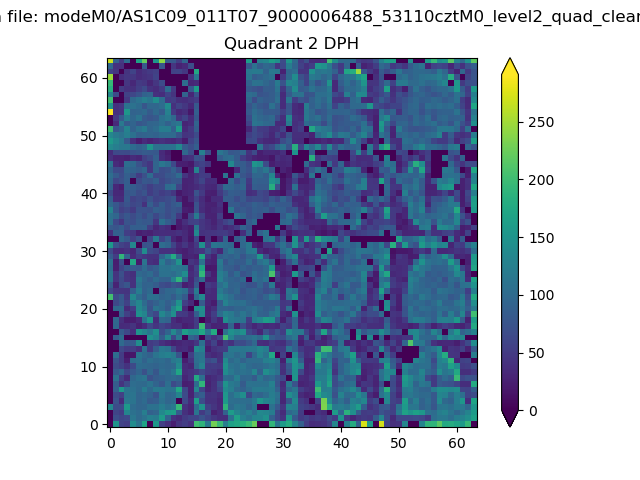 |
Quadrant C |
| Plot type | Count rate plots | Images |
|---|---|---|
| Comparison with Poisson distribution Blue bars denote a histogram of data divided into 1 sec bins. Red curve is a Poisson curve with rate = median count rate of data. |
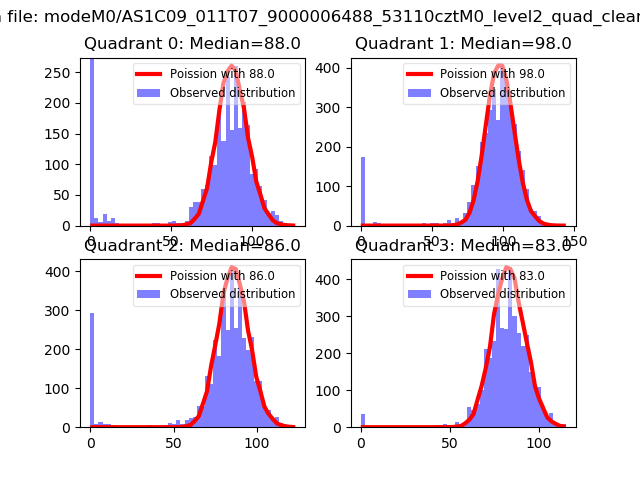 |
 |
| Quadrant-wise count rates Data is divided into 100 sec bins |
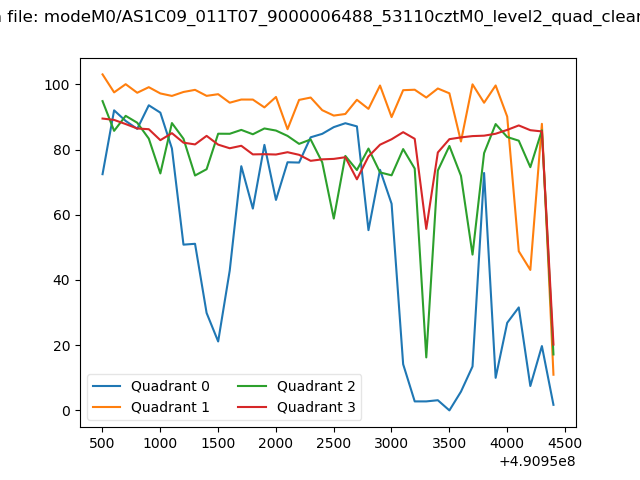 |
|
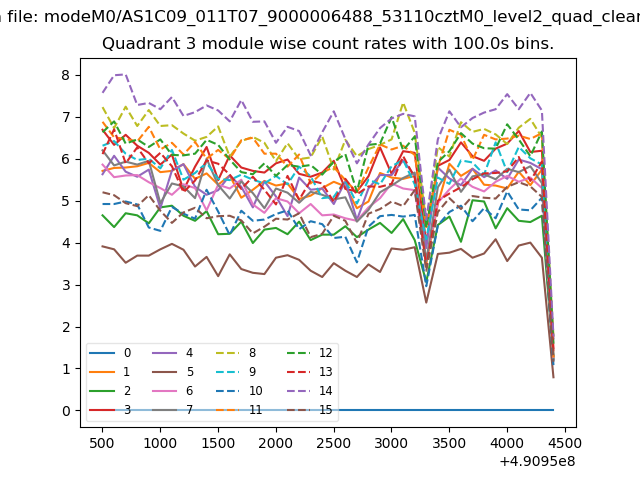
| Module-wise count rates for Quadrant A Data is divided into 100 sec bins |
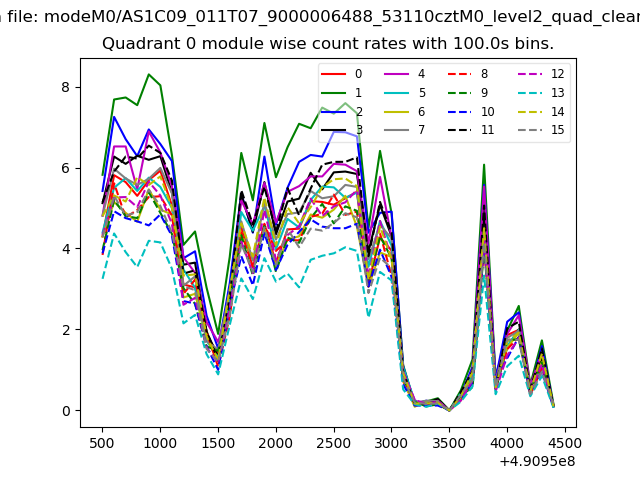 |
 |
| Module-wise count rates for Quadrant B Data is divided into 100 sec bins |
 |
 |
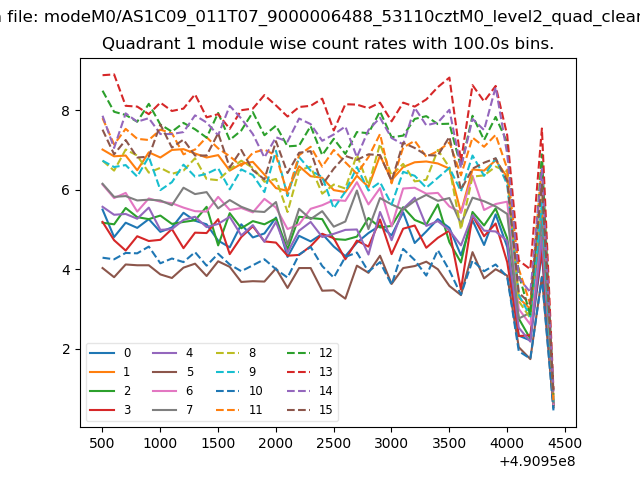
| Module-wise count rates for Quadrant C Data is divided into 100 sec bins |
 |
 |
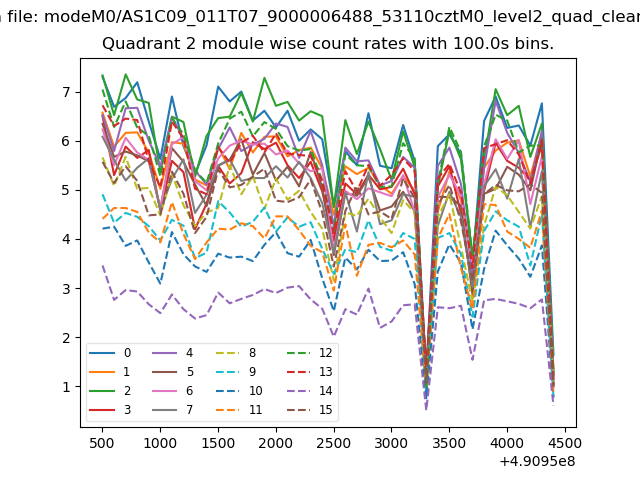
| Module-wise count rates for Quadrant D Data is divided into 100 sec bins |
 |
 |
| Parameter | Plot |
|---|---|
| CZT HV Monitor | 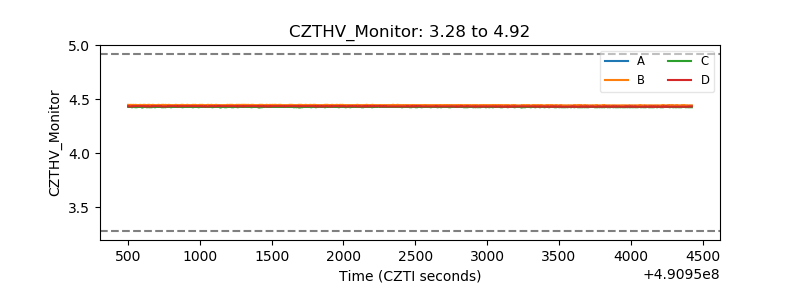 |
| D_VDD | 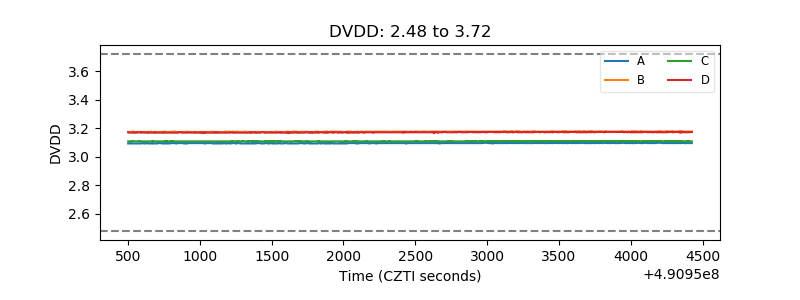 |
| Temperature 1 | 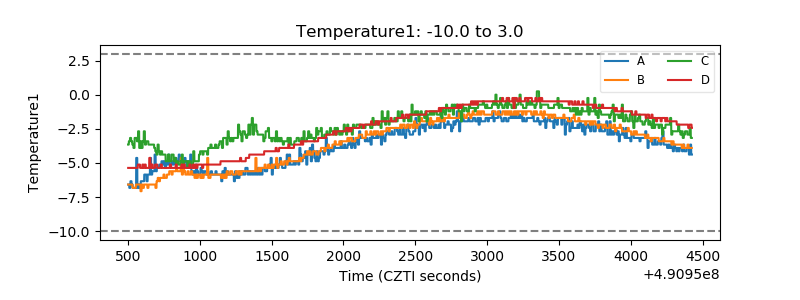 |
| Veto HV Monitor | 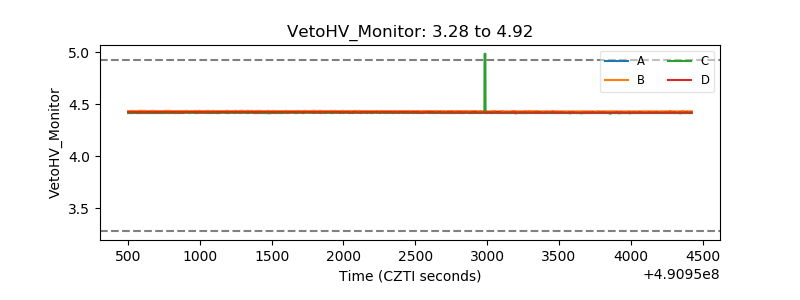 |
| Veto LLD | 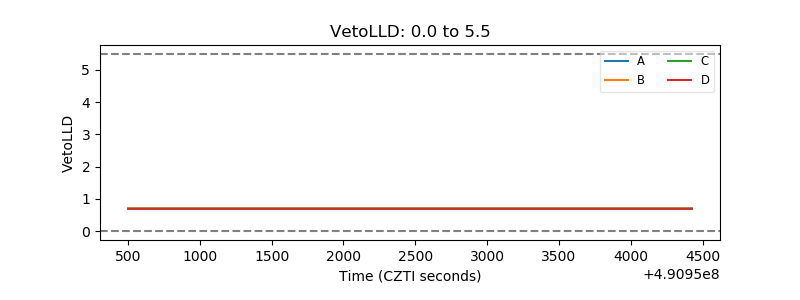 |
| Alpha Counter | 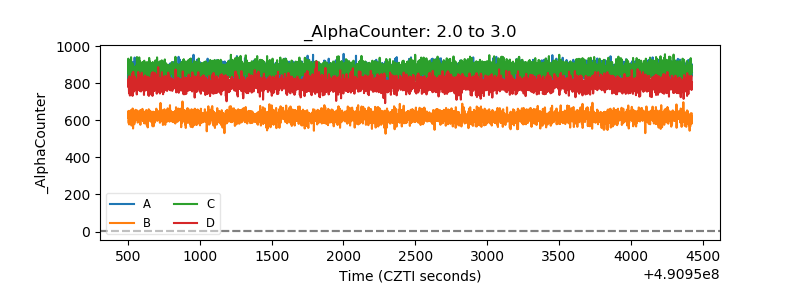 |
| _CPM_Rate | 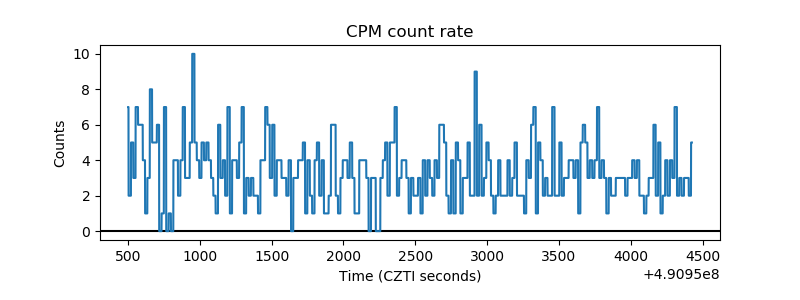 |
| CZT Counter | 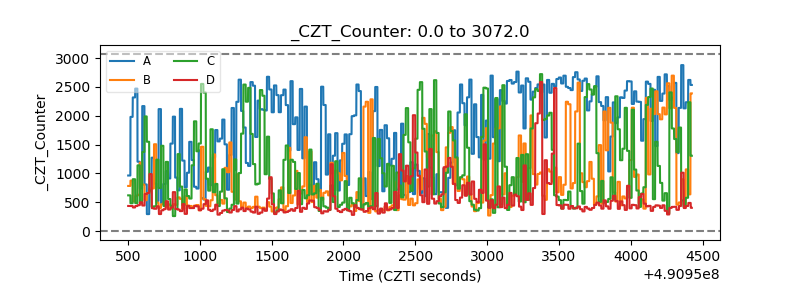 |
| +2.5 Volts monitor |  |
| +5 Volts monitor |  |
| _ROLL_ROT | 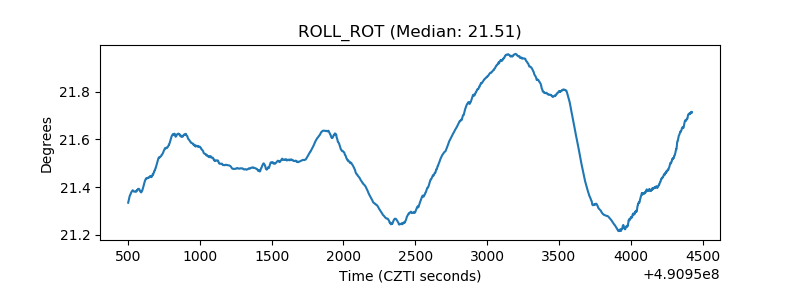 |
| _Roll_DEC | 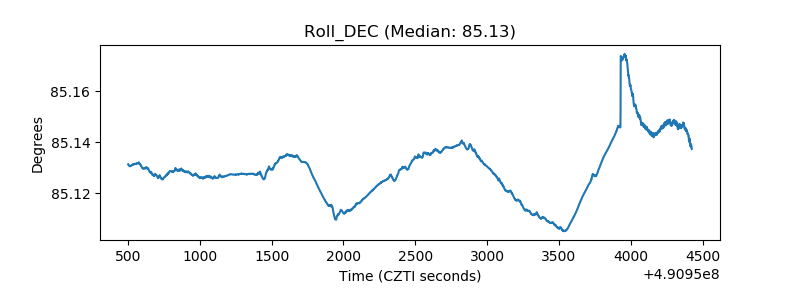 |
| _Roll_RA | 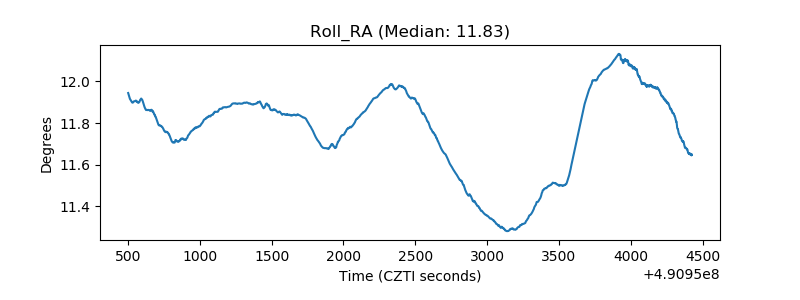 |
| Veto Counter | 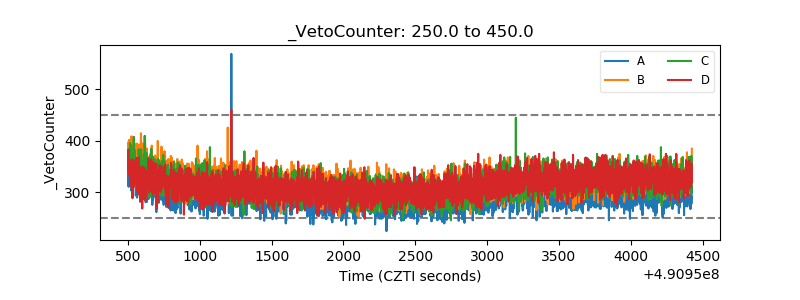 |