| Param | Original file | Final file |
|---|---|---|
| Filename | modeM0/AS1C09_011T07_9000006488_53111cztM0_level2.fits | modeM0/AS1C09_011T07_9000006488_53111cztM0_level2_quad_clean.evt |
| Size (bytes) | 826,041,600 | 88,464,960 |
| Size | 787.8 MB | 84.4 MB |
| Events in quadrant A | 12,509,974 | 375,477 |
| Events in quadrant B | 4,497,980 | 686,151 |
| Events in quadrant C | 8,964,336 | 517,880 |
| Events in quadrant D | 4,055,738 | 604,272 |
| Mode SS | |||
|---|---|---|---|
| Quadrant | BADHDUFLAG | Total packets | Discarded packets |
| A | 0 | 142 | 0 |
| B | 0 | 142 | 0 |
| C | 0 | 142 | 0 |
| D | 0 | 142 | 0 |
| Mode M0 | |||
|---|---|---|---|
| Quadrant | BADHDUFLAG | Total packets | Discarded packets |
| A | 0 | 42106 | 0 |
| B | 0 | 18442 | 0 |
| C | 0 | 31580 | 0 |
| D | 0 | 17015 | 0 |
| Quadrant | Total seconds | Saturated seconds | Saturation percentage |
|---|---|---|---|
| A | 7098 | 3547 | 49.971823% |
| B | 7099 | 275 | 3.873785% |
| C | 7099 | 1602 | 22.566559% |
| D | 7099 | 101 | 1.422736% |
Noise dominated data is calculated using 1-second bins in cleaned event files. If a bin has >2000 counts, and if more than 50% of those come from <1% of pixels, then it is considered to be noise-dominated and hence unusable.
| Quadrant | # 1 sec bins | Bins with >0 counts | Bins with >2000 counts | High rate bins dominated by noise | Noise dominated (total time) | Noise dominated (detector-on time) | Marked lightcurve |
|---|---|---|---|---|---|---|---|
| A | 7098 | 7098 | 3264 | 3264 | 45.98% | 45.98% | 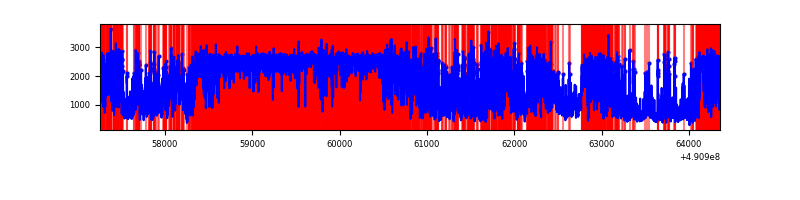 |
| B | 7099 | 7099 | 234 | 234 | 3.30% | 3.30% | 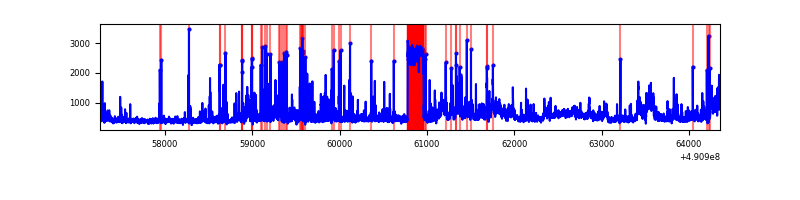 |
| C | 7098 | 7098 | 1508 | 1508 | 21.25% | 21.25% | 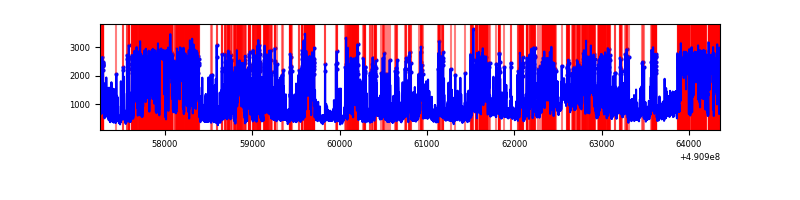 |
| D | 7099 | 7099 | 117 | 117 | 1.65% | 1.65% | 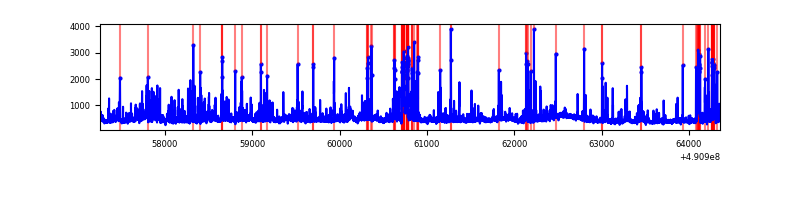 |
Top three noisy pixels from each quadrant. If the there are fewer than three noisy pixels in the level2.evt file, extra rows are filled as -1
| Pixel properties | Quadrant properties | ||||||
|---|---|---|---|---|---|---|---|
| Quadrant | DetID | PixID | Counts | Sigma | Mean | Median | Sigma |
| A | 9 | 191 | 9353220 | 62872.27 | 589 | 574 | 148.8 |
| A | 12 | 80 | 365837 | 2455.45 | 589 | 574 | 148.8 |
| A | 0 | 8 | 265135 | 1778.49 | 589 | 574 | 148.8 |
| B | 10 | 247 | 554690 | 3653.43 | 709 | 685 | 151.6 |
| B | 10 | 254 | 435113 | 2864.87 | 709 | 685 | 151.6 |
| B | 2 | 249 | 202373 | 1330.05 | 709 | 685 | 151.6 |
| C | 15 | 224 | 2436419 | 13550.51 | 648 | 640 | 179.8 |
| C | 15 | 157 | 1504616 | 8366.79 | 648 | 640 | 179.8 |
| C | 0 | 240 | 679228 | 3775.06 | 648 | 640 | 179.8 |
| D | 12 | 3 | 383850 | 1870.71 | 712 | 680 | 204.8 |
| D | 2 | 120 | 97910 | 474.69 | 712 | 680 | 204.8 |
| D | 3 | 12 | 94792 | 459.47 | 712 | 680 | 204.8 |
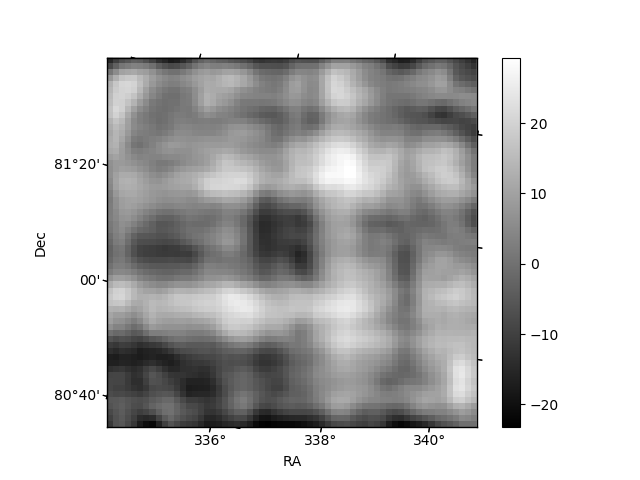
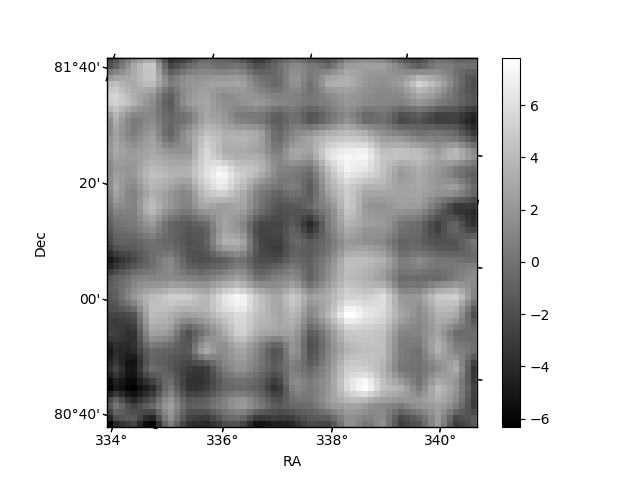
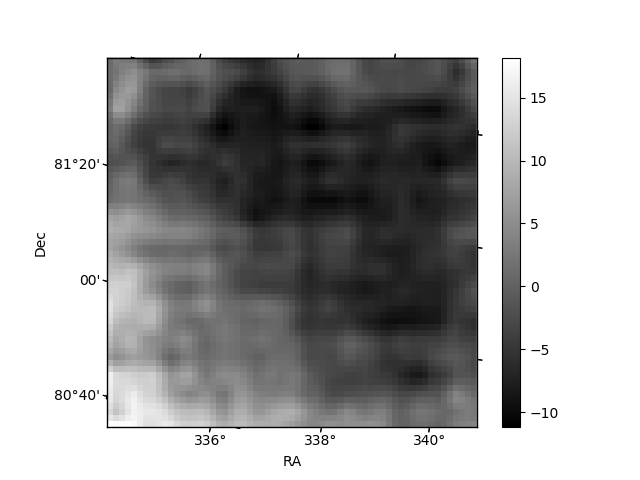
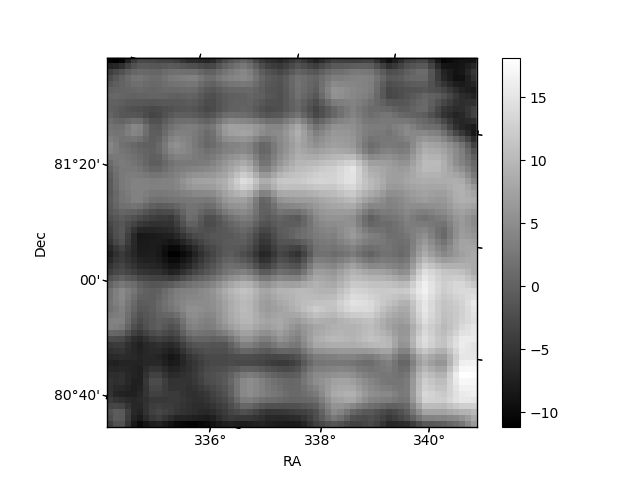
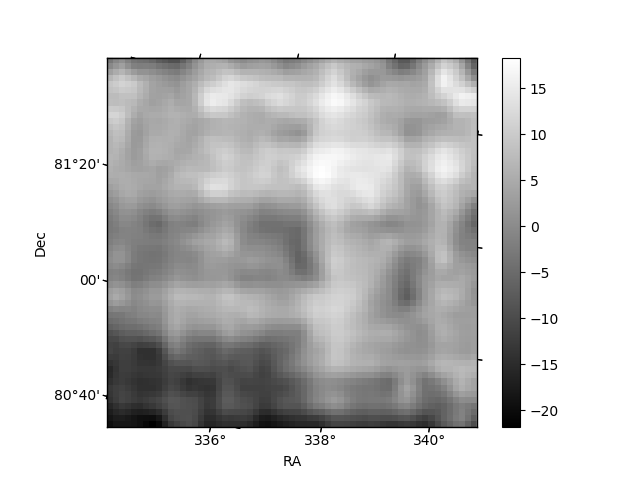
Histogram calculated using DETX and DETY for each event in the final _common_clean file
| Quadrant A | 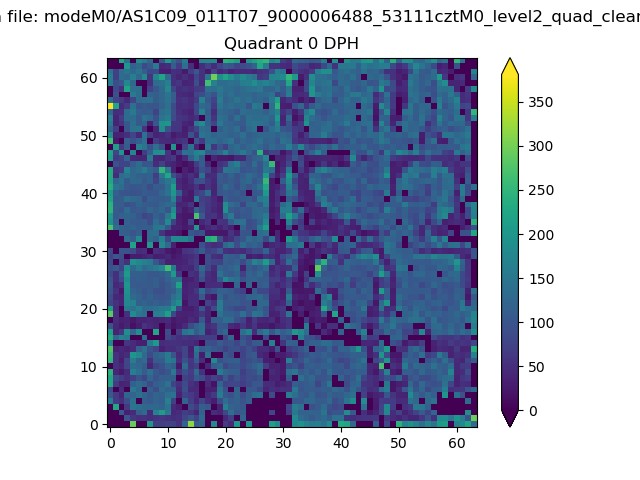 |
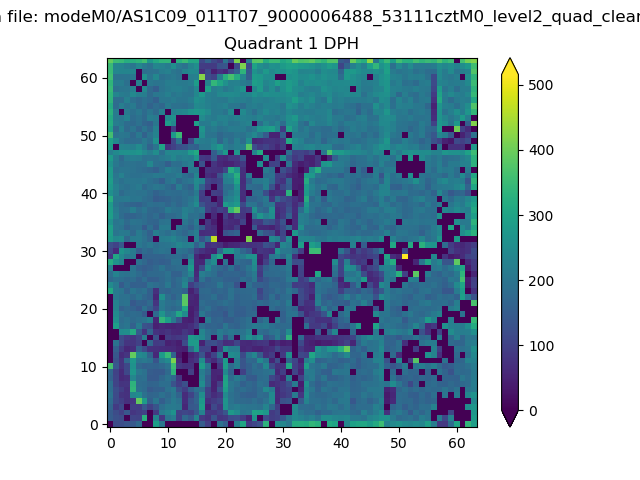 |
Quadrant B |
|---|---|---|---|
| Quadrant D | 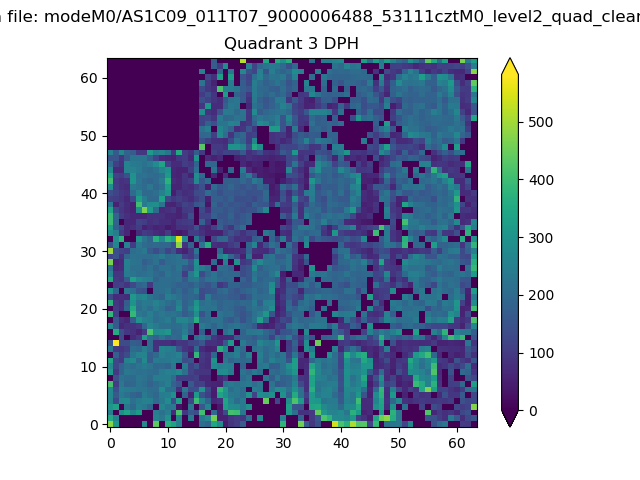 |
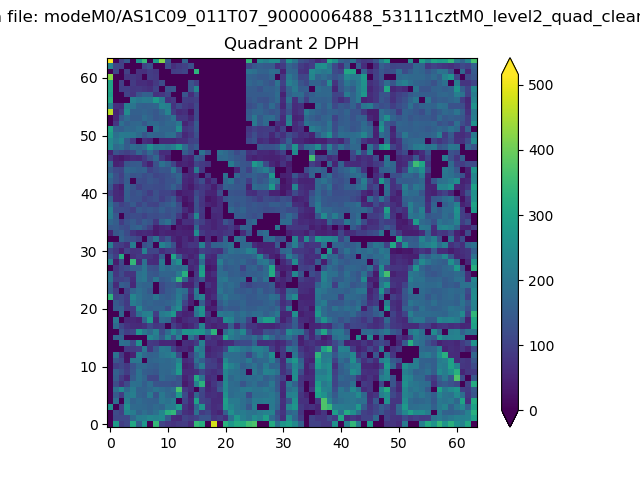 |
Quadrant C |
| Plot type | Count rate plots | Images |
|---|---|---|
| Comparison with Poisson distribution Blue bars denote a histogram of data divided into 1 sec bins. Red curve is a Poisson curve with rate = median count rate of data. |
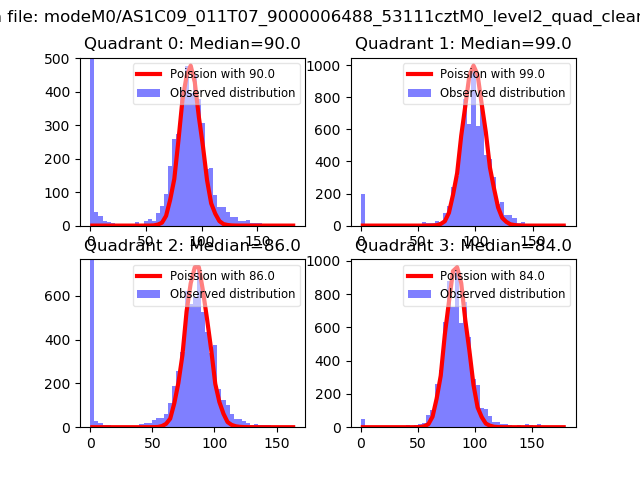 |
 |
| Quadrant-wise count rates Data is divided into 100 sec bins |
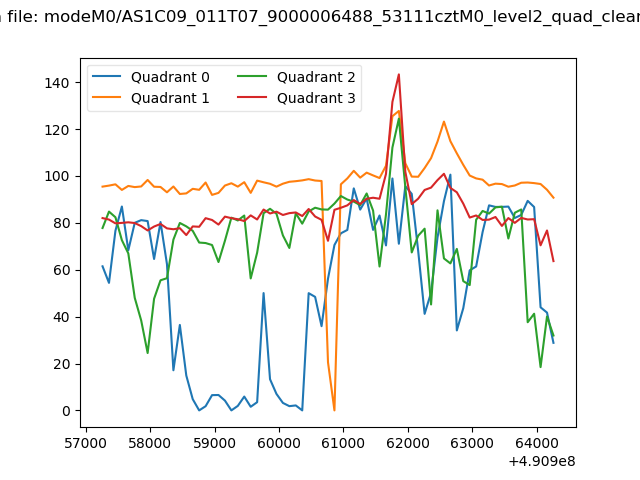 |
|
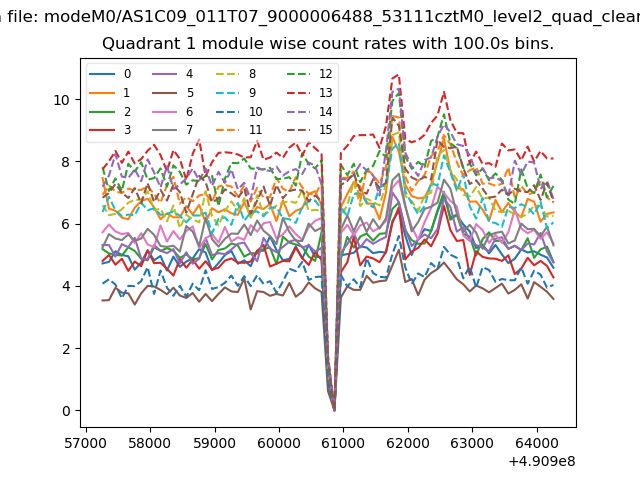
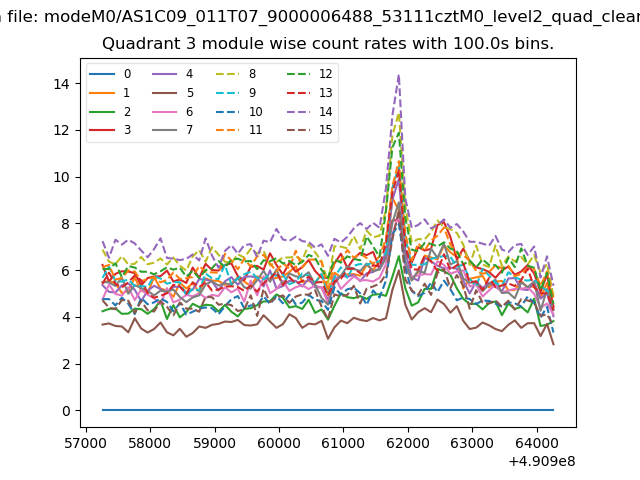
| Module-wise count rates for Quadrant A Data is divided into 100 sec bins |
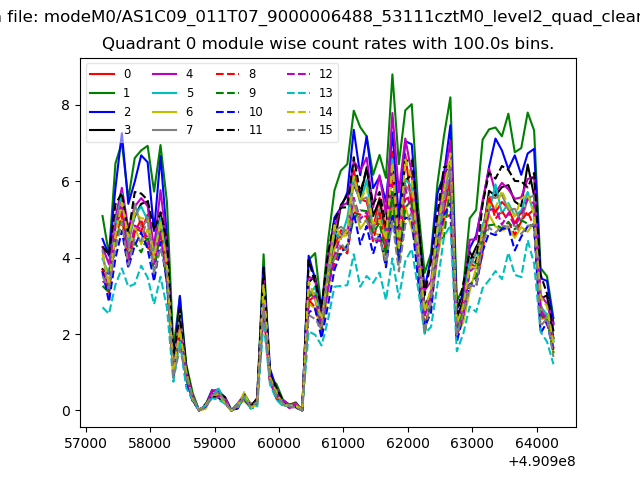 |
 |
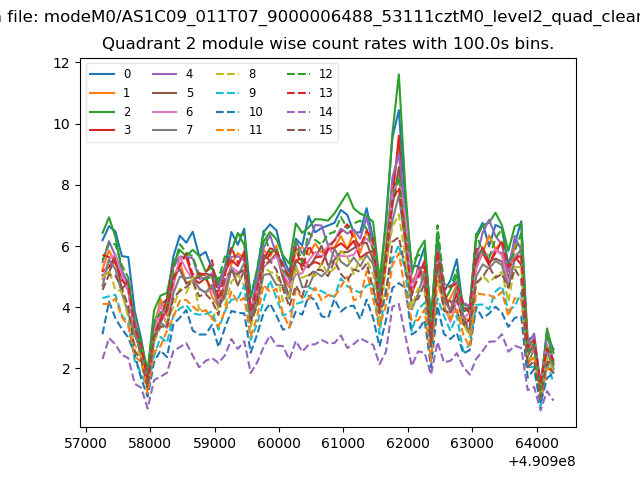
| Module-wise count rates for Quadrant B Data is divided into 100 sec bins |
 |
 |
| Module-wise count rates for Quadrant C Data is divided into 100 sec bins |
 |
 |
| Module-wise count rates for Quadrant D Data is divided into 100 sec bins |
 |
 |
| Parameter | Plot |
|---|---|
| CZT HV Monitor | 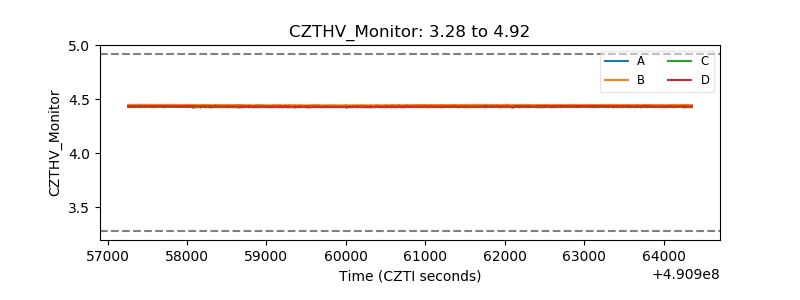 |
| D_VDD | 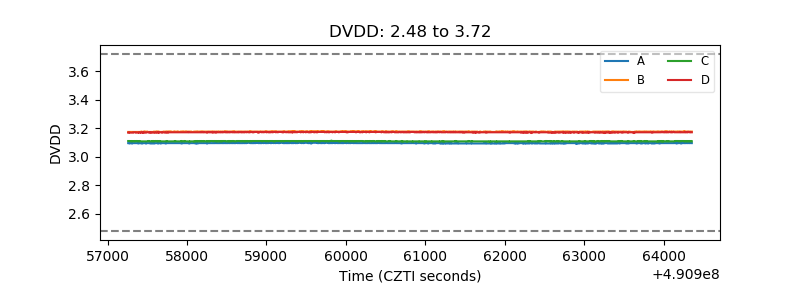 |
| Temperature 1 | 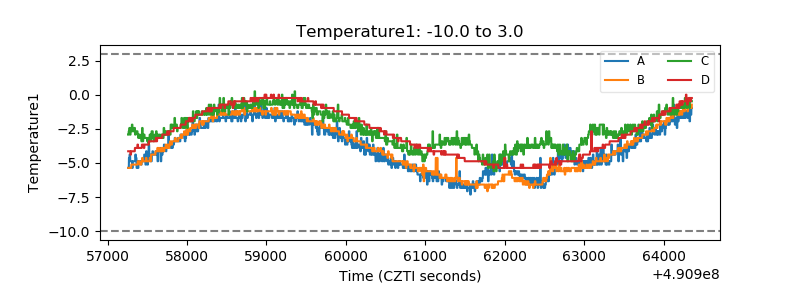 |
| Veto HV Monitor | 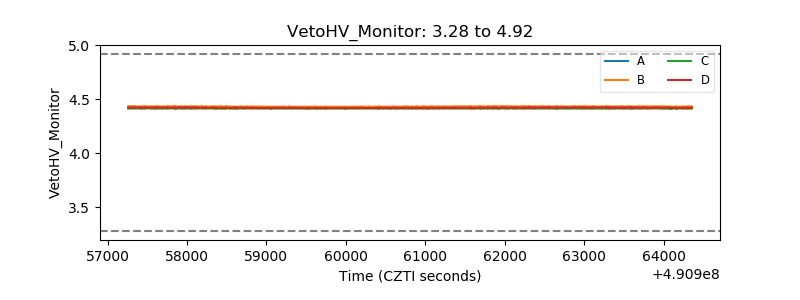 |
| Veto LLD | 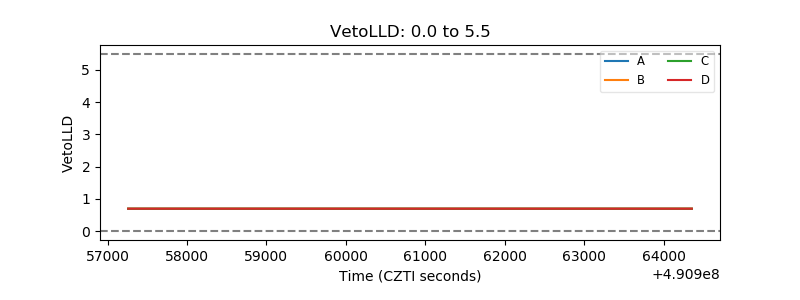 |
| Alpha Counter | 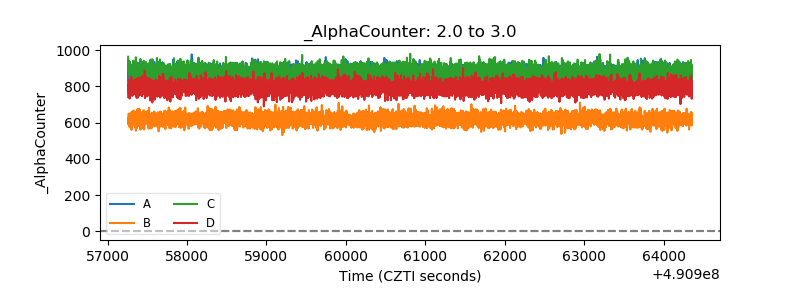 |
| _CPM_Rate | 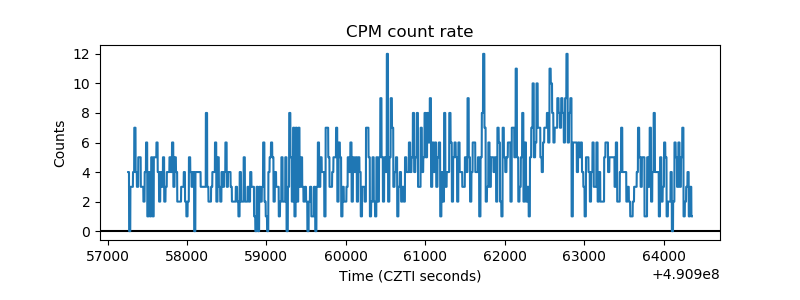 |
| CZT Counter | 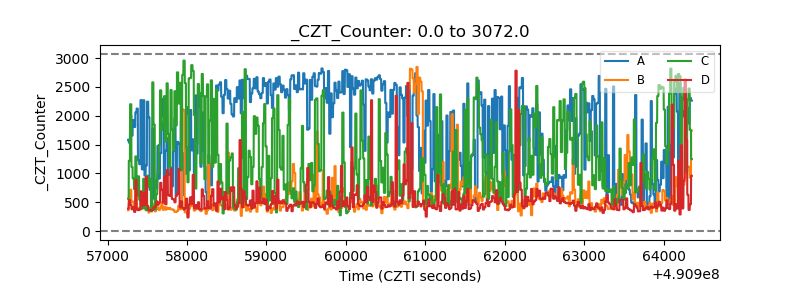 |
| +2.5 Volts monitor |  |
| +5 Volts monitor | 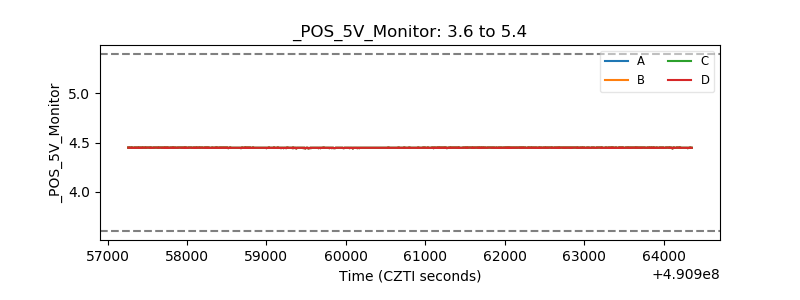 |
| _ROLL_ROT | 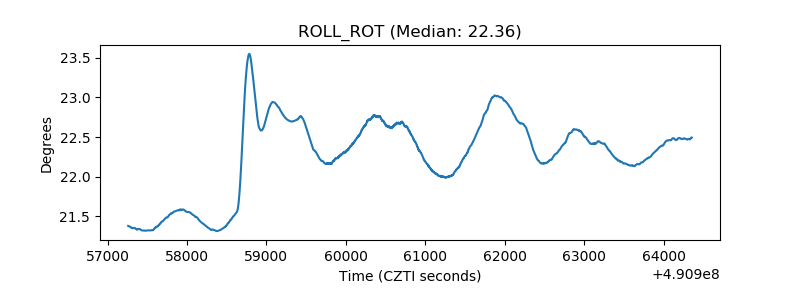 |
| _Roll_DEC | 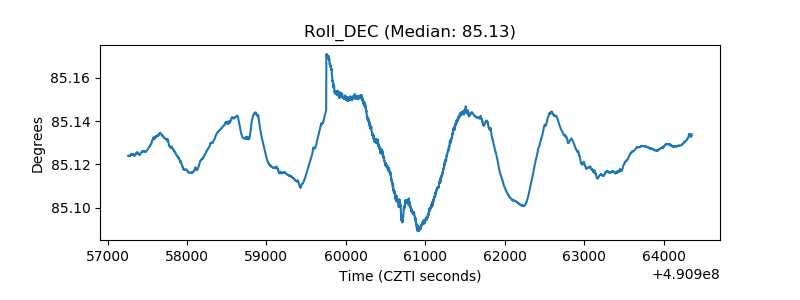 |
| _Roll_RA | 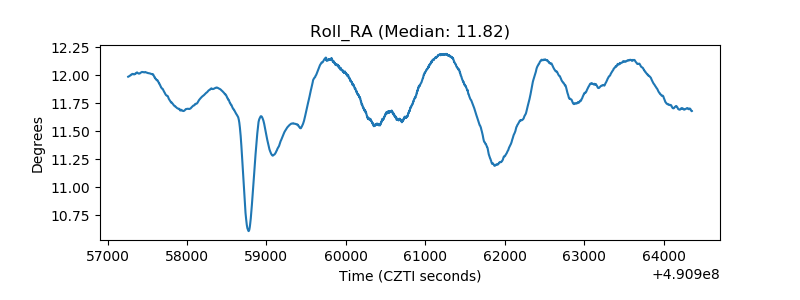 |
| Veto Counter | 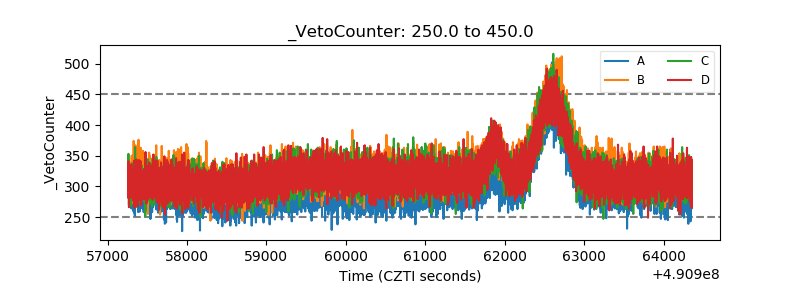 |