| Param | Original file | Final file |
|---|---|---|
| Filename | modeM0/AS1C09_011T07_9000006488_53124cztM0_level2.fits | modeM0/AS1C09_011T07_9000006488_53124cztM0_level2_quad_clean.evt |
| Size (bytes) | 1,049,722,560 | 67,677,120 |
| Size | 1001.1 MB | 64.5 MB |
| Events in quadrant A | 13,896,865 | 165,944 |
| Events in quadrant B | 9,019,767 | 510,110 |
| Events in quadrant C | 5,577,138 | 550,328 |
| Events in quadrant D | 9,867,632 | 373,848 |
| Mode SS | |||
|---|---|---|---|
| Quadrant | BADHDUFLAG | Total packets | Discarded packets |
| A | 0 | 128 | 0 |
| B | 0 | 128 | 0 |
| C | 0 | 128 | 0 |
| D | 0 | 128 | 0 |
| Mode M9 | |||
|---|---|---|---|
| Quadrant | BADHDUFLAG | Total packets | Discarded packets |
| A | 0 | 9 | 0 |
| B | 0 | 9 | 0 |
| C | 0 | 9 | 0 |
| D | 0 | 9 | 0 |
| Mode M0 | |||
|---|---|---|---|
| Quadrant | BADHDUFLAG | Total packets | Discarded packets |
| A | 0 | 45663 | 1 |
| B | 0 | 31278 | 1 |
| C | 0 | 21124 | 4 |
| D | 0 | 33840 | 1 |
| Quadrant | Total seconds | Saturated seconds | Saturation percentage |
|---|---|---|---|
| A | 6436 | 4918 | 76.413922% |
| B | 6437 | 1649 | 25.617524% |
| C | 6436 | 470 | 7.302672% |
| D | 6436 | 2465 | 38.300186% |
Noise dominated data is calculated using 1-second bins in cleaned event files. If a bin has >2000 counts, and if more than 50% of those come from <1% of pixels, then it is considered to be noise-dominated and hence unusable.
| Quadrant | # 1 sec bins | Bins with >0 counts | Bins with >2000 counts | High rate bins dominated by noise | Noise dominated (total time) | Noise dominated (detector-on time) | Marked lightcurve |
|---|---|---|---|---|---|---|---|
| A | 7286 | 6438 | 4705 | 4705 | 64.58% | 73.08% | 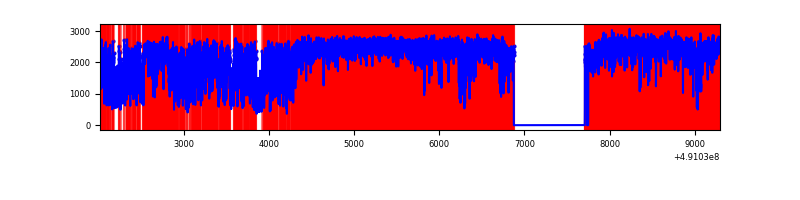 |
| B | 7287 | 6438 | 1387 | 1387 | 19.03% | 21.54% | 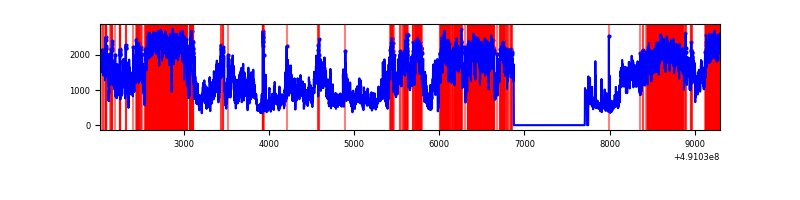 |
| C | 7286 | 6437 | 459 | 459 | 6.30% | 7.13% | 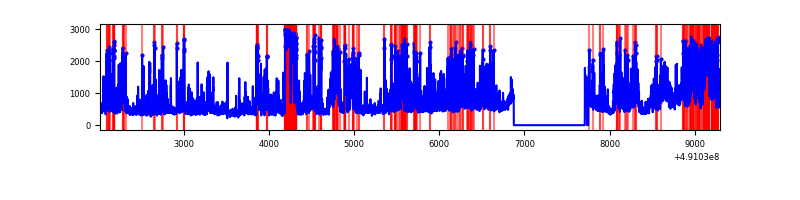 |
| D | 7286 | 6438 | 2442 | 2442 | 33.52% | 37.93% | 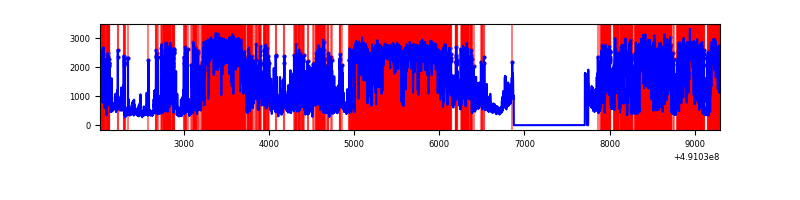 |
Top three noisy pixels from each quadrant. If the there are fewer than three noisy pixels in the level2.evt file, extra rows are filled as -1
| Pixel properties | Quadrant properties | ||||||
|---|---|---|---|---|---|---|---|
| Quadrant | DetID | PixID | Counts | Sigma | Mean | Median | Sigma |
| A | 9 | 191 | 11840155 | 117648.65 | 395 | 384 | 100.6 |
| A | 3 | 62 | 200083 | 1984.35 | 395 | 384 | 100.6 |
| A | 15 | 174 | 107422 | 1063.6 | 395 | 384 | 100.6 |
| B | 10 | 254 | 5983305 | 45859.85 | 615 | 595 | 130.5 |
| B | 4 | 171 | 126056 | 961.71 | 615 | 595 | 130.5 |
| B | 1 | 255 | 112933 | 861.12 | 615 | 595 | 130.5 |
| C | 15 | 224 | 1197323 | 7059.34 | 616 | 611 | 169.5 |
| C | 9 | 38 | 631908 | 3723.99 | 616 | 611 | 169.5 |
| C | 1 | 241 | 554767 | 3268.94 | 616 | 611 | 169.5 |
| D | 12 | 3 | 6392062 | 43057.56 | 511 | 485 | 148.4 |
| D | 3 | 224 | 315288 | 2120.71 | 511 | 485 | 148.4 |
| D | 2 | 120 | 250440 | 1683.85 | 511 | 485 | 148.4 |
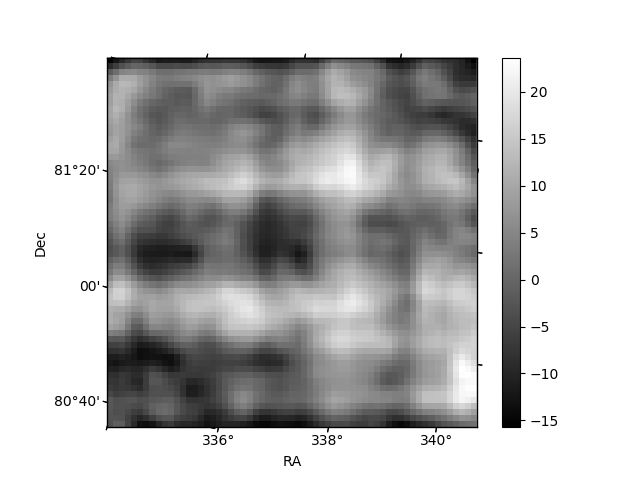
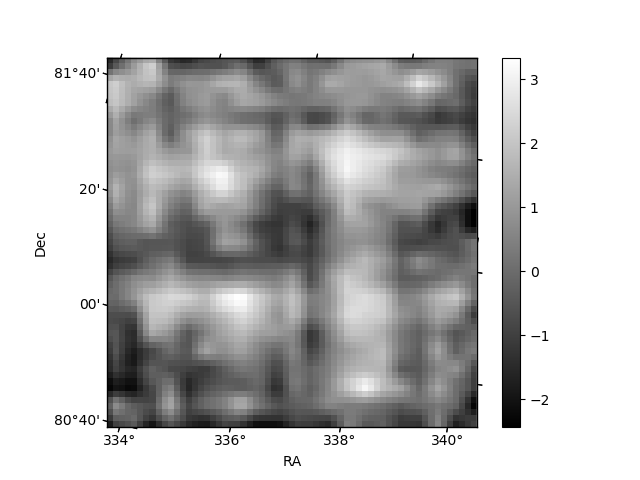
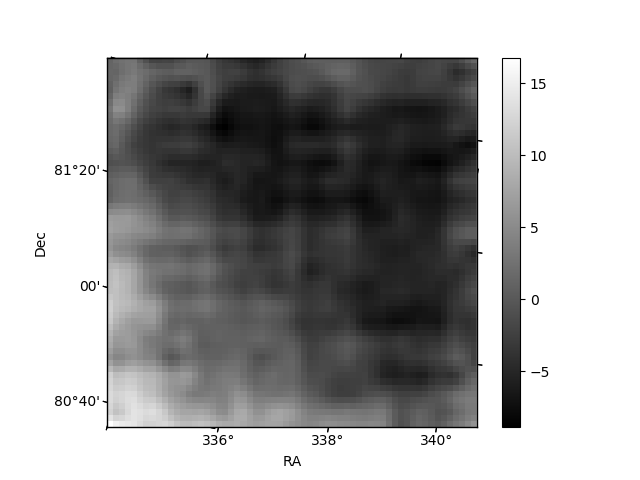
Histogram calculated using DETX and DETY for each event in the final _common_clean file
| Quadrant A | 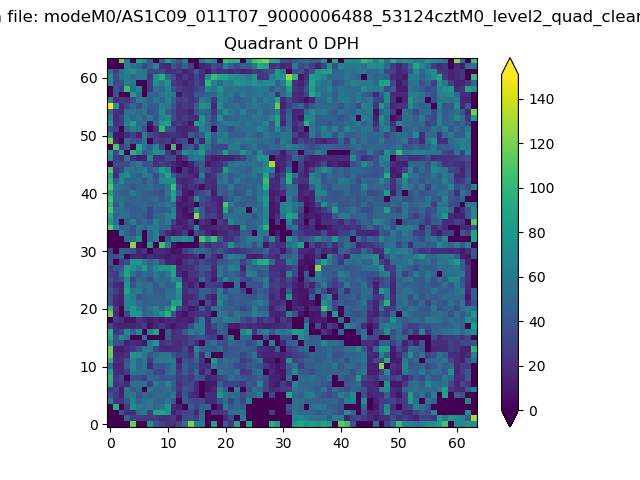 |
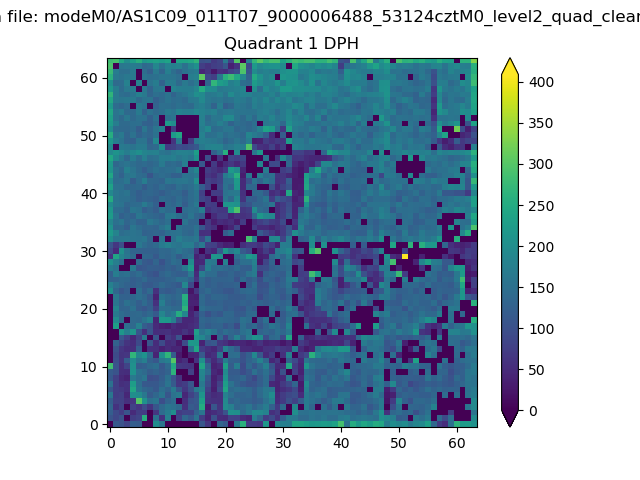 |
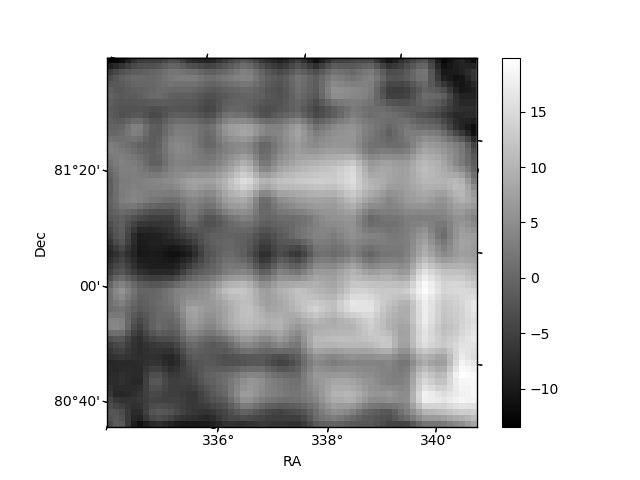
Quadrant B |
|---|---|---|---|
| Quadrant D |  |
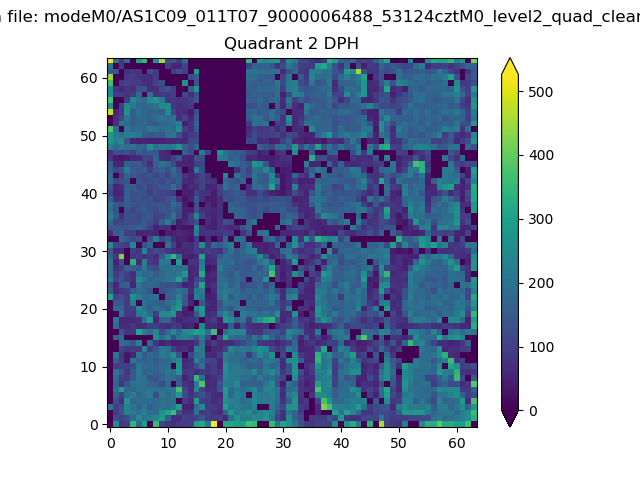 |
Quadrant C |
| Plot type | Count rate plots | Images |
|---|---|---|
| Comparison with Poisson distribution Blue bars denote a histogram of data divided into 1 sec bins. Red curve is a Poisson curve with rate = median count rate of data. |
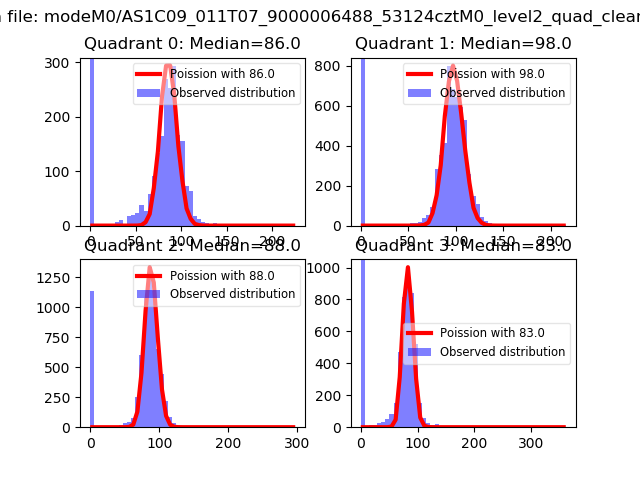 |
 |
| Quadrant-wise count rates Data is divided into 100 sec bins |
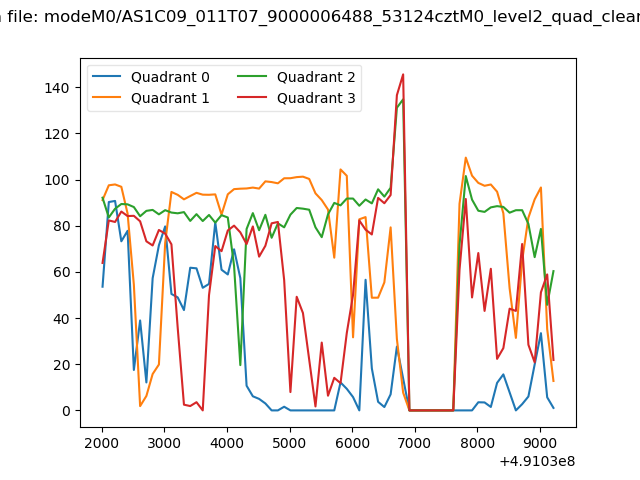 |
|
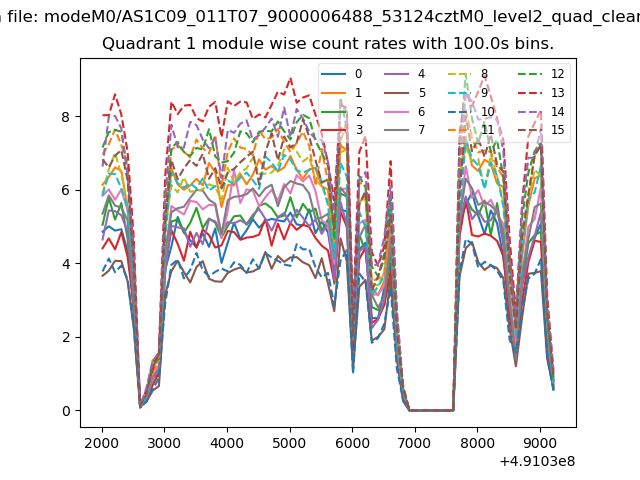
| Module-wise count rates for Quadrant A Data is divided into 100 sec bins |
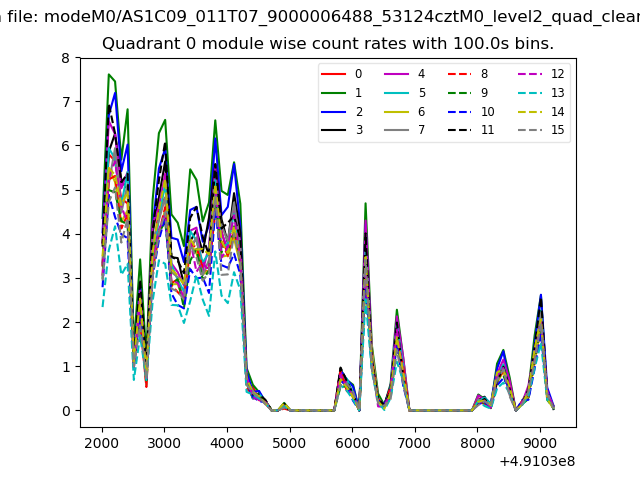 |
 |
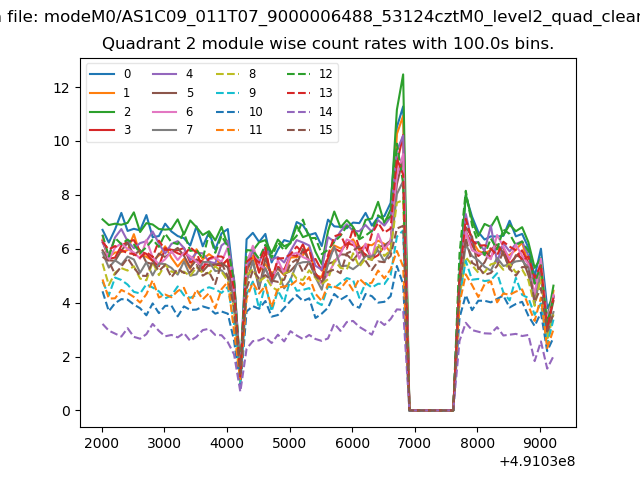
| Module-wise count rates for Quadrant B Data is divided into 100 sec bins |
 |
 |
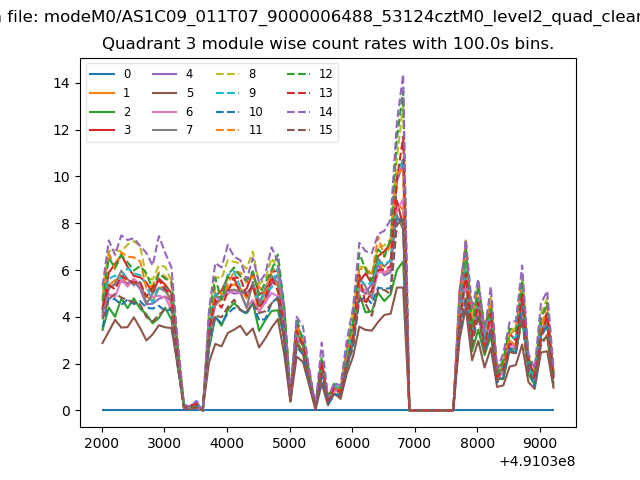
| Module-wise count rates for Quadrant C Data is divided into 100 sec bins |
 |
 |
| Module-wise count rates for Quadrant D Data is divided into 100 sec bins |
 |
 |
| Parameter | Plot |
|---|---|
| CZT HV Monitor | 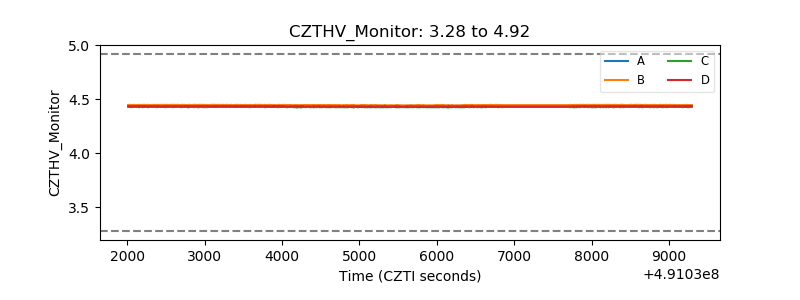 |
| D_VDD | 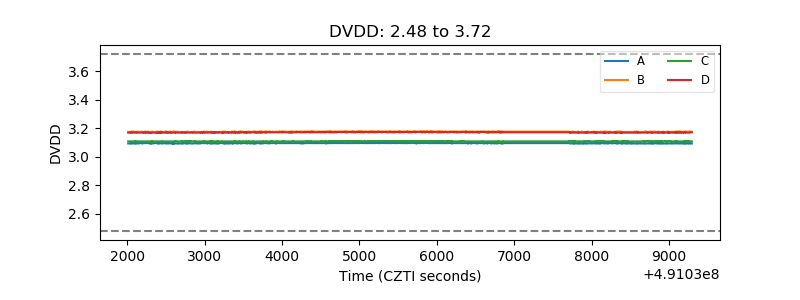 |
| Temperature 1 | 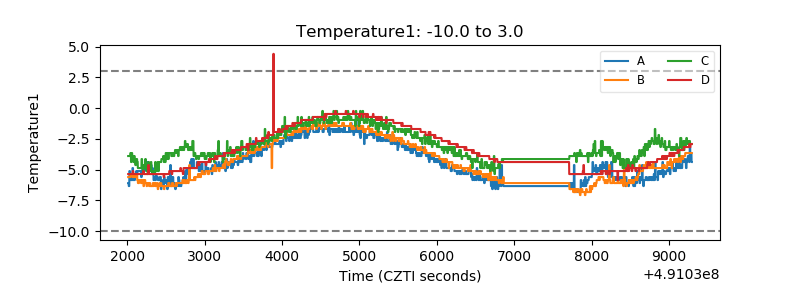 |
| Veto HV Monitor | 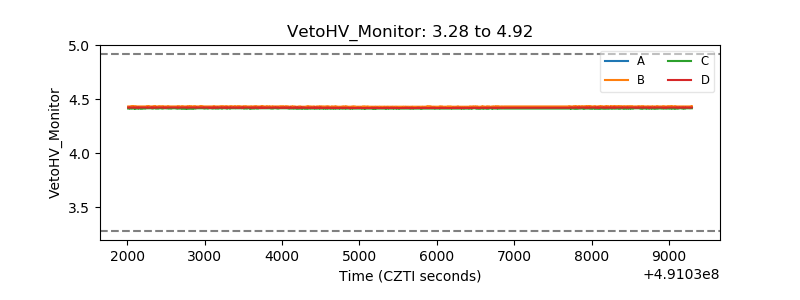 |
| Veto LLD | 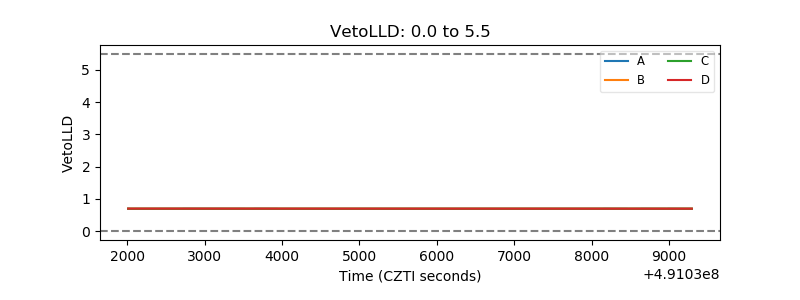 |
| Alpha Counter | 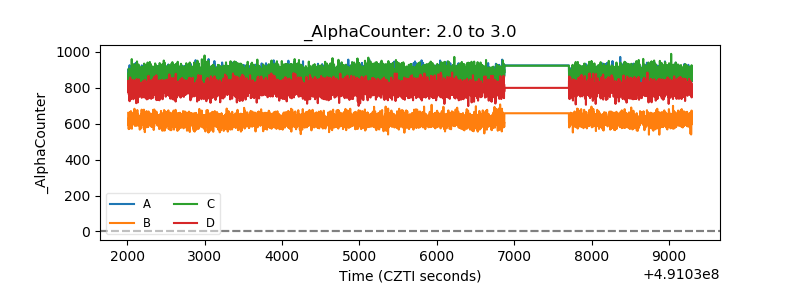 |
| _CPM_Rate | 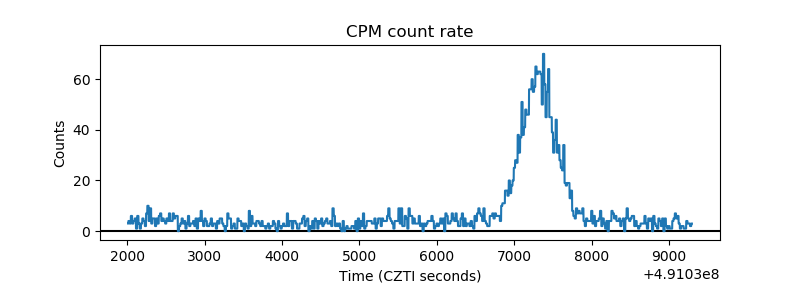 |
| CZT Counter | 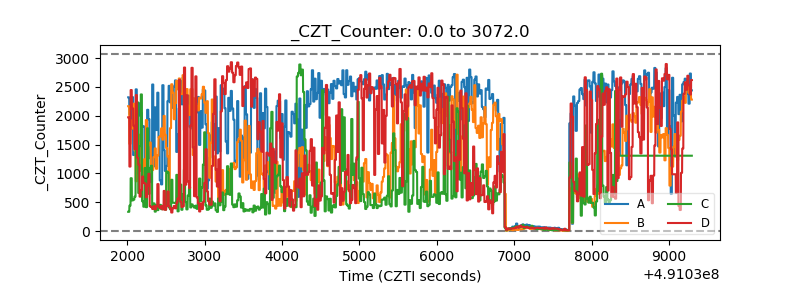 |
| +2.5 Volts monitor |  |
| +5 Volts monitor |  |
| _ROLL_ROT | 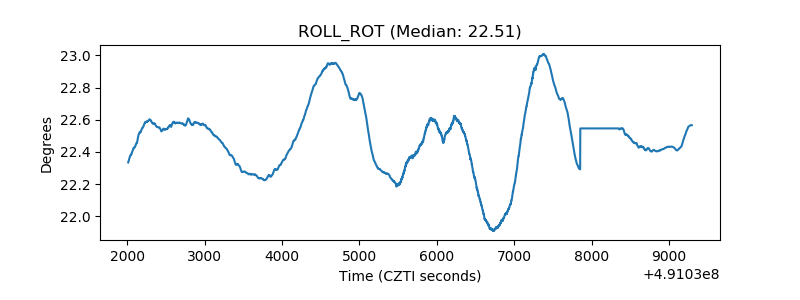 |
| _Roll_DEC | 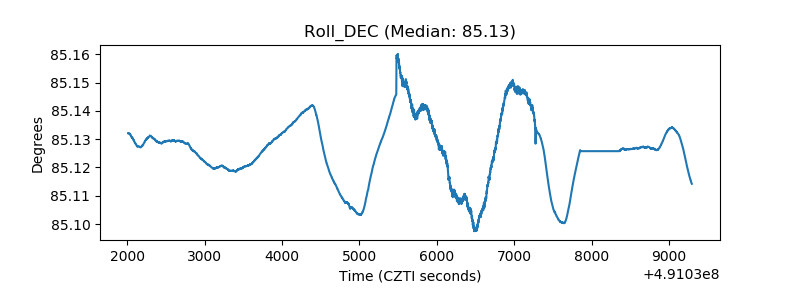 |
| _Roll_RA | 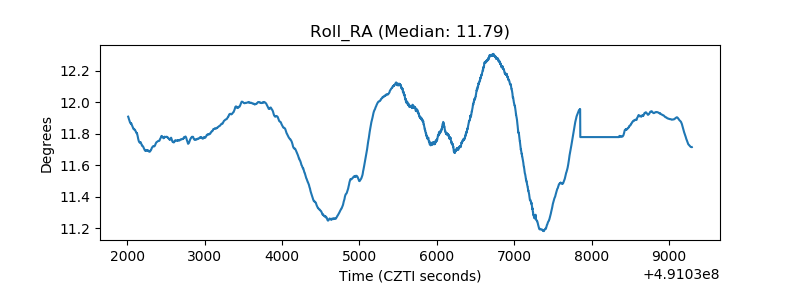 |
| Veto Counter | 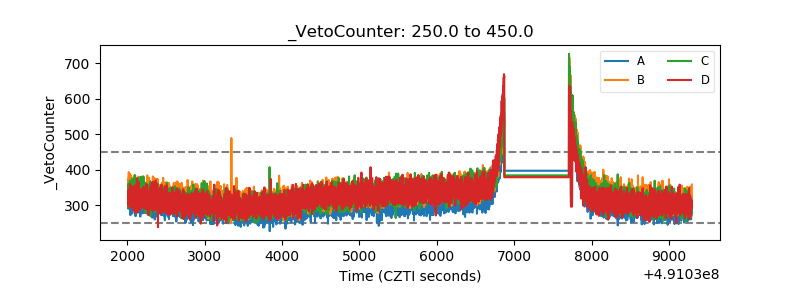 |