| Param | Original file | Final file |
|---|---|---|
| Filename | modeM0/AS1C09_011T07_9000006488_53125cztM0_level2.fits | modeM0/AS1C09_011T07_9000006488_53125cztM0_level2_quad_clean.evt |
| Size (bytes) | 1,063,788,480 | 76,216,320 |
| Size | 1014.5 MB | 72.7 MB |
| Events in quadrant A | 15,619,072 | 138,984 |
| Events in quadrant B | 6,986,542 | 629,754 |
| Events in quadrant C | 8,414,764 | 561,145 |
| Events in quadrant D | 7,807,853 | 480,983 |
| Mode SS | |||
|---|---|---|---|
| Quadrant | BADHDUFLAG | Total packets | Discarded packets |
| A | 0 | 144 | 0 |
| B | 0 | 144 | 0 |
| C | 0 | 144 | 0 |
| D | 0 | 144 | 0 |
| Mode M0 | |||
|---|---|---|---|
| Quadrant | BADHDUFLAG | Total packets | Discarded packets |
| A | 0 | 51252 | 1 |
| B | 0 | 25752 | 1 |
| C | 0 | 30045 | 1 |
| D | 0 | 28223 | 1 |
| Quadrant | Total seconds | Saturated seconds | Saturation percentage |
|---|---|---|---|
| A | 7120 | 5911 | 83.019663% |
| B | 7120 | 1130 | 15.870787% |
| C | 7120 | 1136 | 15.955056% |
| D | 7121 | 1791 | 25.150962% |
Noise dominated data is calculated using 1-second bins in cleaned event files. If a bin has >2000 counts, and if more than 50% of those come from <1% of pixels, then it is considered to be noise-dominated and hence unusable.
| Quadrant | # 1 sec bins | Bins with >0 counts | Bins with >2000 counts | High rate bins dominated by noise | Noise dominated (total time) | Noise dominated (detector-on time) | Marked lightcurve |
|---|---|---|---|---|---|---|---|
| A | 7180 | 7121 | 5281 | 5281 | 73.55% | 74.16% | 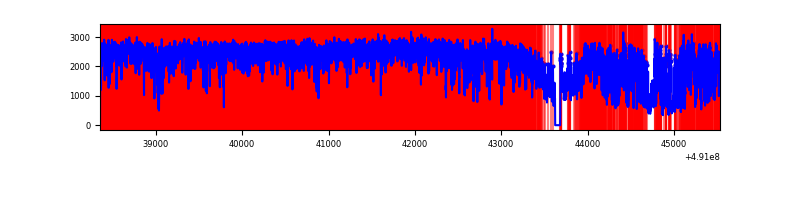 |
| B | 7180 | 7121 | 796 | 796 | 11.09% | 11.18% | 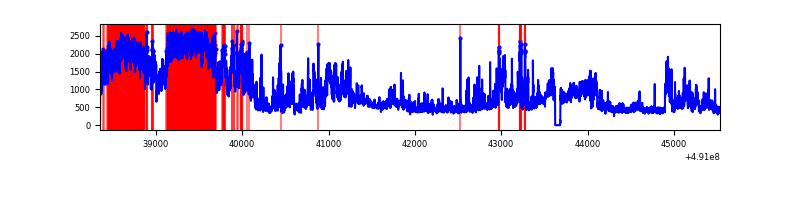 |
| C | 7180 | 7121 | 1115 | 1115 | 15.53% | 15.66% | 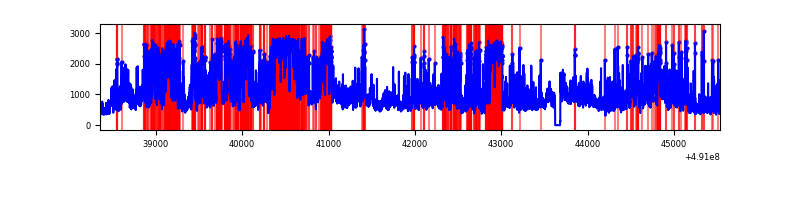 |
| D | 7181 | 7122 | 1508 | 1508 | 21.00% | 21.17% | 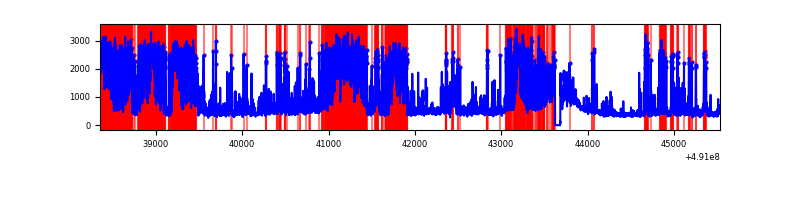 |
Top three noisy pixels from each quadrant. If the there are fewer than three noisy pixels in the level2.evt file, extra rows are filled as -1
| Pixel properties | Quadrant properties | ||||||
|---|---|---|---|---|---|---|---|
| Quadrant | DetID | PixID | Counts | Sigma | Mean | Median | Sigma |
| A | 9 | 191 | 13512298 | 129528.31 | 415 | 403 | 104.3 |
| A | 3 | 62 | 183580 | 1755.97 | 415 | 403 | 104.3 |
| A | 0 | 8 | 118577 | 1132.84 | 415 | 403 | 104.3 |
| B | 10 | 254 | 3619095 | 23200.78 | 729 | 704 | 156.0 |
| B | 0 | 197 | 170951 | 1091.61 | 729 | 704 | 156.0 |
| B | 4 | 81 | 57778 | 365.95 | 729 | 704 | 156.0 |
| C | 0 | 240 | 2059530 | 10758.32 | 695 | 687 | 191.4 |
| C | 9 | 38 | 1380243 | 7208.76 | 695 | 687 | 191.4 |
| C | 15 | 224 | 1149421 | 6002.62 | 695 | 687 | 191.4 |
| D | 12 | 3 | 3955227 | 21379.9 | 648 | 617 | 185.0 |
| D | 2 | 120 | 328337 | 1771.76 | 648 | 617 | 185.0 |
| D | 8 | 176 | 163585 | 881.06 | 648 | 617 | 185.0 |
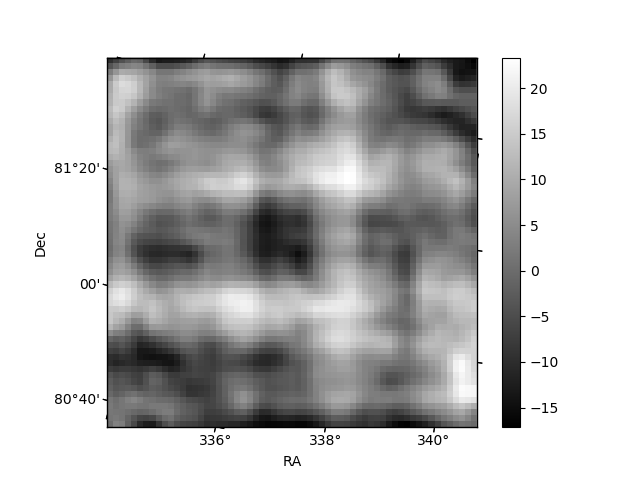
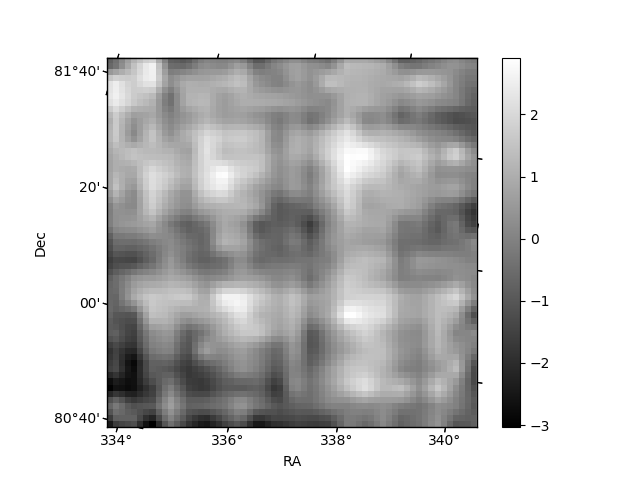
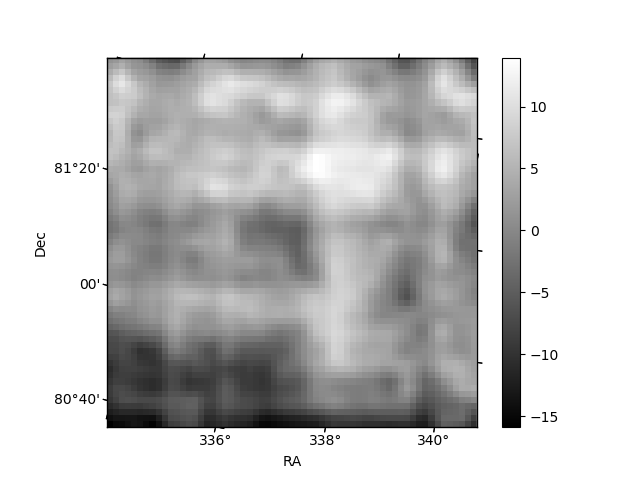
Histogram calculated using DETX and DETY for each event in the final _common_clean file
| Quadrant A | 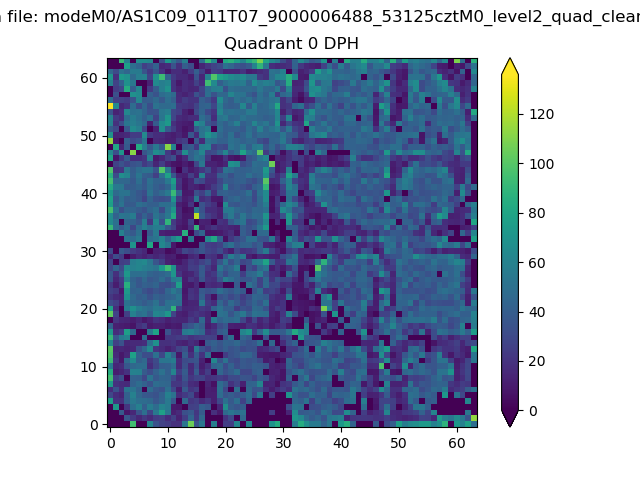 |
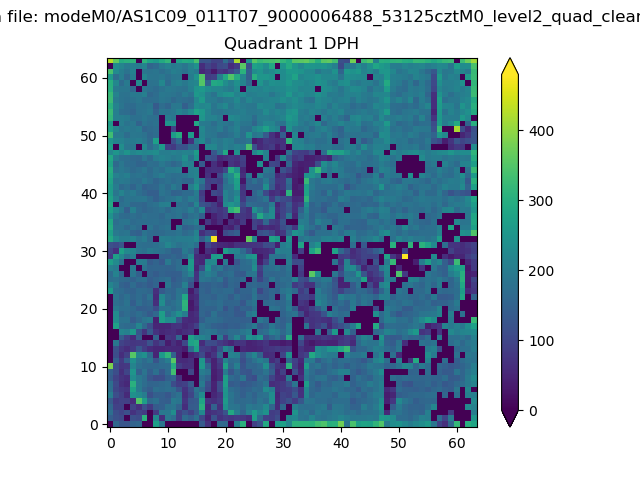 |
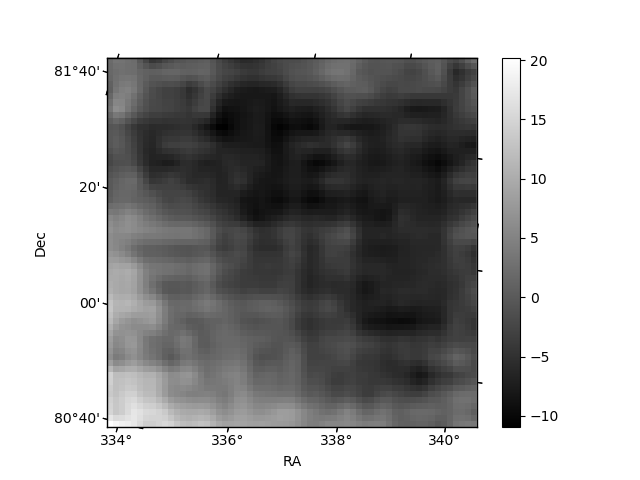
Quadrant B |
|---|---|---|---|
| Quadrant D | 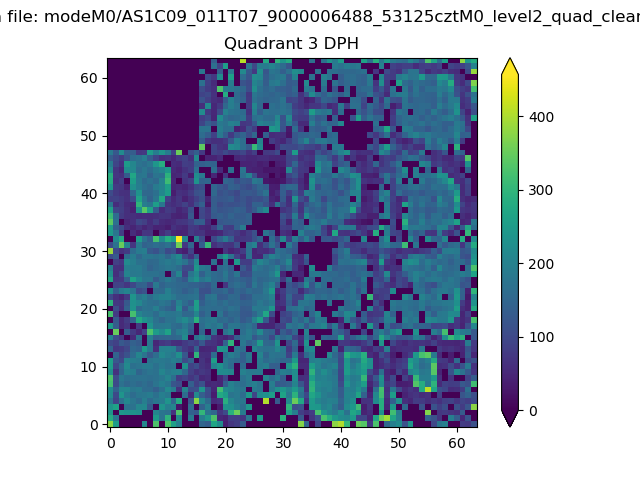 |
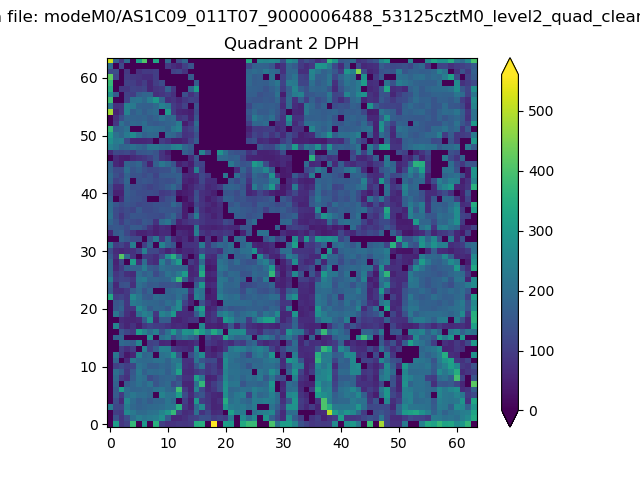 |
Quadrant C |
| Plot type | Count rate plots | Images |
|---|---|---|
| Comparison with Poisson distribution Blue bars denote a histogram of data divided into 1 sec bins. Red curve is a Poisson curve with rate = median count rate of data. |
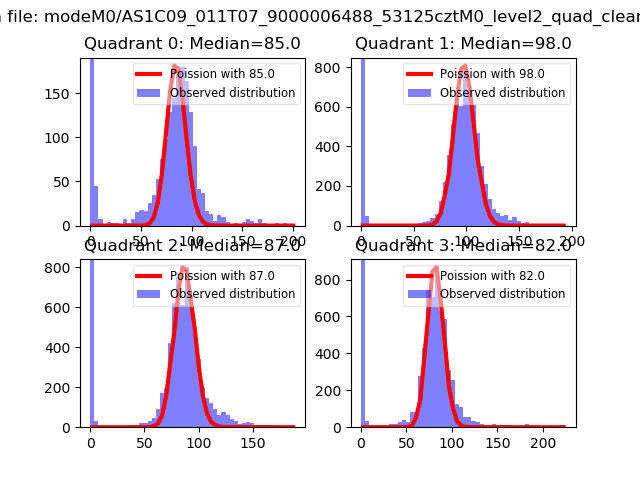 |
 |
| Quadrant-wise count rates Data is divided into 100 sec bins |
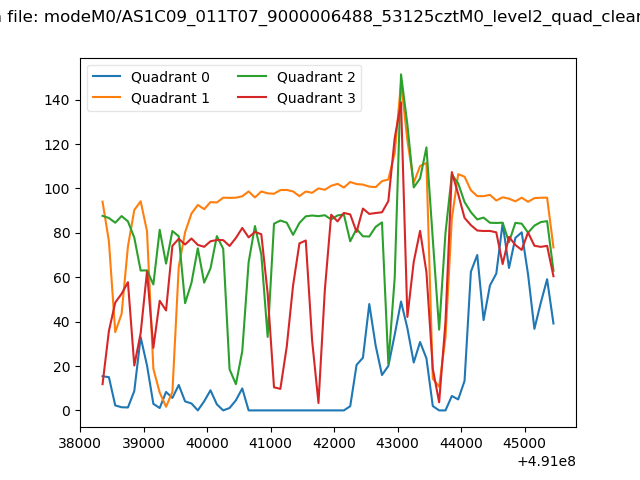 |
|
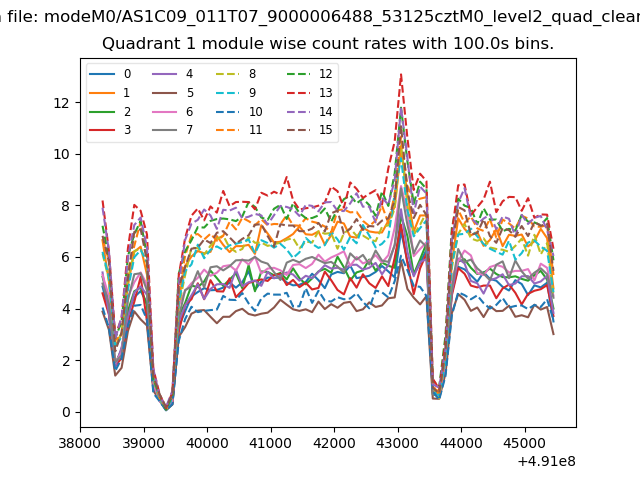
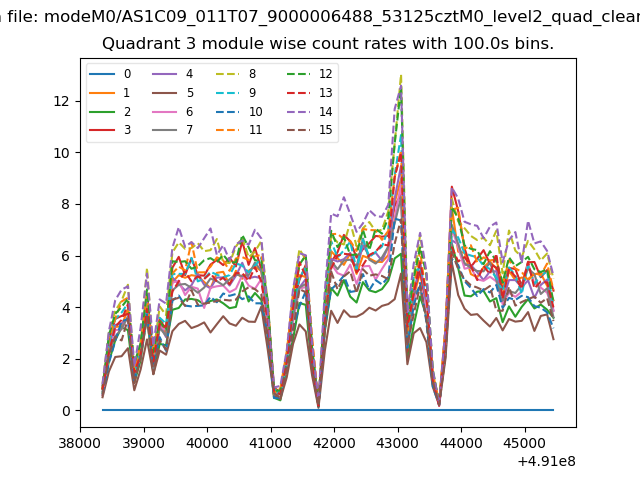
| Module-wise count rates for Quadrant A Data is divided into 100 sec bins |
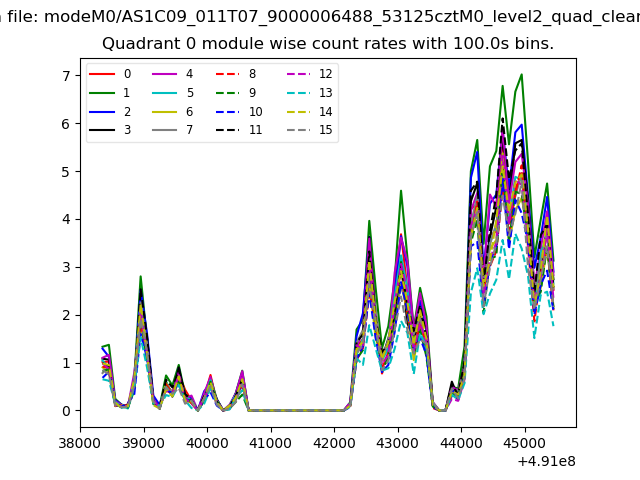 |
 |
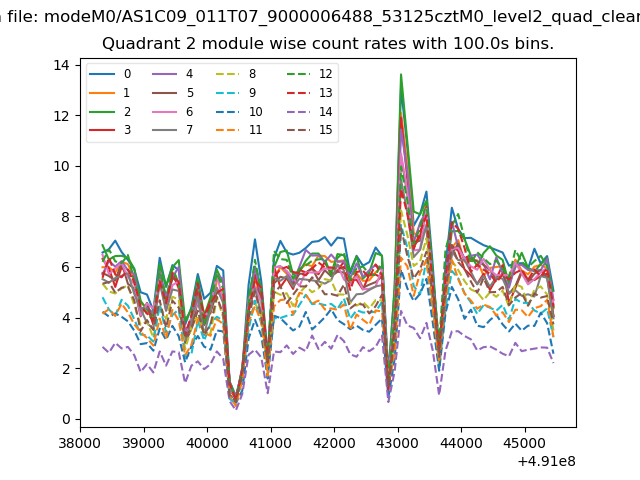
| Module-wise count rates for Quadrant B Data is divided into 100 sec bins |
 |
 |
| Module-wise count rates for Quadrant C Data is divided into 100 sec bins |
 |
 |
| Module-wise count rates for Quadrant D Data is divided into 100 sec bins |
 |
 |
| Parameter | Plot |
|---|---|
| CZT HV Monitor | 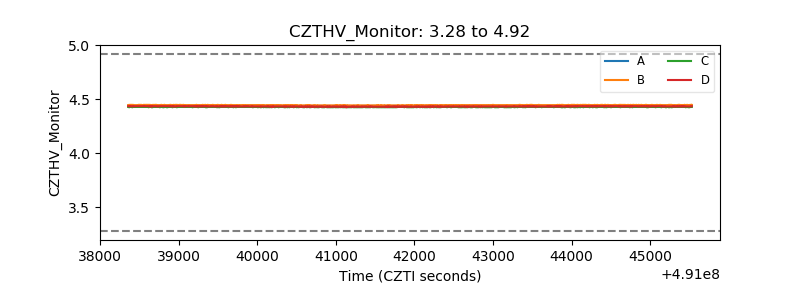 |
| D_VDD | 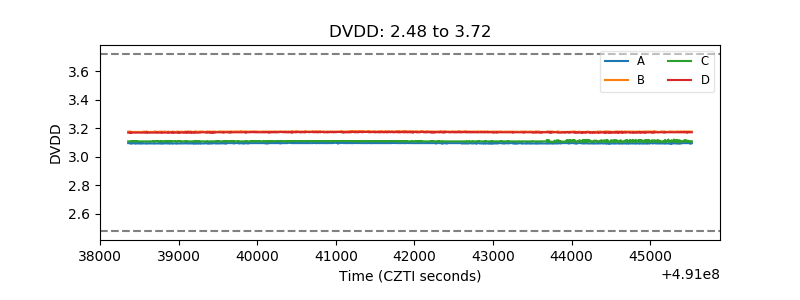 |
| Temperature 1 | 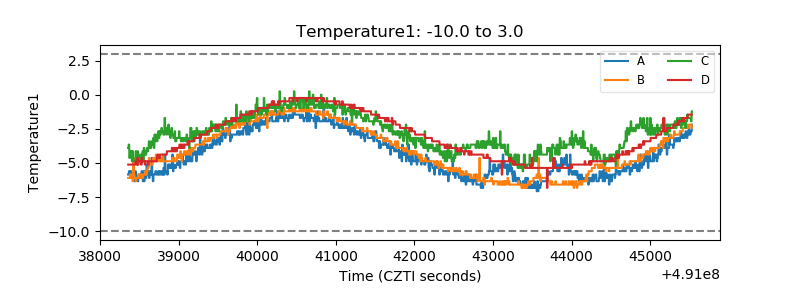 |
| Veto HV Monitor | 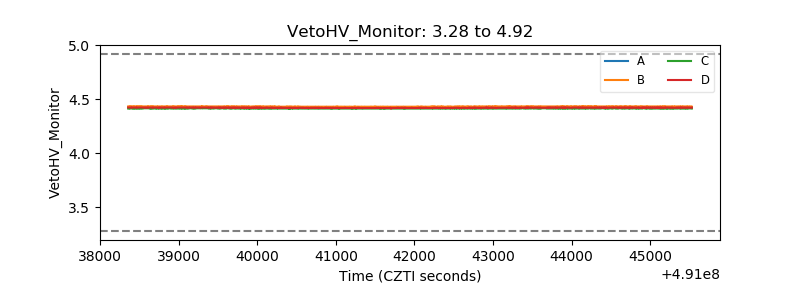 |
| Veto LLD | 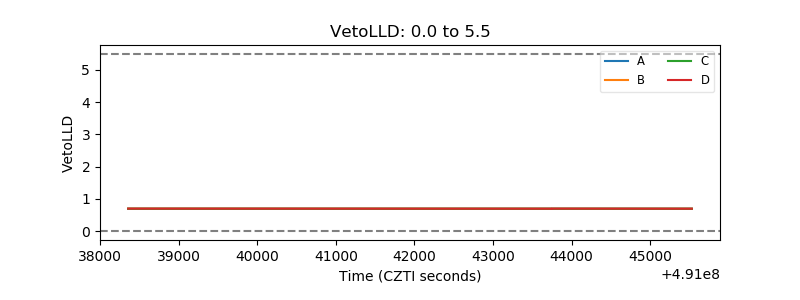 |
| Alpha Counter | 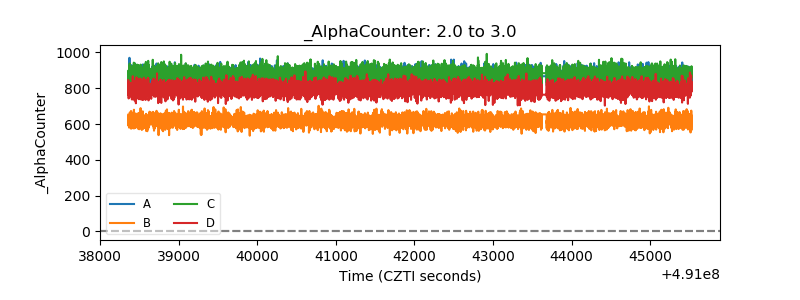 |
| _CPM_Rate | 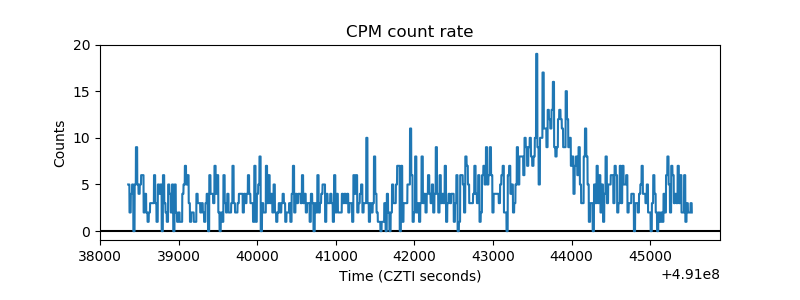 |
| CZT Counter | 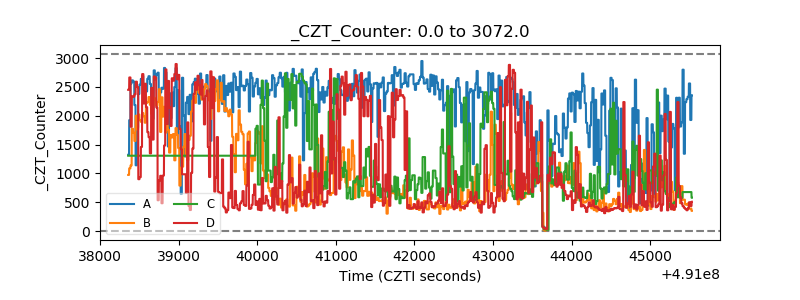 |
| +2.5 Volts monitor |  |
| +5 Volts monitor |  |
| _ROLL_ROT | 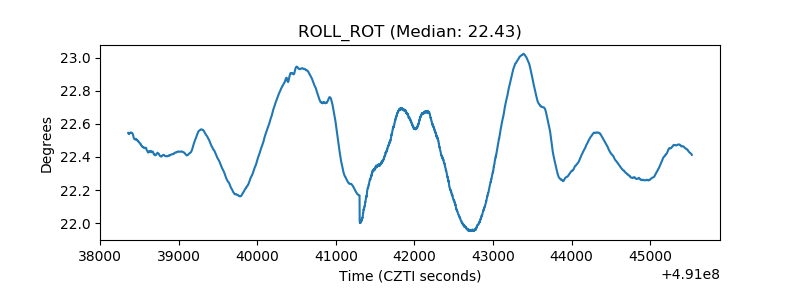 |
| _Roll_DEC | 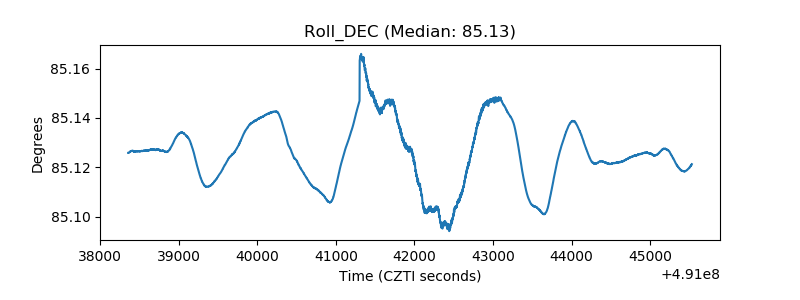 |
| _Roll_RA | 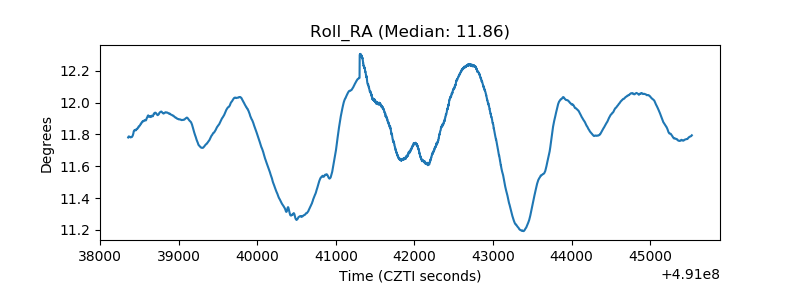 |
| Veto Counter | 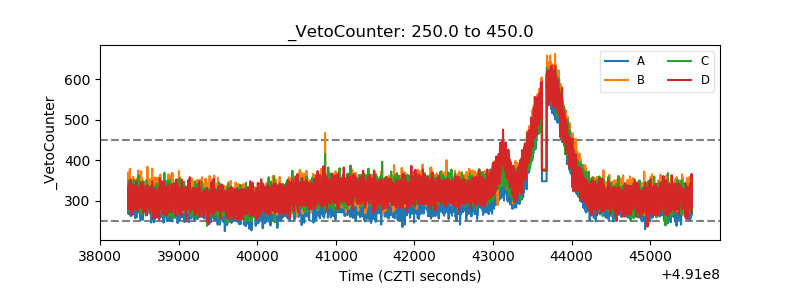 |