| Param | Original file | Final file |
|---|---|---|
| Filename | modeM0/AS1C09_011T07_9000006488_53126cztM0_level2.fits | modeM0/AS1C09_011T07_9000006488_53126cztM0_level2_quad_clean.evt |
| Size (bytes) | 1,086,353,280 | 80,487,360 |
| Size | 1.0 GB | 76.8 MB |
| Events in quadrant A | 17,197,571 | 99,821 |
| Events in quadrant B | 5,749,792 | 734,749 |
| Events in quadrant C | 9,488,981 | 583,923 |
| Events in quadrant D | 7,201,677 | 499,560 |
| Mode SS | |||
|---|---|---|---|
| Quadrant | BADHDUFLAG | Total packets | Discarded packets |
| A | 0 | 150 | 0 |
| B | 0 | 150 | 0 |
| C | 0 | 150 | 0 |
| D | 0 | 150 | 0 |
| Mode M0 | |||
|---|---|---|---|
| Quadrant | BADHDUFLAG | Total packets | Discarded packets |
| A | 0 | 56104 | 19 |
| B | 0 | 22217 | 9 |
| C | 0 | 33471 | 16 |
| D | 0 | 26671 | 1 |
| Quadrant | Total seconds | Saturated seconds | Saturation percentage |
|---|---|---|---|
| A | 7447 | 6547 | 87.914596% |
| B | 7448 | 243 | 3.262621% |
| C | 7449 | 1126 | 15.116123% |
| D | 7450 | 1669 | 22.402685% |
Noise dominated data is calculated using 1-second bins in cleaned event files. If a bin has >2000 counts, and if more than 50% of those come from <1% of pixels, then it is considered to be noise-dominated and hence unusable.
| Quadrant | # 1 sec bins | Bins with >0 counts | Bins with >2000 counts | High rate bins dominated by noise | Noise dominated (total time) | Noise dominated (detector-on time) | Marked lightcurve |
|---|---|---|---|---|---|---|---|
| A | 7450 | 7450 | 6248 | 6248 | 83.87% | 83.87% | 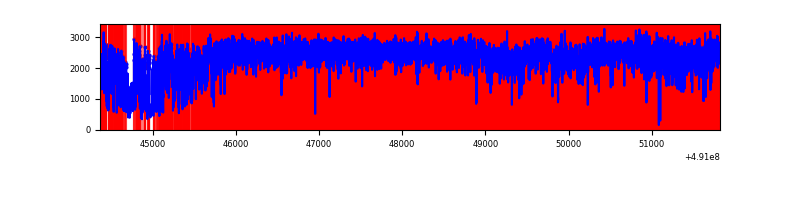 |
| B | 7451 | 7450 | 246 | 246 | 3.30% | 3.30% | 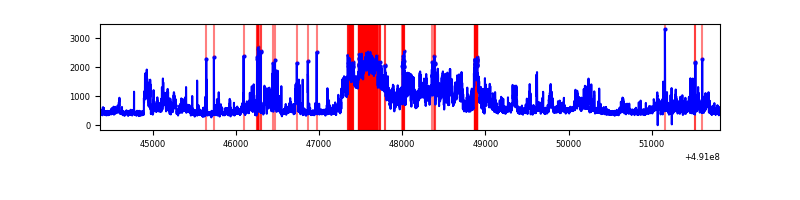 |
| C | 7451 | 7451 | 1216 | 1216 | 16.32% | 16.32% | 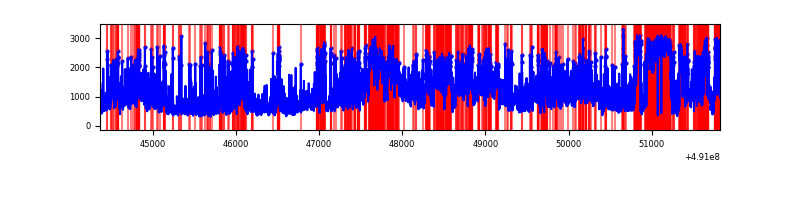 |
| D | 7451 | 7451 | 1110 | 1110 | 14.90% | 14.90% | 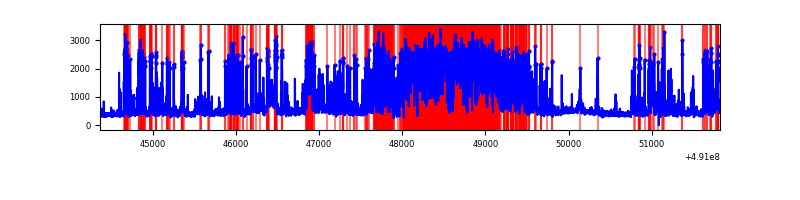 |
Top three noisy pixels from each quadrant. If the there are fewer than three noisy pixels in the level2.evt file, extra rows are filled as -1
| Pixel properties | Quadrant properties | ||||||
|---|---|---|---|---|---|---|---|
| Quadrant | DetID | PixID | Counts | Sigma | Mean | Median | Sigma |
| A | 9 | 191 | 15204693 | 160452.46 | 373 | 363 | 94.8 |
| A | 3 | 62 | 184773 | 1946.09 | 373 | 363 | 94.8 |
| A | 15 | 174 | 151438 | 1594.31 | 373 | 363 | 94.8 |
| B | 10 | 254 | 2402782 | 14819.9 | 752 | 726 | 162.1 |
| B | 5 | 185 | 69294 | 423.04 | 752 | 726 | 162.1 |
| B | 0 | 213 | 54963 | 334.62 | 752 | 726 | 162.1 |
| C | 10 | 22 | 2659109 | 13945.71 | 693 | 686 | 190.6 |
| C | 15 | 224 | 1354729 | 7103.12 | 693 | 686 | 190.6 |
| C | 1 | 241 | 1213444 | 6361.96 | 693 | 686 | 190.6 |
| D | 12 | 3 | 3389743 | 18581.41 | 637 | 607 | 182.4 |
| D | 3 | 224 | 395943 | 2167.48 | 637 | 607 | 182.4 |
| D | 2 | 249 | 143082 | 781.14 | 637 | 607 | 182.4 |
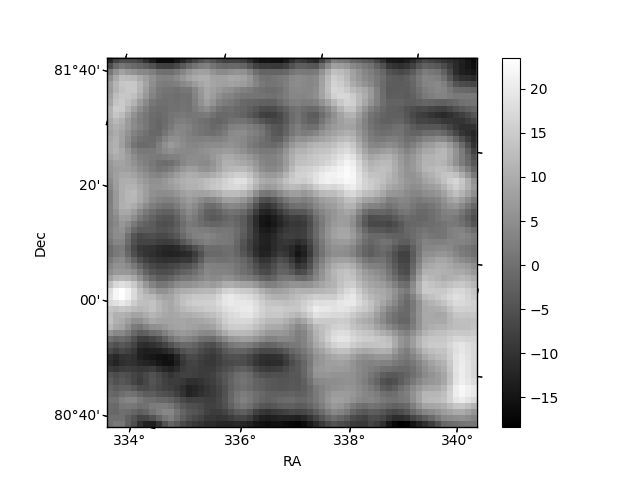
Histogram calculated using DETX and DETY for each event in the final _common_clean file
| Quadrant A | 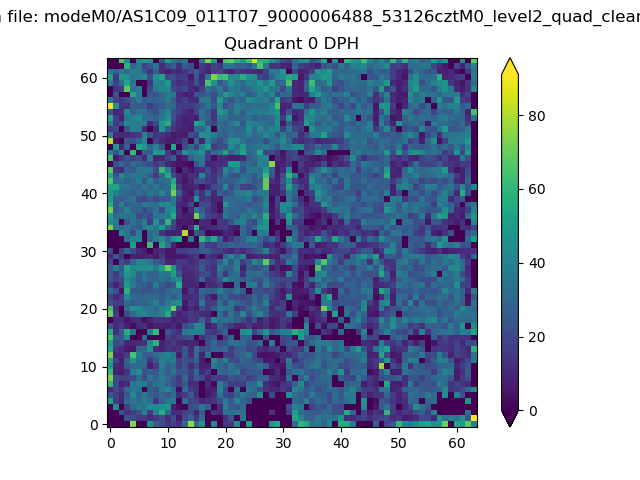 |
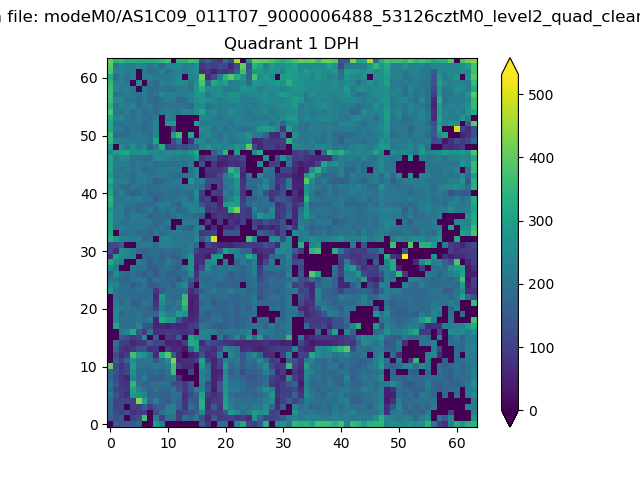 |
Quadrant B |
|---|---|---|---|
| Quadrant D | 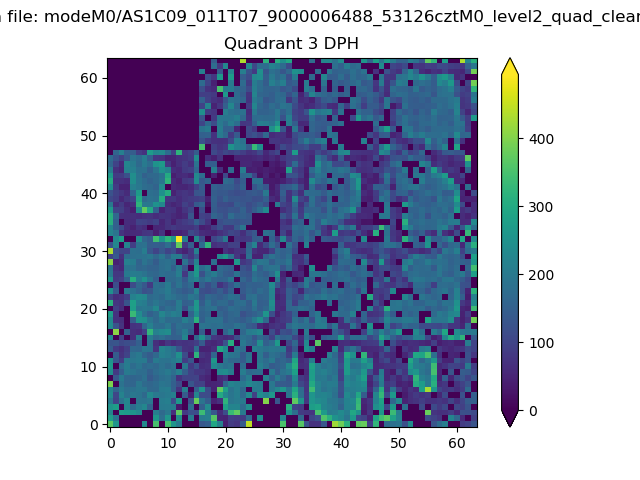 |
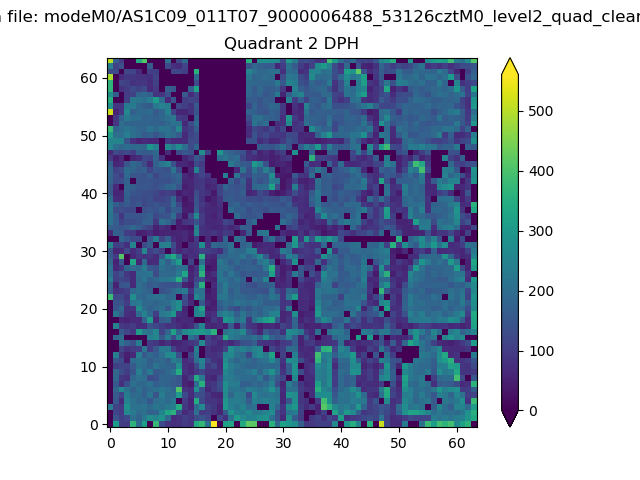 |
Quadrant C |
| Plot type | Count rate plots | Images |
|---|---|---|
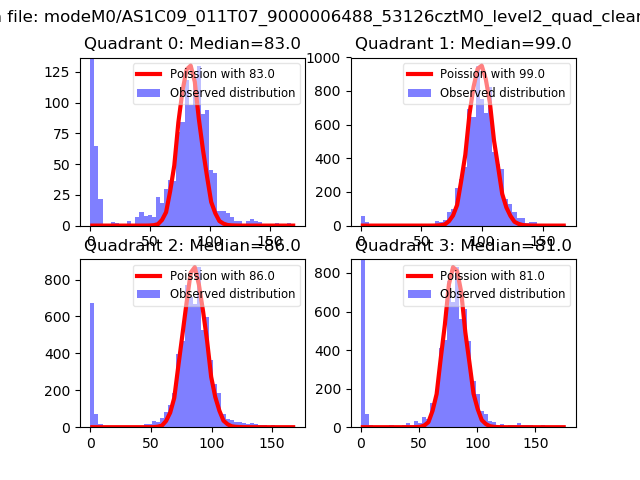
| Comparison with Poisson distribution Blue bars denote a histogram of data divided into 1 sec bins. Red curve is a Poisson curve with rate = median count rate of data. |
 |
 |
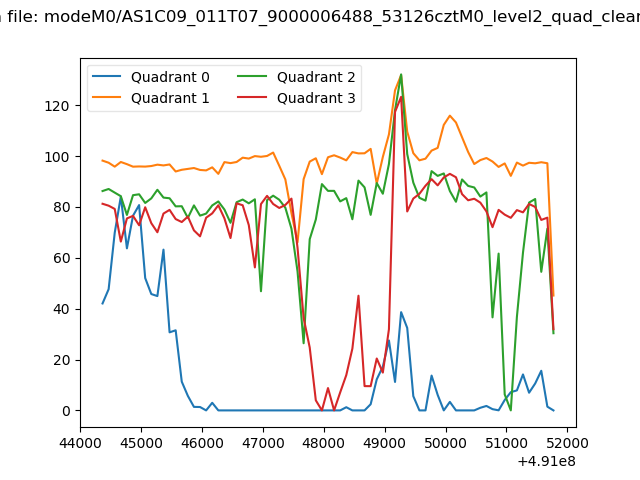
| Quadrant-wise count rates Data is divided into 100 sec bins |
 |
|
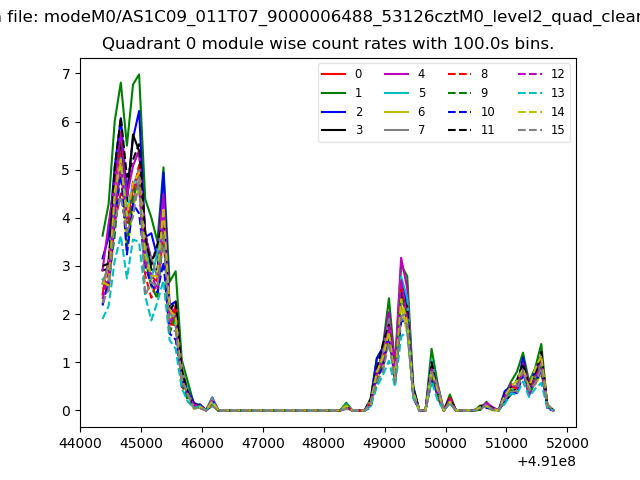
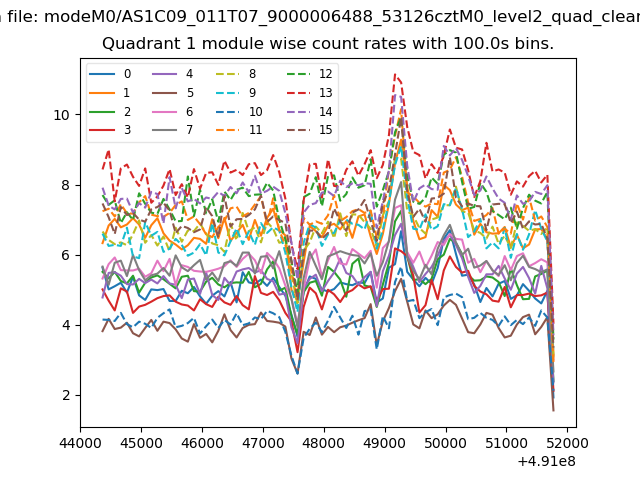
| Module-wise count rates for Quadrant A Data is divided into 100 sec bins |
 |
 |
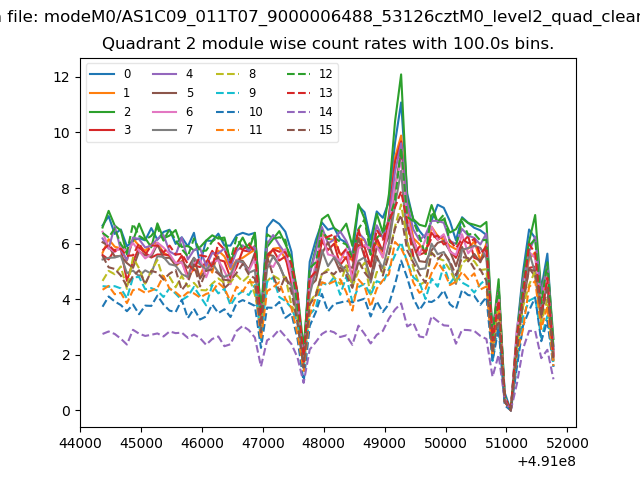
| Module-wise count rates for Quadrant B Data is divided into 100 sec bins |
 |
 |
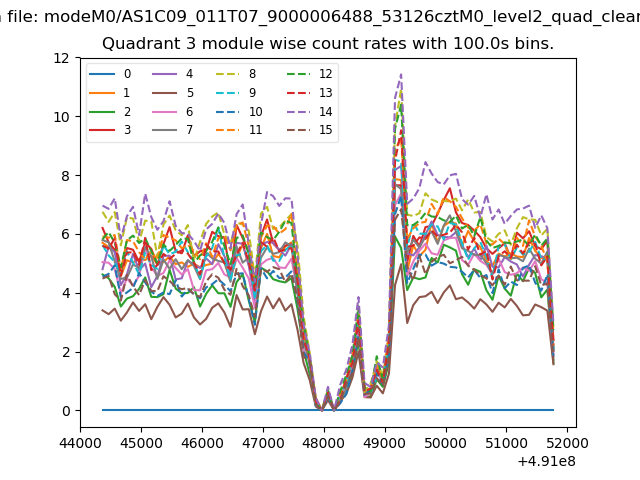
| Module-wise count rates for Quadrant C Data is divided into 100 sec bins |
 |
 |
| Module-wise count rates for Quadrant D Data is divided into 100 sec bins |
 |
 |
| Parameter | Plot |
|---|---|
| CZT HV Monitor | 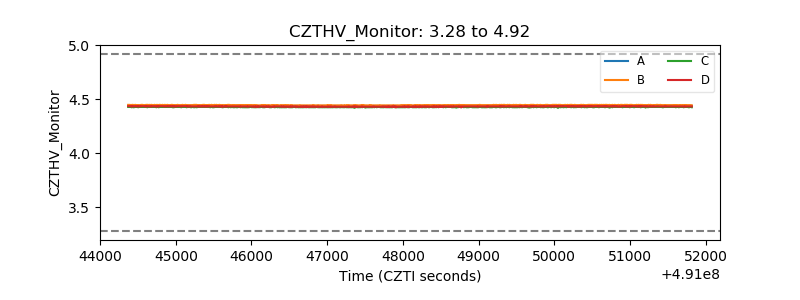 |
| D_VDD | 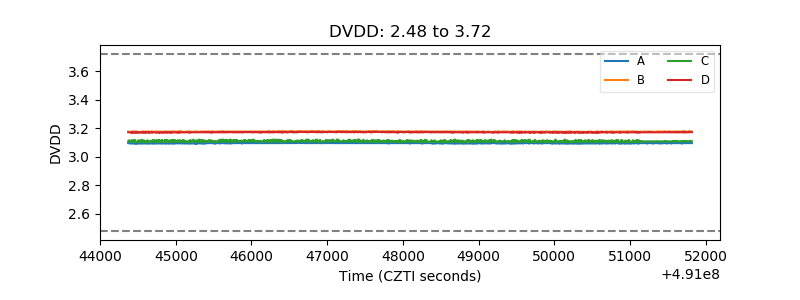 |
| Temperature 1 | 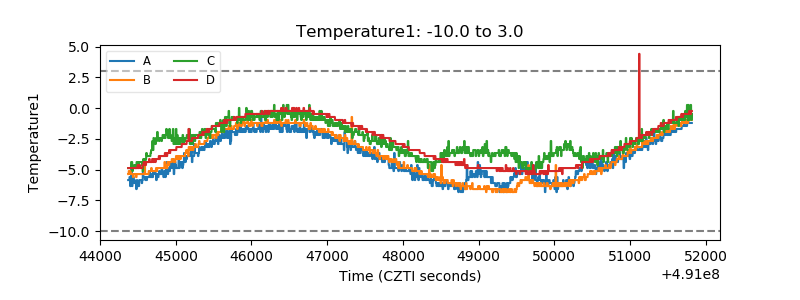 |
| Veto HV Monitor | 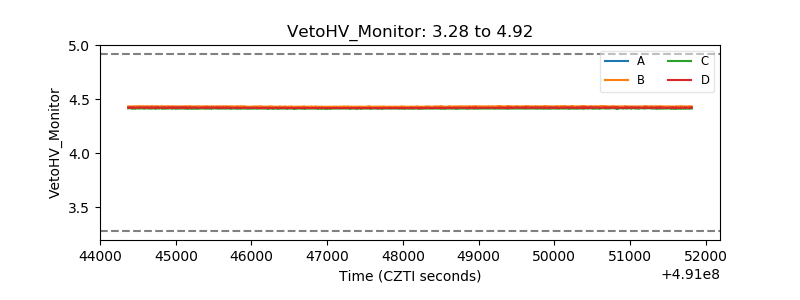 |
| Veto LLD | 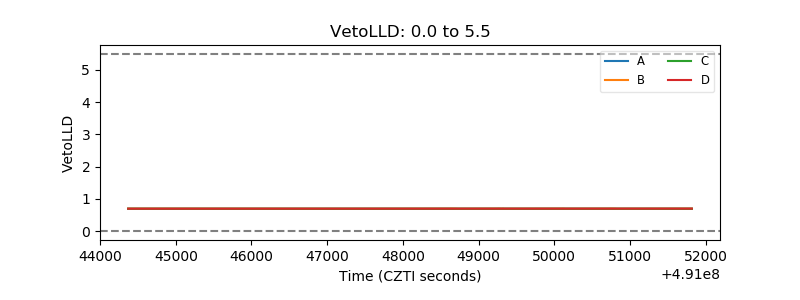 |
| Alpha Counter | 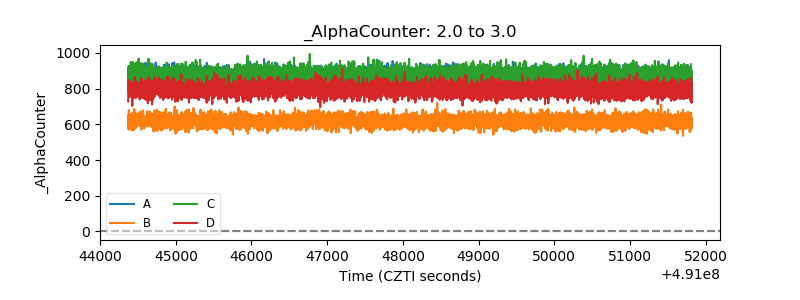 |
| _CPM_Rate | 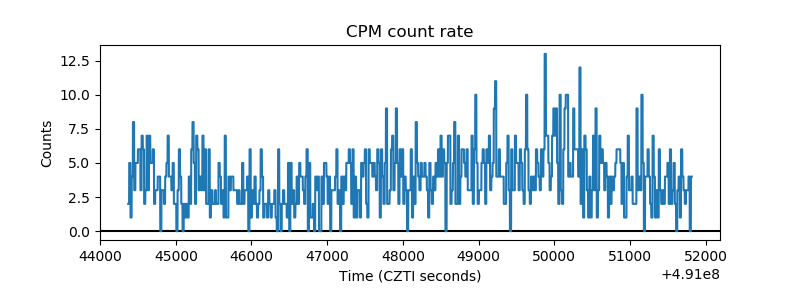 |
| CZT Counter | 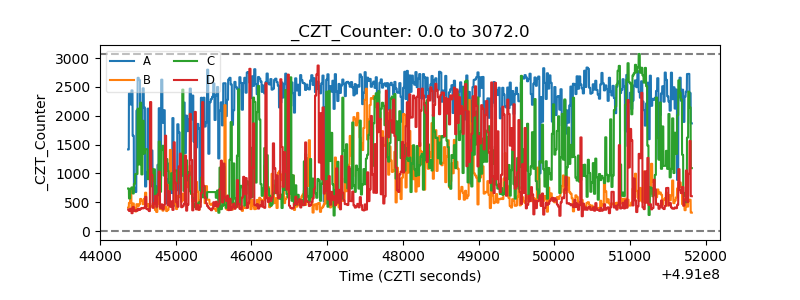 |
| +2.5 Volts monitor |  |
| +5 Volts monitor | 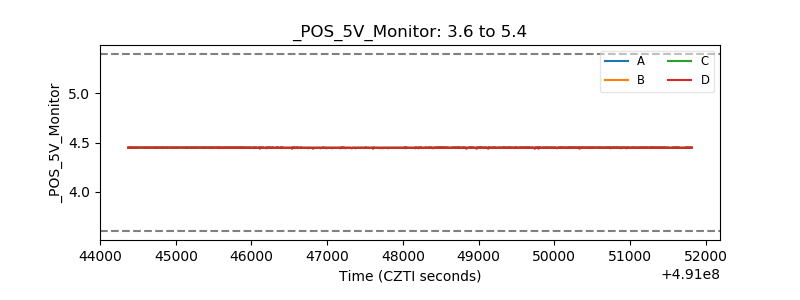 |
| _ROLL_ROT | 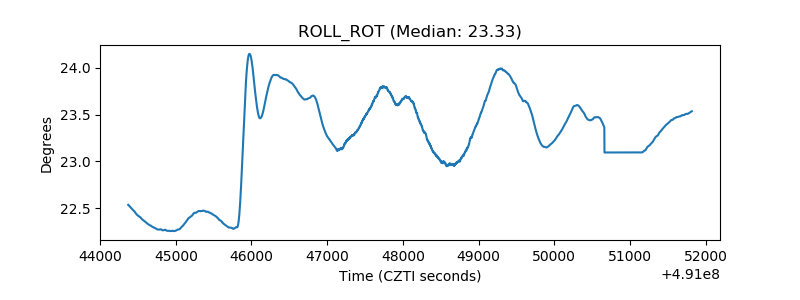 |
| _Roll_DEC |  |
| _Roll_RA | 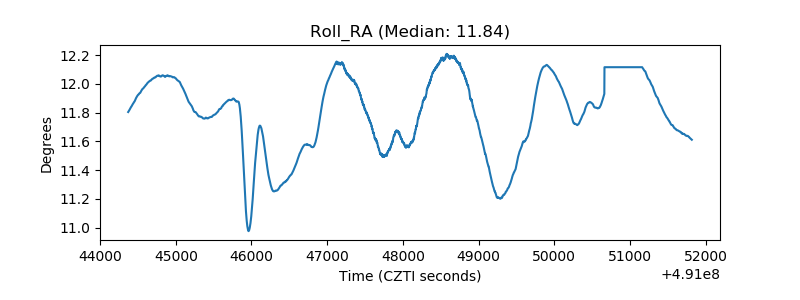 |
| Veto Counter | 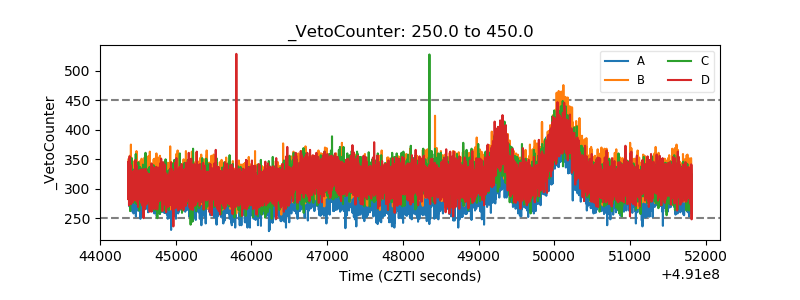 |