| Param | Original file | Final file |
|---|---|---|
| Filename | modeM0/AS1C09_011T07_9000006488_53132cztM0_level2.fits | modeM0/AS1C09_011T07_9000006488_53132cztM0_level2_quad_clean.evt |
| Size (bytes) | 965,059,200 | 74,436,480 |
| Size | 920.4 MB | 71.0 MB |
| Events in quadrant A | 16,990,898 | 628 |
| Events in quadrant B | 7,014,746 | 619,713 |
| Events in quadrant C | 4,950,877 | 628,457 |
| Events in quadrant D | 6,248,333 | 538,068 |
| Mode SS | |||
|---|---|---|---|
| Quadrant | BADHDUFLAG | Total packets | Discarded packets |
| A | 0 | 136 | 0 |
| B | 0 | 136 | 0 |
| C | 0 | 136 | 0 |
| D | 0 | 136 | 0 |
| Mode M9 | |||
|---|---|---|---|
| Quadrant | BADHDUFLAG | Total packets | Discarded packets |
| A | 0 | 11 | 0 |
| B | 0 | 12 | 0 |
| C | 0 | 12 | 0 |
| D | 0 | 12 | 0 |
| Mode M0 | |||
|---|---|---|---|
| Quadrant | BADHDUFLAG | Total packets | Discarded packets |
| A | 0 | 54931 | 4 |
| B | 0 | 25442 | 2 |
| C | 0 | 19507 | 2 |
| D | 0 | 23374 | 2 |
| Quadrant | Total seconds | Saturated seconds | Saturation percentage |
|---|---|---|---|
| A | 6695 | 6690 | 99.925317% |
| B | 6695 | 1161 | 17.341299% |
| C | 6695 | 349 | 5.212845% |
| D | 6695 | 1111 | 16.594473% |
Noise dominated data is calculated using 1-second bins in cleaned event files. If a bin has >2000 counts, and if more than 50% of those come from <1% of pixels, then it is considered to be noise-dominated and hence unusable.
| Quadrant | # 1 sec bins | Bins with >0 counts | Bins with >2000 counts | High rate bins dominated by noise | Noise dominated (total time) | Noise dominated (detector-on time) | Marked lightcurve |
|---|---|---|---|---|---|---|---|
| A | 7705 | 6696 | 6142 | 6142 | 79.71% | 91.73% | 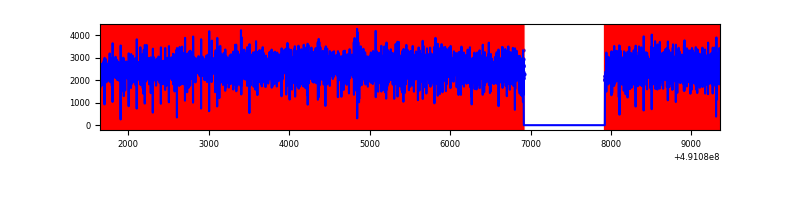 |
| B | 7705 | 6696 | 844 | 844 | 10.95% | 12.60% | 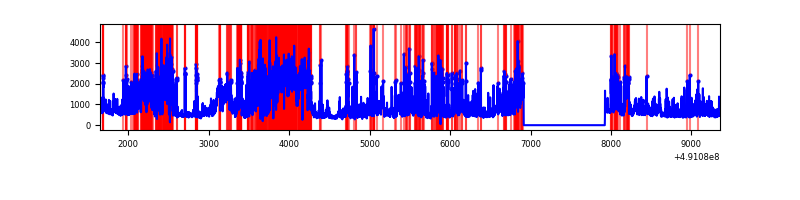 |
| C | 7705 | 6696 | 273 | 273 | 3.54% | 4.08% | 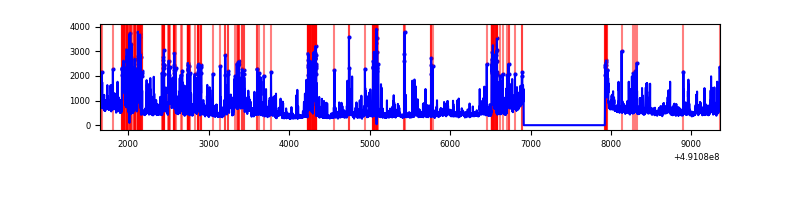 |
| D | 7705 | 6696 | 858 | 858 | 11.14% | 12.81% | 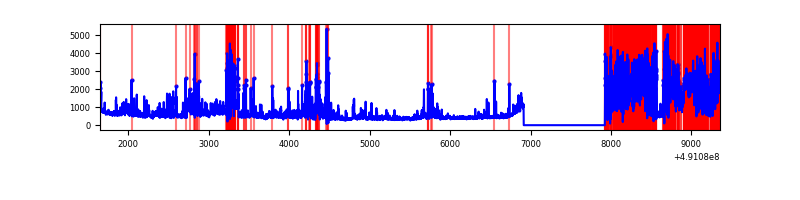 |
Top three noisy pixels from each quadrant. If the there are fewer than three noisy pixels in the level2.evt file, extra rows are filled as -1
| Pixel properties | Quadrant properties | ||||||
|---|---|---|---|---|---|---|---|
| Quadrant | DetID | PixID | Counts | Sigma | Mean | Median | Sigma |
| A | 9 | 191 | 16239778 | 379361.61 | 161 | 157 | 42.8 |
| A | 15 | 174 | 27207 | 631.89 | 161 | 157 | 42.8 |
| A | 0 | 8 | 22928 | 531.94 | 161 | 157 | 42.8 |
| B | 10 | 254 | 2022469 | 14269.34 | 669 | 649 | 141.7 |
| B | 2 | 249 | 1939640 | 13684.76 | 669 | 649 | 141.7 |
| B | 4 | 171 | 113962 | 799.73 | 669 | 649 | 141.7 |
| C | 15 | 224 | 756688 | 3943.85 | 689 | 682 | 191.7 |
| C | 9 | 38 | 368989 | 1921.35 | 689 | 682 | 191.7 |
| C | 0 | 240 | 236117 | 1228.19 | 689 | 682 | 191.7 |
| D | 8 | 176 | 2553431 | 13794.61 | 636 | 608 | 185.1 |
| D | 10 | 172 | 483670 | 2610.31 | 636 | 608 | 185.1 |
| D | 1 | 0 | 135844 | 730.77 | 636 | 608 | 185.1 |
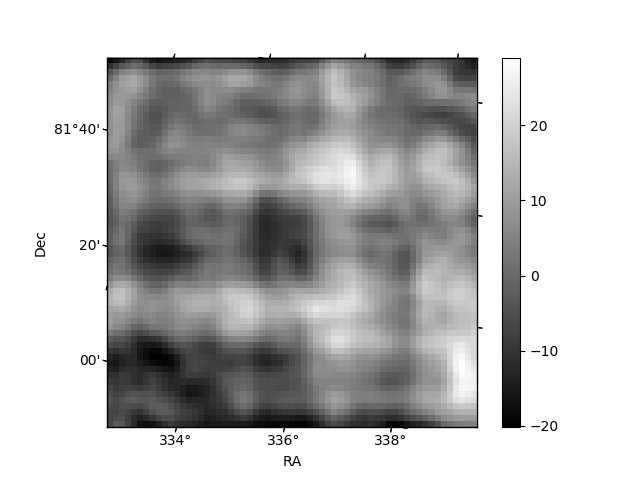
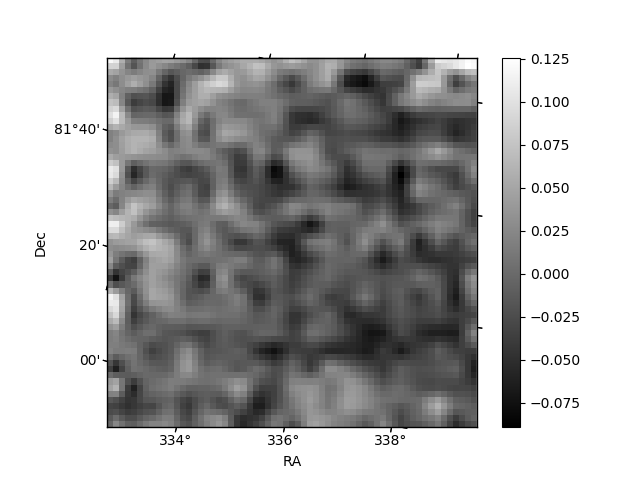
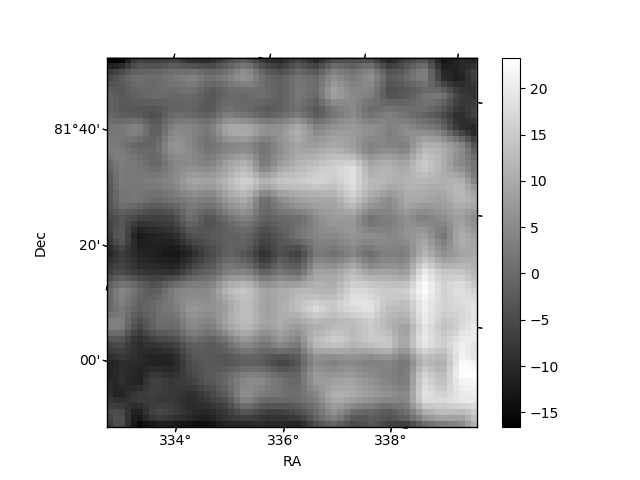
Histogram calculated using DETX and DETY for each event in the final _common_clean file
| Quadrant A | 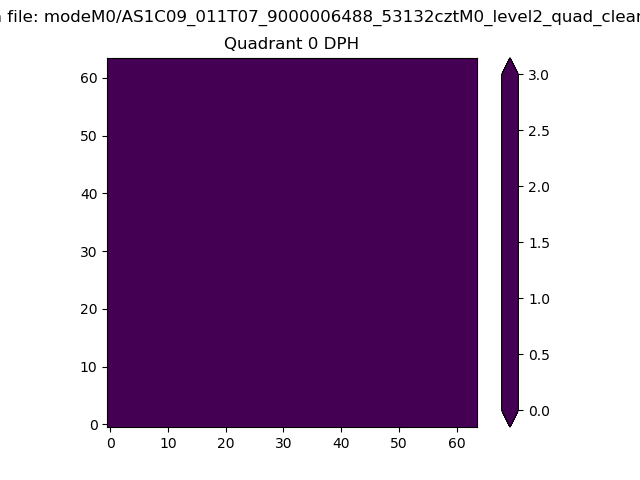 |
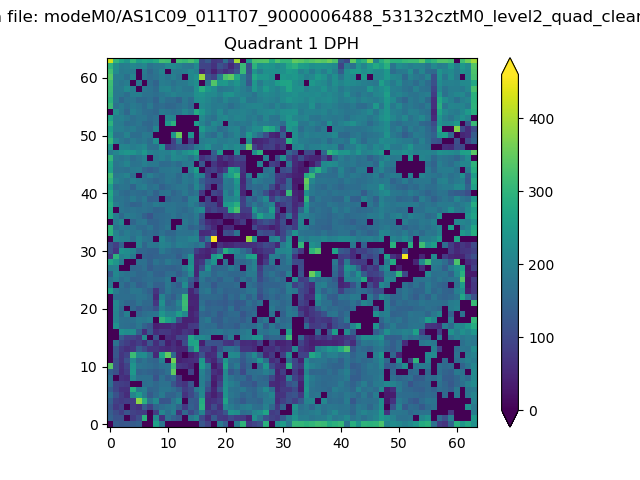 |
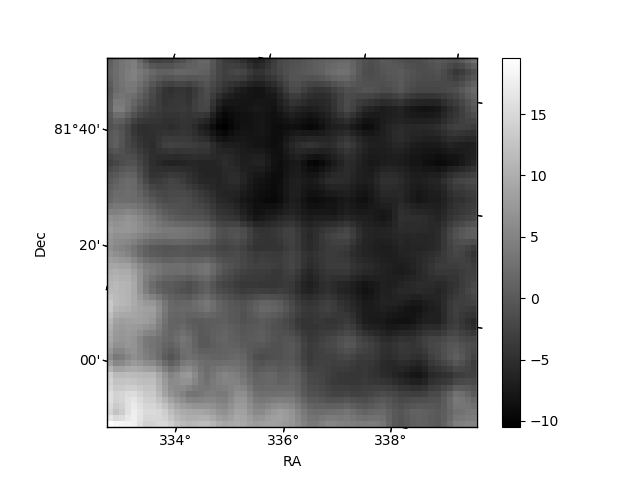
Quadrant B |
|---|---|---|---|
| Quadrant D | 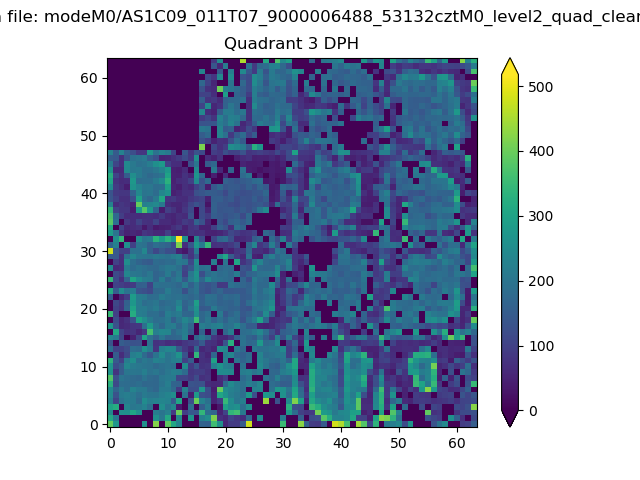 |
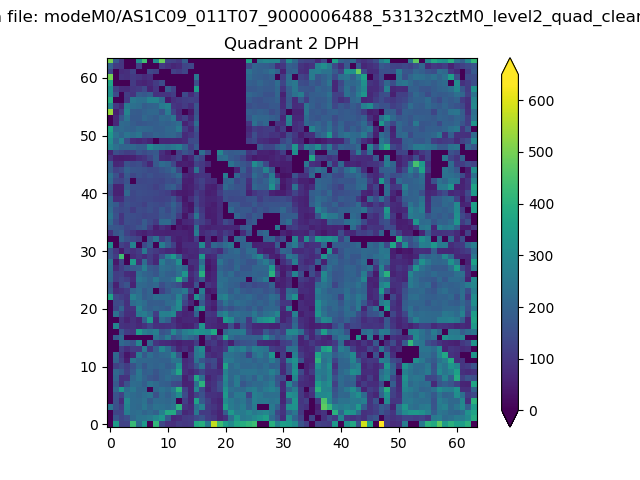 |
Quadrant C |
| Plot type | Count rate plots | Images |
|---|---|---|
| Comparison with Poisson distribution Blue bars denote a histogram of data divided into 1 sec bins. Red curve is a Poisson curve with rate = median count rate of data. |
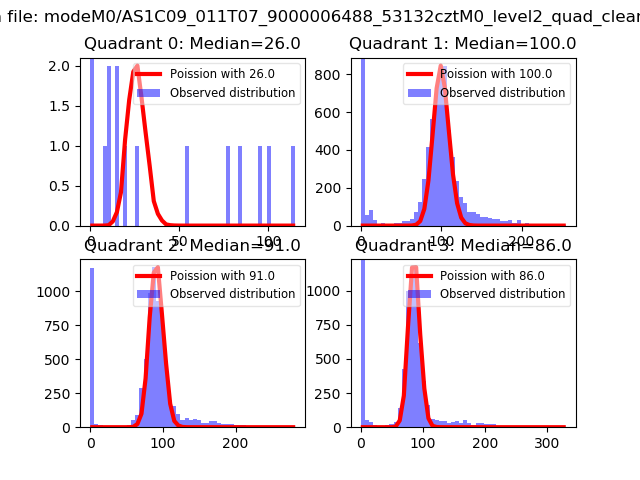 |
 |
| Quadrant-wise count rates Data is divided into 100 sec bins |
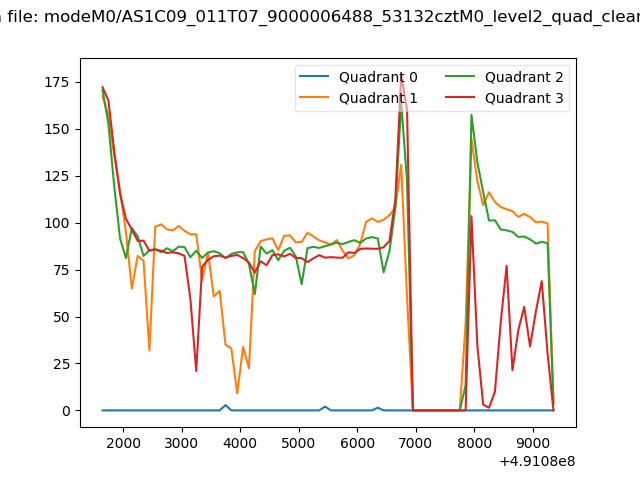 |
|
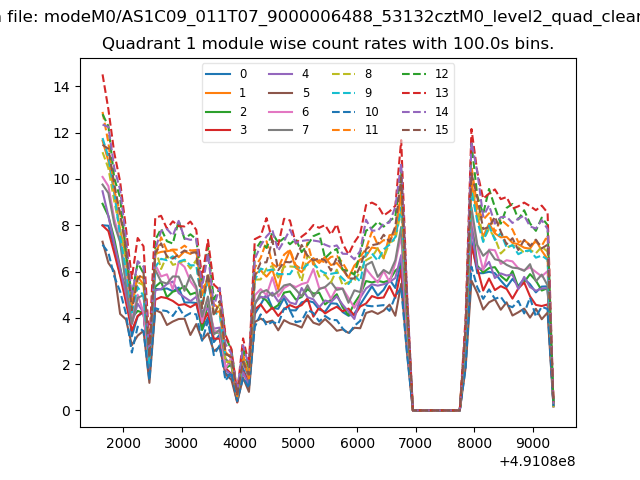
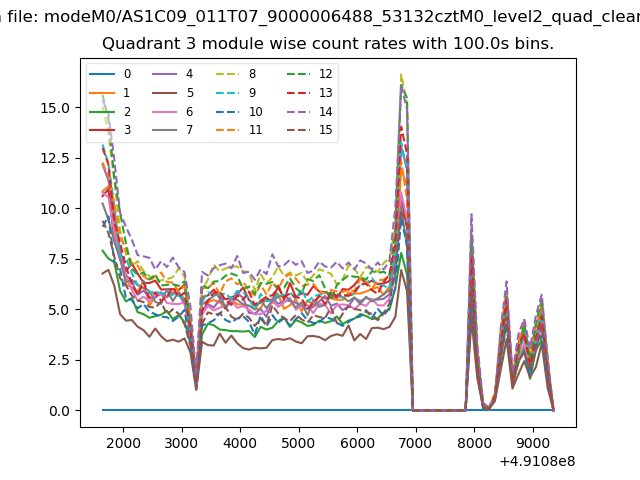
| Module-wise count rates for Quadrant A Data is divided into 100 sec bins |
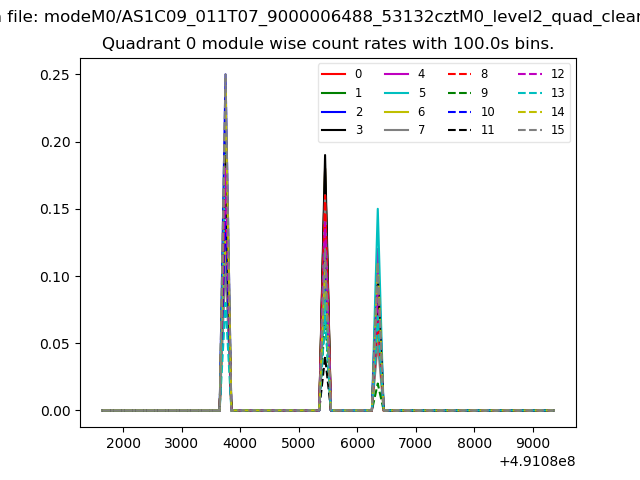 |
 |
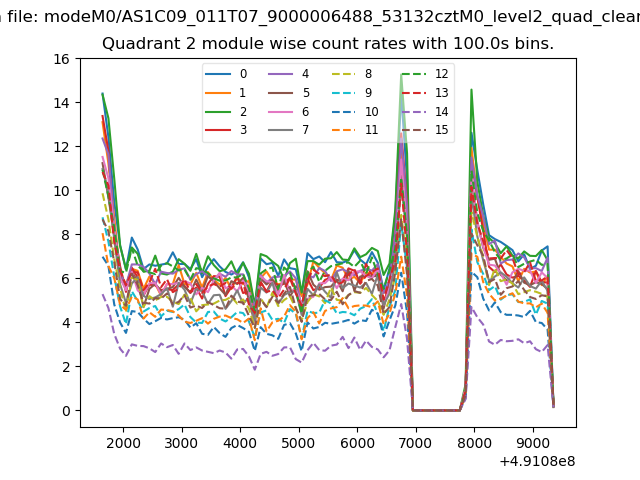
| Module-wise count rates for Quadrant B Data is divided into 100 sec bins |
 |
 |
| Module-wise count rates for Quadrant C Data is divided into 100 sec bins |
 |
 |
| Module-wise count rates for Quadrant D Data is divided into 100 sec bins |
 |
 |
| Parameter | Plot |
|---|---|
| CZT HV Monitor |  |
| D_VDD | 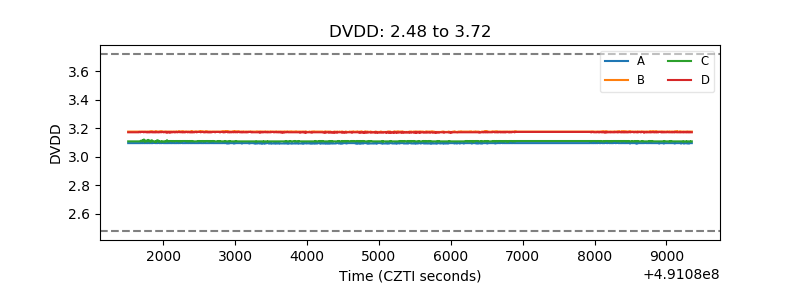 |
| Temperature 1 | 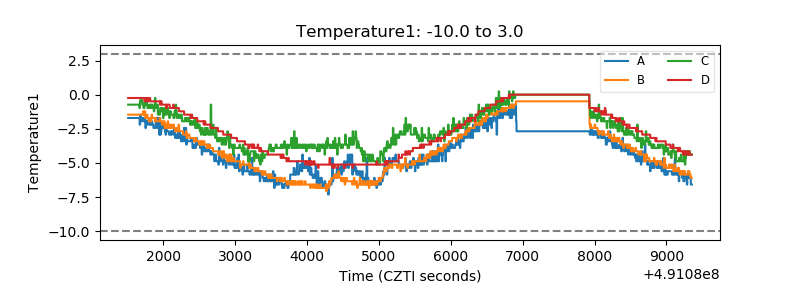 |
| Veto HV Monitor | 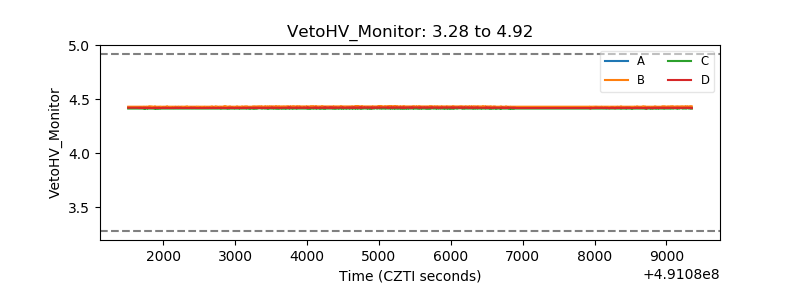 |
| Veto LLD | 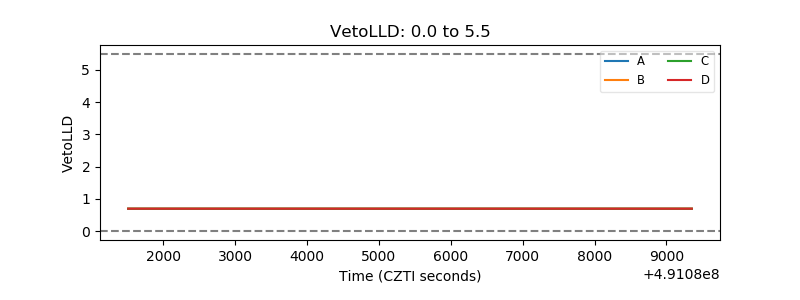 |
| Alpha Counter | 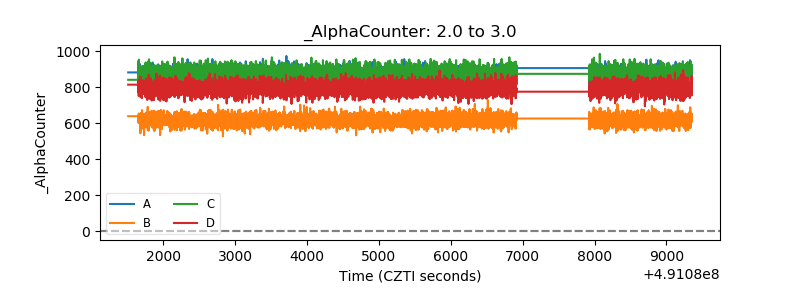 |
| _CPM_Rate | 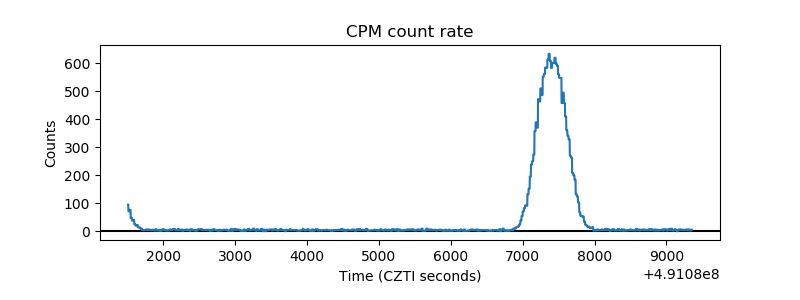 |
| CZT Counter | 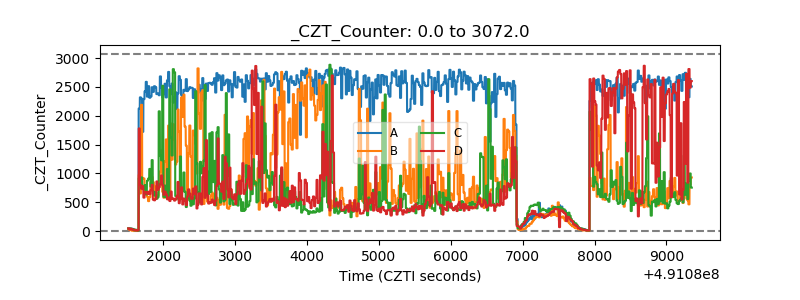 |
| +2.5 Volts monitor | 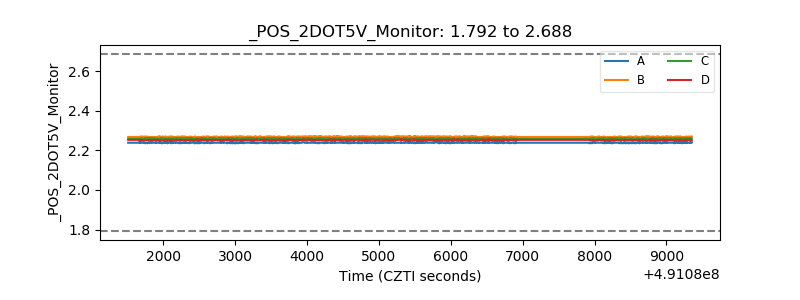 |
| +5 Volts monitor |  |
| _ROLL_ROT | 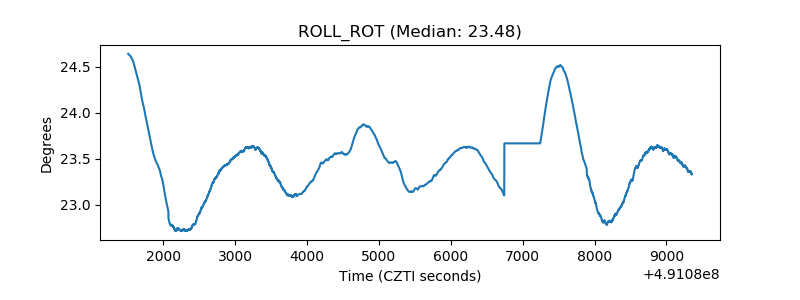 |
| _Roll_DEC | 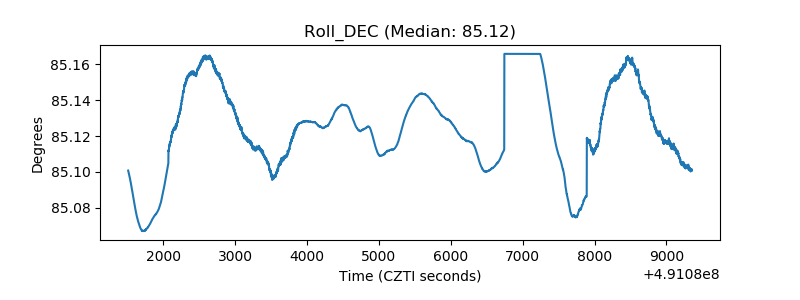 |
| _Roll_RA | 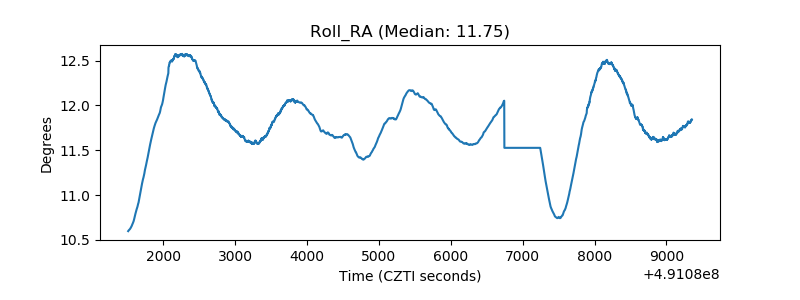 |
| Veto Counter | 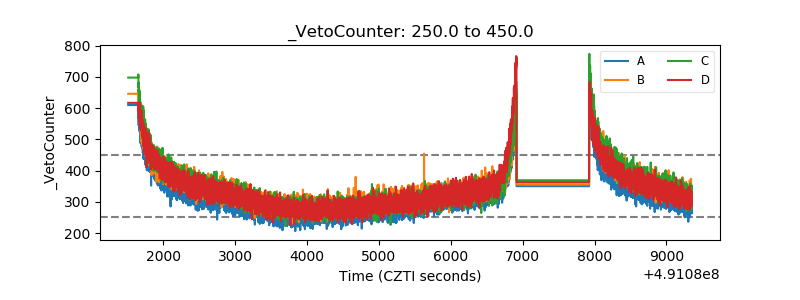 |