| Param | Original file | Final file |
|---|---|---|
| Filename | modeM0/AS1C09_011T07_9000006488_53135cztM0_level2.fits | modeM0/AS1C09_011T07_9000006488_53135cztM0_level2_quad_clean.evt |
| Size (bytes) | 934,764,480 | 72,002,880 |
| Size | 891.5 MB | 68.7 MB |
| Events in quadrant A | 16,551,386 | 918 |
| Events in quadrant B | 3,931,725 | 685,063 |
| Events in quadrant C | 8,076,466 | 487,660 |
| Events in quadrant D | 5,536,981 | 550,940 |
| Mode SS | |||
|---|---|---|---|
| Quadrant | BADHDUFLAG | Total packets | Discarded packets |
| A | 0 | 134 | 0 |
| B | 0 | 134 | 0 |
| C | 0 | 134 | 0 |
| D | 0 | 134 | 0 |
| Mode M9 | |||
|---|---|---|---|
| Quadrant | BADHDUFLAG | Total packets | Discarded packets |
| A | 0 | 12 | 0 |
| B | 0 | 12 | 0 |
| C | 0 | 12 | 0 |
| D | 0 | 12 | 0 |
| Mode M0 | |||
|---|---|---|---|
| Quadrant | BADHDUFLAG | Total packets | Discarded packets |
| A | 0 | 53483 | 1 |
| B | 0 | 16122 | 1 |
| C | 0 | 28516 | 1 |
| D | 0 | 21148 | 1 |
| Quadrant | Total seconds | Saturated seconds | Saturation percentage |
|---|---|---|---|
| A | 6525 | 6519 | 99.908046% |
| B | 6525 | 98 | 1.501916% |
| C | 6526 | 1576 | 24.149556% |
| D | 6526 | 488 | 7.477781% |
Noise dominated data is calculated using 1-second bins in cleaned event files. If a bin has >2000 counts, and if more than 50% of those come from <1% of pixels, then it is considered to be noise-dominated and hence unusable.
| Quadrant | # 1 sec bins | Bins with >0 counts | Bins with >2000 counts | High rate bins dominated by noise | Noise dominated (total time) | Noise dominated (detector-on time) | Marked lightcurve |
|---|---|---|---|---|---|---|---|
| A | 7725 | 6526 | 5817 | 5817 | 75.30% | 89.14% | 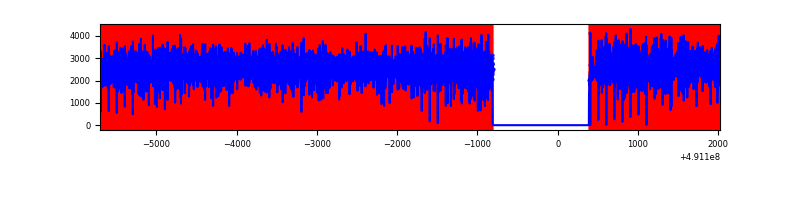 |
| B | 7725 | 6526 | 57 | 57 | 0.74% | 0.87% | 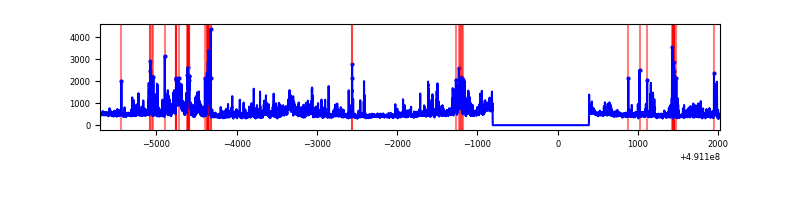 |
| C | 7726 | 6527 | 1443 | 1443 | 18.68% | 22.11% | 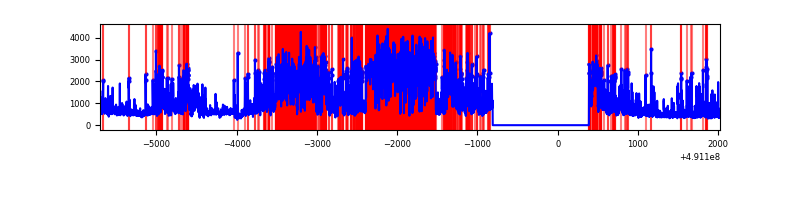 |
| D | 7726 | 6527 | 478 | 478 | 6.19% | 7.32% | 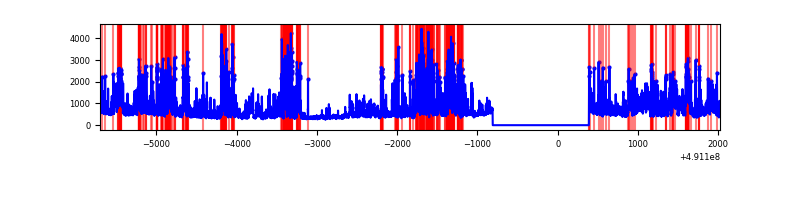 |
Top three noisy pixels from each quadrant. If the there are fewer than three noisy pixels in the level2.evt file, extra rows are filled as -1
| Pixel properties | Quadrant properties | ||||||
|---|---|---|---|---|---|---|---|
| Quadrant | DetID | PixID | Counts | Sigma | Mean | Median | Sigma |
| A | 9 | 191 | 15499684 | 333202.99 | 177 | 172 | 46.5 |
| A | 12 | 115 | 216003 | 4639.86 | 177 | 172 | 46.5 |
| A | 0 | 8 | 54425 | 1166.31 | 177 | 172 | 46.5 |
| B | 10 | 254 | 497163 | 3498.54 | 671 | 650 | 141.9 |
| B | 4 | 81 | 309797 | 2178.31 | 671 | 650 | 141.9 |
| B | 4 | 171 | 136116 | 954.52 | 671 | 650 | 141.9 |
| C | 9 | 38 | 3543531 | 21920.95 | 584 | 578 | 161.6 |
| C | 15 | 224 | 595430 | 3680.47 | 584 | 578 | 161.6 |
| C | 1 | 174 | 427784 | 2643.21 | 584 | 578 | 161.6 |
| D | 8 | 176 | 1452636 | 7869.63 | 635 | 606 | 184.5 |
| D | 9 | 19 | 372873 | 2017.59 | 635 | 606 | 184.5 |
| D | 12 | 3 | 284515 | 1538.71 | 635 | 606 | 184.5 |
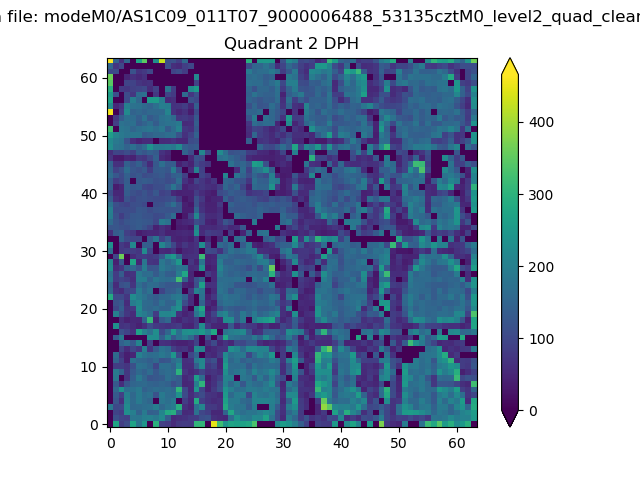
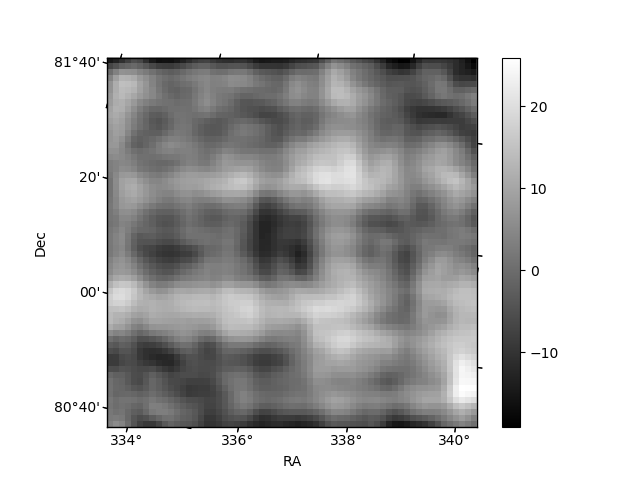
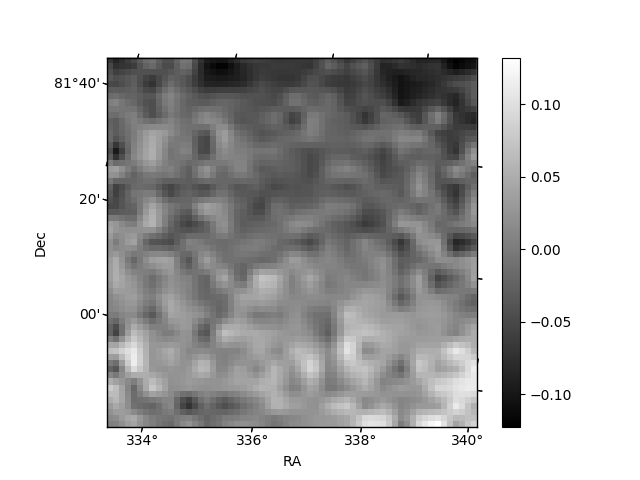
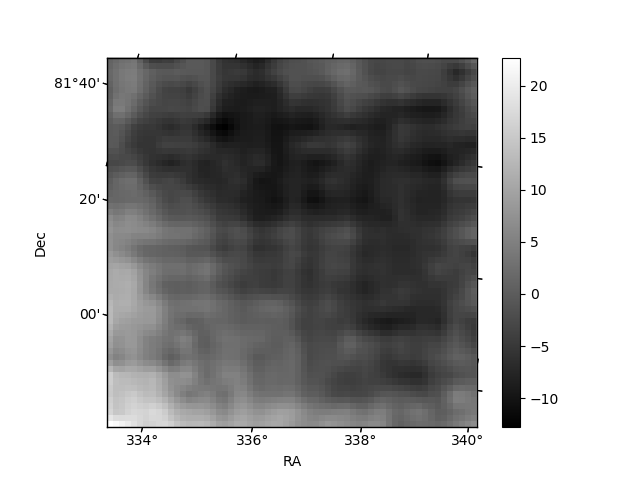
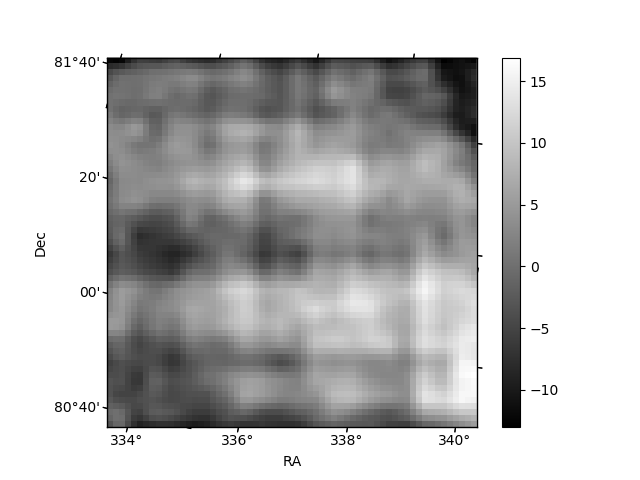
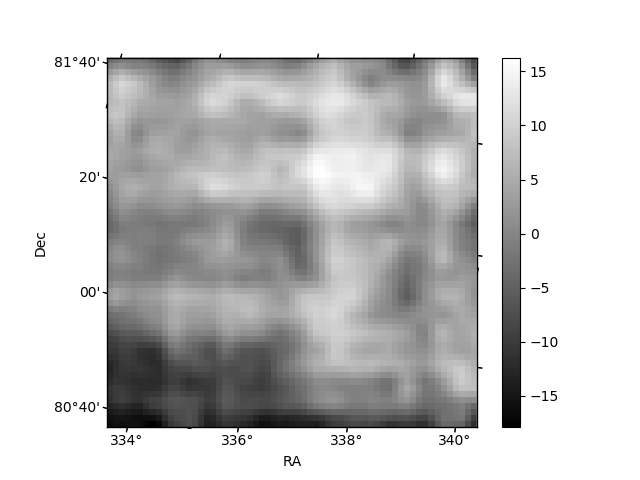
Histogram calculated using DETX and DETY for each event in the final _common_clean file
| Quadrant A | 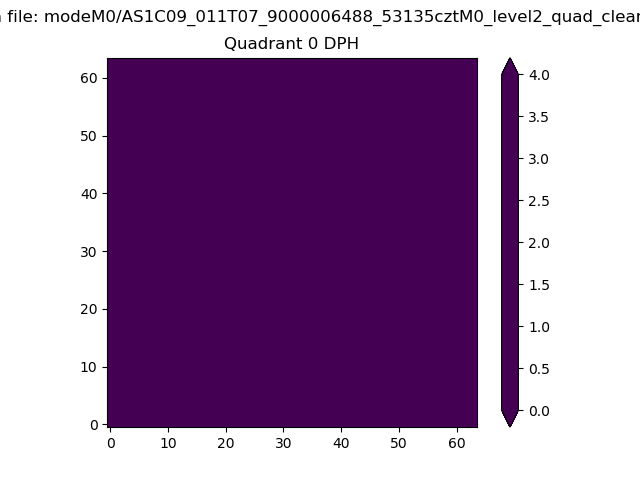 |
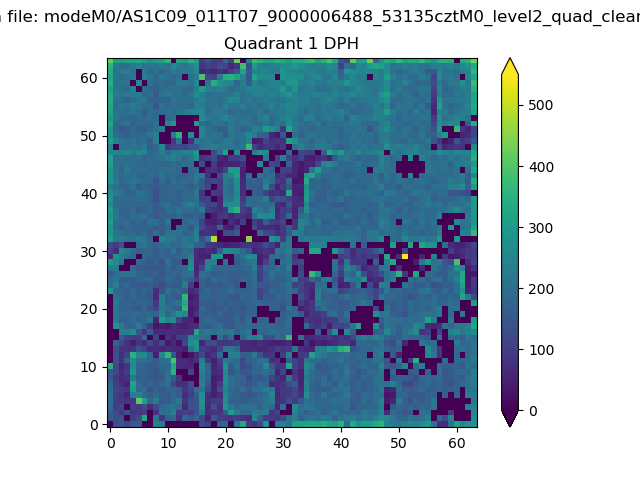 |
Quadrant B |
|---|---|---|---|
| Quadrant D | 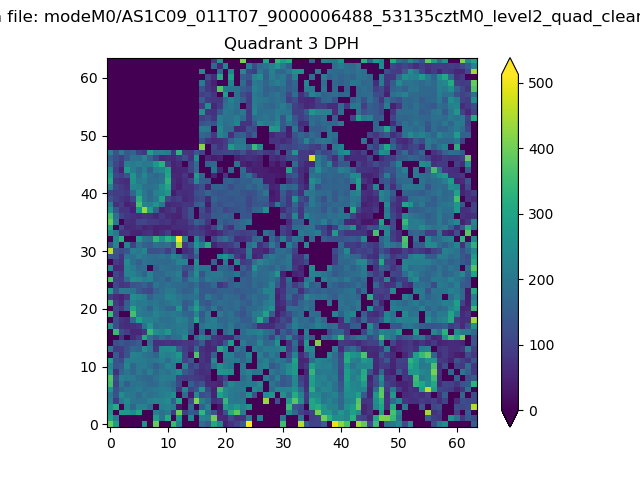 |
 |
Quadrant C |
| Plot type | Count rate plots | Images |
|---|---|---|
| Comparison with Poisson distribution Blue bars denote a histogram of data divided into 1 sec bins. Red curve is a Poisson curve with rate = median count rate of data. |
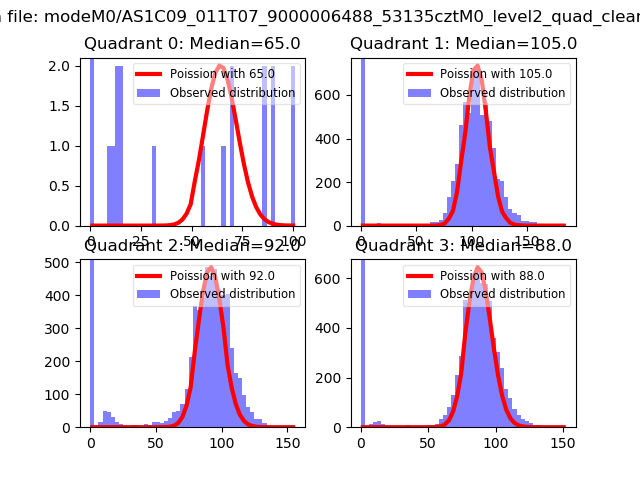 |
 |
| Quadrant-wise count rates Data is divided into 100 sec bins |
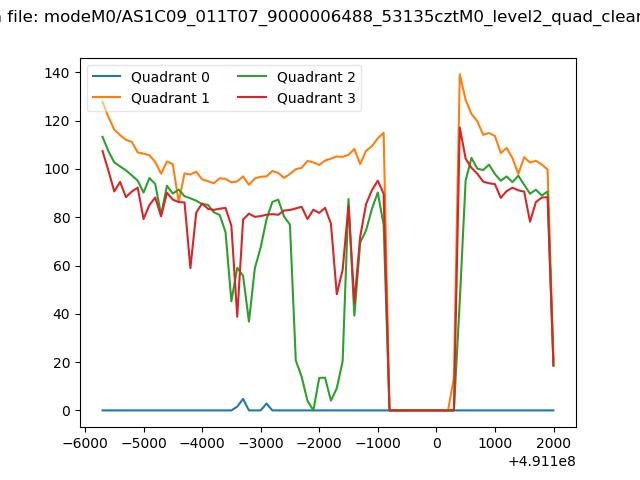 |
|
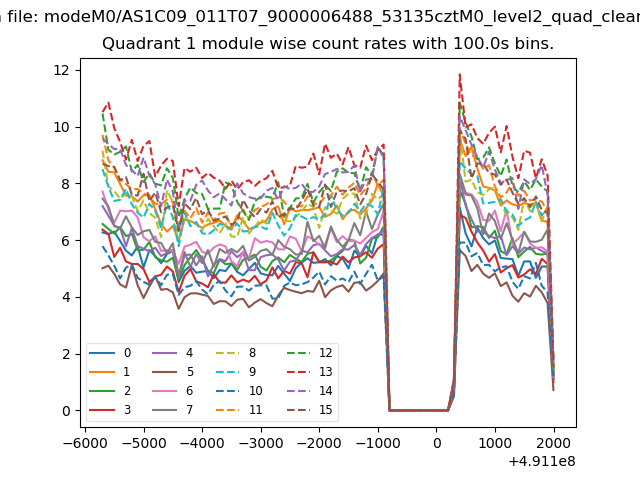
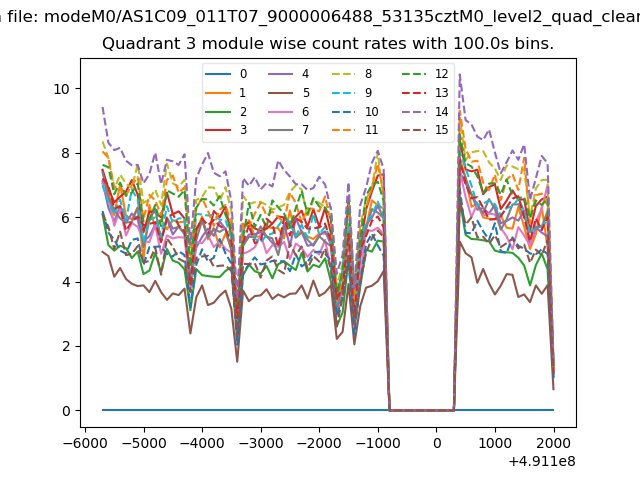
| Module-wise count rates for Quadrant A Data is divided into 100 sec bins |
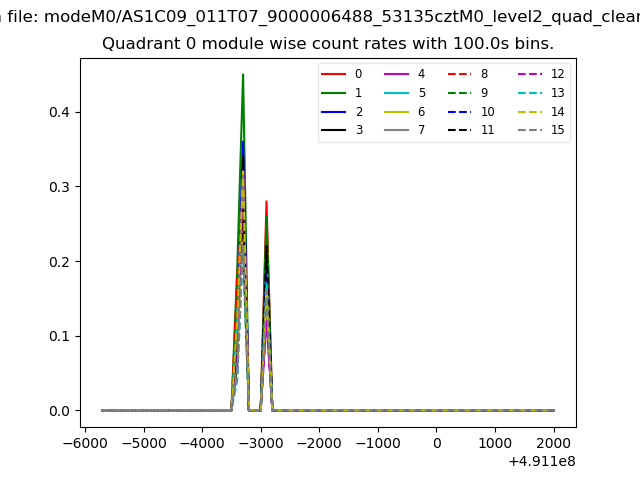 |
 |
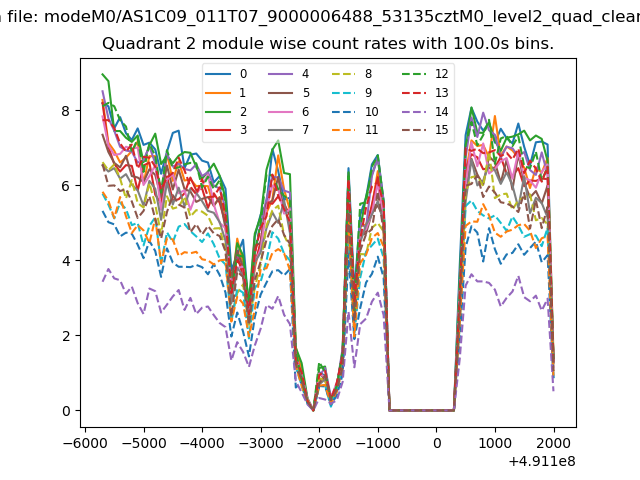
| Module-wise count rates for Quadrant B Data is divided into 100 sec bins |
 |
 |
| Module-wise count rates for Quadrant C Data is divided into 100 sec bins |
 |
 |
| Module-wise count rates for Quadrant D Data is divided into 100 sec bins |
 |
 |
| Parameter | Plot |
|---|---|
| CZT HV Monitor | 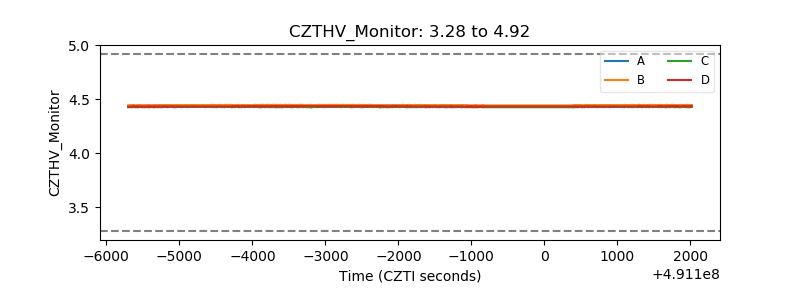 |
| D_VDD | 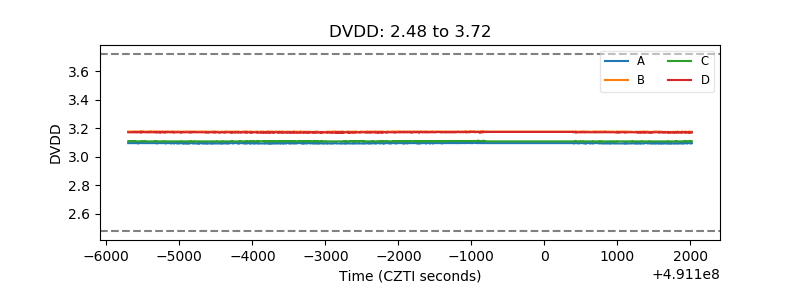 |
| Temperature 1 | 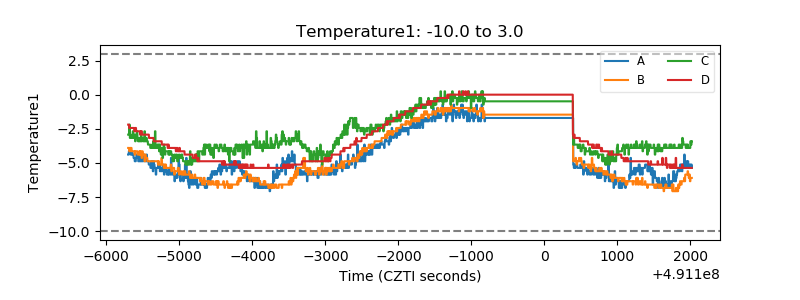 |
| Veto HV Monitor | 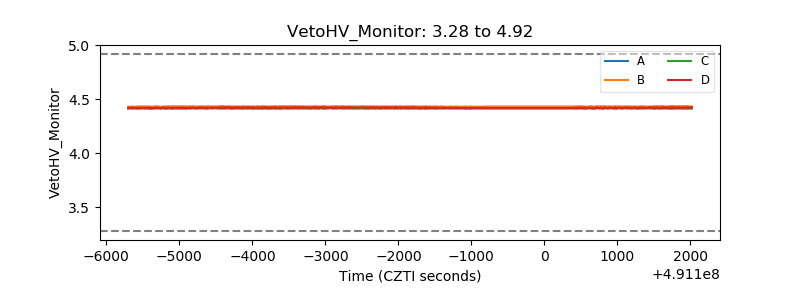 |
| Veto LLD | 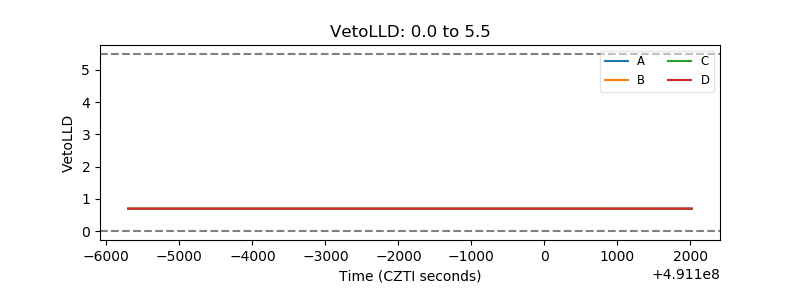 |
| Alpha Counter | 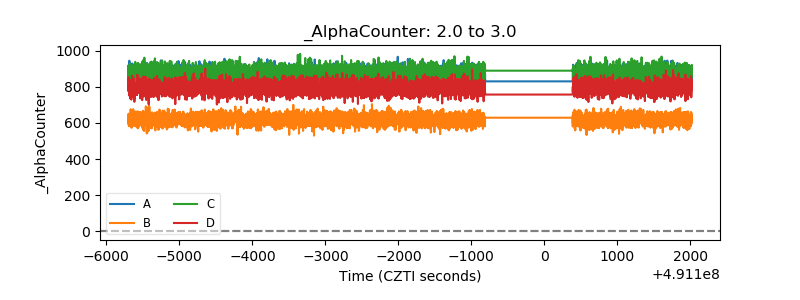 |
| _CPM_Rate | 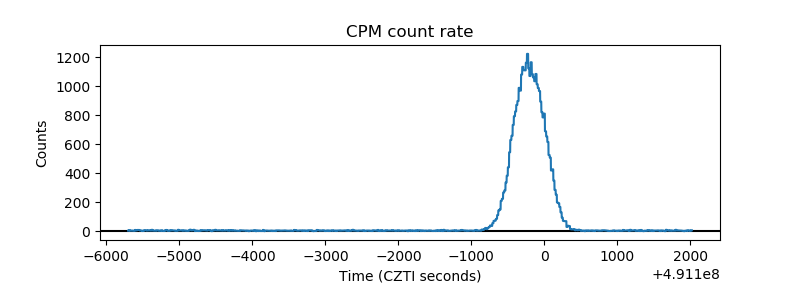 |
| CZT Counter | 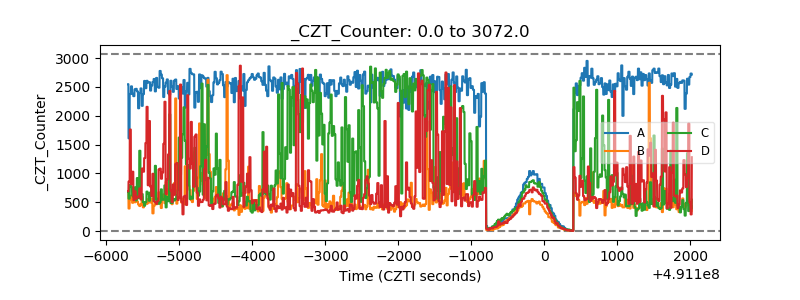 |
| +2.5 Volts monitor |  |
| +5 Volts monitor |  |
| _ROLL_ROT | 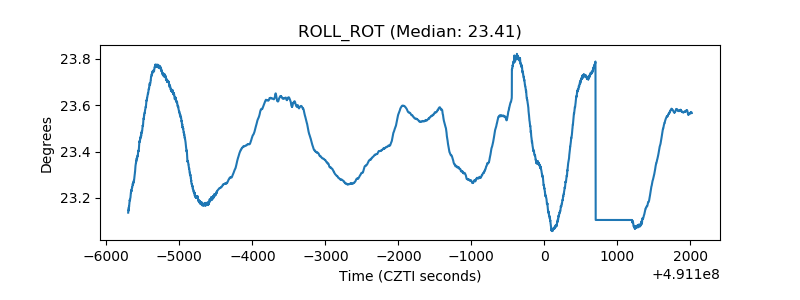 |
| _Roll_DEC | 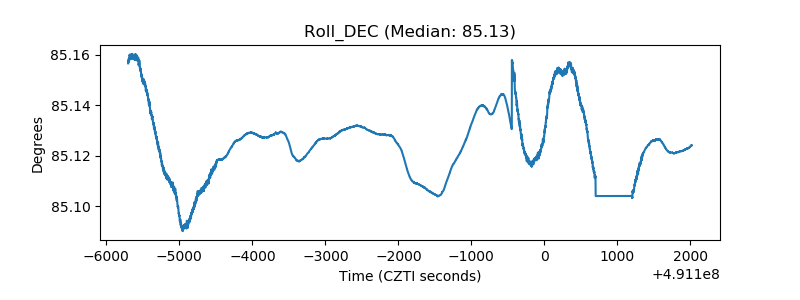 |
| _Roll_RA | 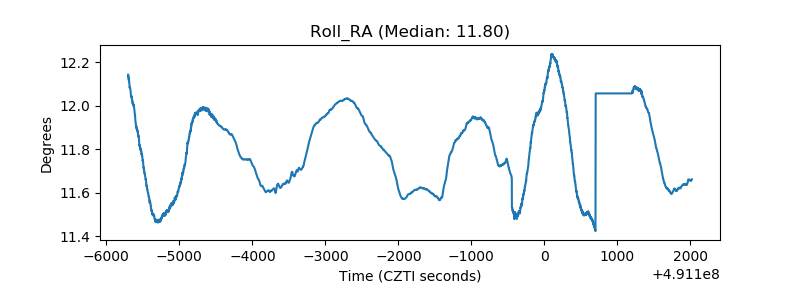 |
| Veto Counter | 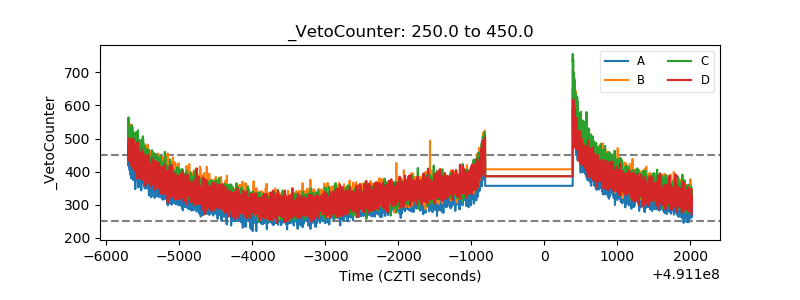 |