| Param | Original file | Final file |
|---|---|---|
| Filename | modeM0/AS1C09_011T07_9000006488_53136cztM0_level2.fits | modeM0/AS1C09_011T07_9000006488_53136cztM0_level2_quad_clean.evt |
| Size (bytes) | 759,516,480 | 66,841,920 |
| Size | 724.3 MB | 63.7 MB |
| Events in quadrant A | 14,731,558 | 189 |
| Events in quadrant B | 4,008,632 | 588,441 |
| Events in quadrant C | 4,198,608 | 534,749 |
| Events in quadrant D | 4,723,962 | 493,159 |
| Mode SS | |||
|---|---|---|---|
| Quadrant | BADHDUFLAG | Total packets | Discarded packets |
| A | 0 | 120 | 0 |
| B | 0 | 120 | 0 |
| C | 0 | 120 | 0 |
| D | 0 | 120 | 0 |
| Mode M9 | |||
|---|---|---|---|
| Quadrant | BADHDUFLAG | Total packets | Discarded packets |
| A | 0 | 12 | 0 |
| B | 0 | 12 | 0 |
| C | 0 | 12 | 0 |
| D | 0 | 12 | 0 |
| Mode M0 | |||
|---|---|---|---|
| Quadrant | BADHDUFLAG | Total packets | Discarded packets |
| A | 0 | 47665 | 1 |
| B | 0 | 16021 | 1 |
| C | 0 | 16564 | 1 |
| D | 0 | 18210 | 1 |
| Quadrant | Total seconds | Saturated seconds | Saturation percentage |
|---|---|---|---|
| A | 5822 | 5820 | 99.965648% |
| B | 5822 | 301 | 5.170045% |
| C | 5822 | 183 | 3.143250% |
| D | 5822 | 372 | 6.389557% |
Noise dominated data is calculated using 1-second bins in cleaned event files. If a bin has >2000 counts, and if more than 50% of those come from <1% of pixels, then it is considered to be noise-dominated and hence unusable.
| Quadrant | # 1 sec bins | Bins with >0 counts | Bins with >2000 counts | High rate bins dominated by noise | Noise dominated (total time) | Noise dominated (detector-on time) | Marked lightcurve |
|---|---|---|---|---|---|---|---|
| A | 7052 | 5823 | 5155 | 5155 | 73.10% | 88.53% | 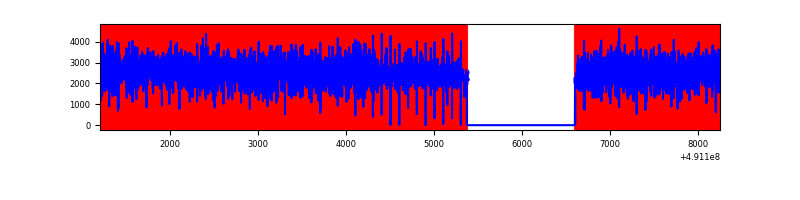 |
| B | 7052 | 5823 | 113 | 113 | 1.60% | 1.94% | 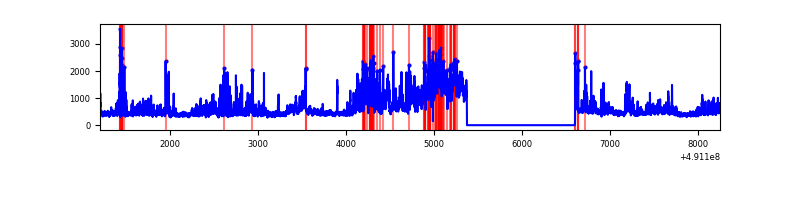 |
| C | 7052 | 5823 | 155 | 155 | 2.20% | 2.66% | 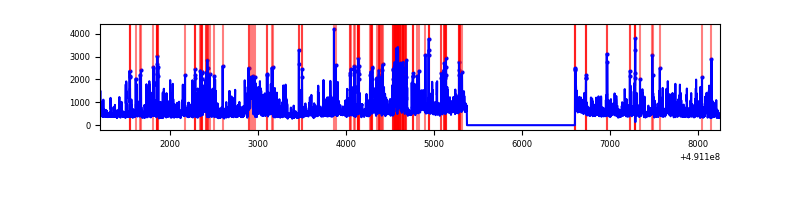 |
| D | 7052 | 5823 | 354 | 354 | 5.02% | 6.08% | 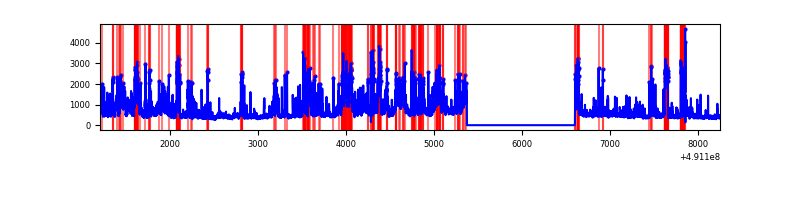 |
Top three noisy pixels from each quadrant. If the there are fewer than three noisy pixels in the level2.evt file, extra rows are filled as -1
| Pixel properties | Quadrant properties | ||||||
|---|---|---|---|---|---|---|---|
| Quadrant | DetID | PixID | Counts | Sigma | Mean | Median | Sigma |
| A | 9 | 191 | 13912327 | 362715.97 | 146 | 143 | 38.4 |
| A | 0 | 8 | 151075 | 3935.07 | 146 | 143 | 38.4 |
| A | 4 | 249 | 39706 | 1031.48 | 146 | 143 | 38.4 |
| B | 10 | 254 | 870181 | 7012.14 | 586 | 566 | 124.0 |
| B | 4 | 171 | 221542 | 1781.84 | 586 | 566 | 124.0 |
| B | 0 | 213 | 218163 | 1754.59 | 586 | 566 | 124.0 |
| C | 15 | 224 | 1133790 | 7178.89 | 569 | 563 | 157.9 |
| C | 13 | 3 | 123811 | 780.76 | 569 | 563 | 157.9 |
| C | 12 | 252 | 88409 | 556.5 | 569 | 563 | 157.9 |
| D | 8 | 176 | 529186 | 3241.36 | 561 | 534 | 163.1 |
| D | 6 | 42 | 417514 | 2556.66 | 561 | 534 | 163.1 |
| D | 2 | 62 | 367911 | 2252.53 | 561 | 534 | 163.1 |
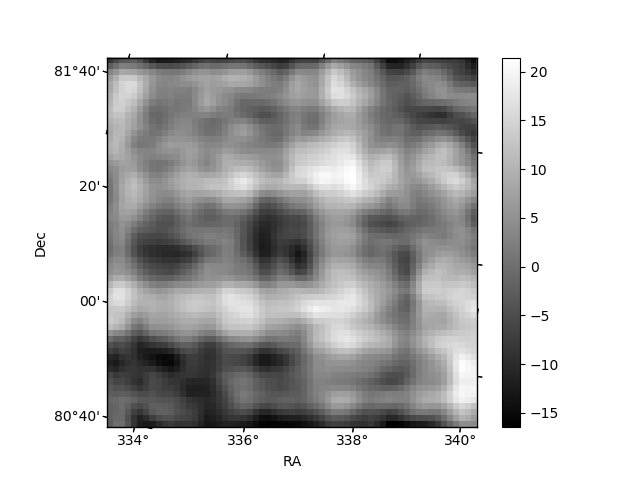
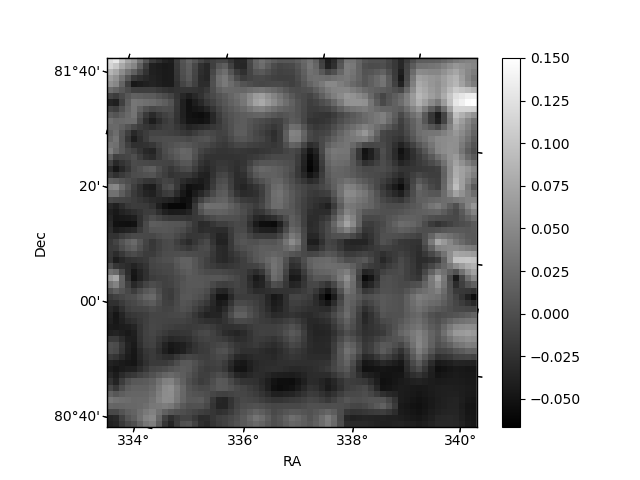
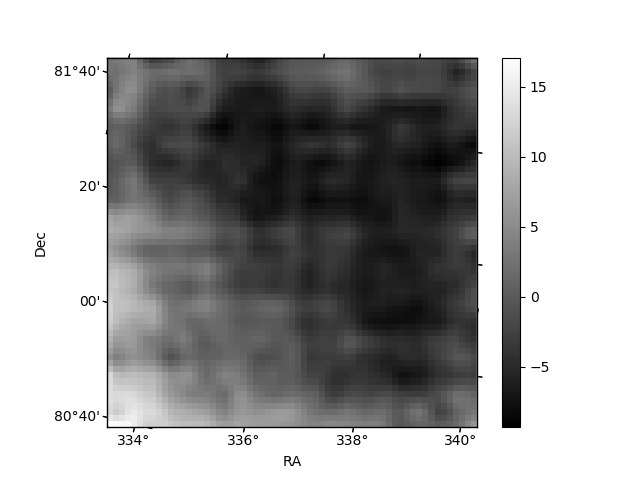
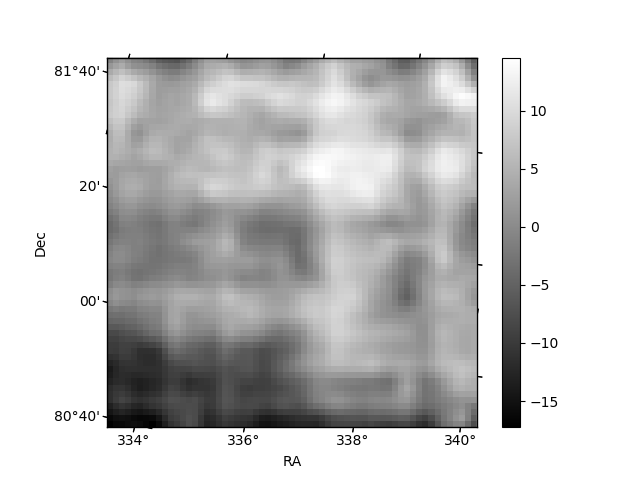
Histogram calculated using DETX and DETY for each event in the final _common_clean file
| Quadrant A | 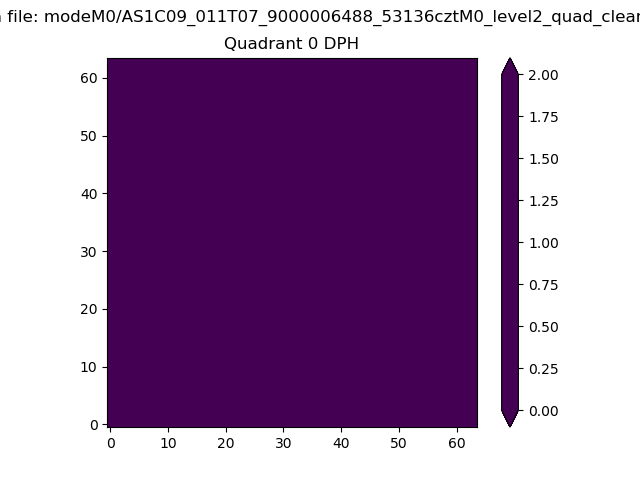 |
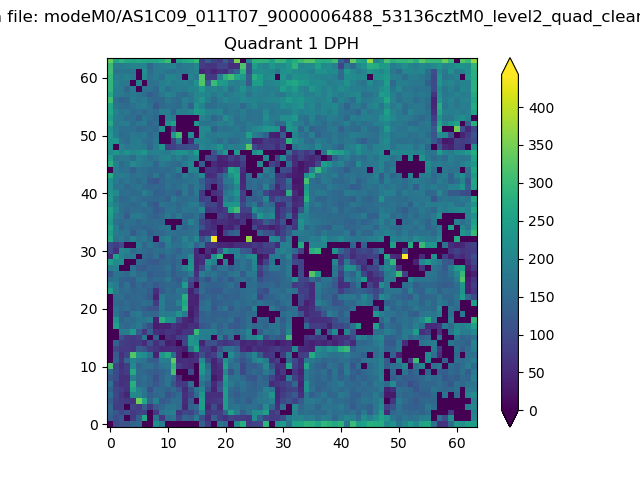 |
Quadrant B |
|---|---|---|---|
| Quadrant D | 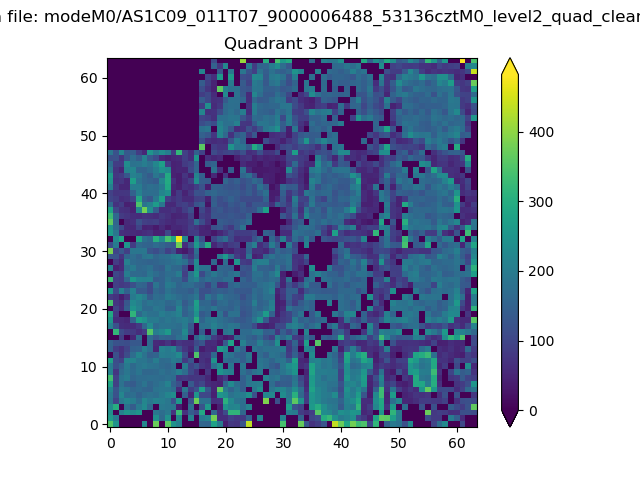 |
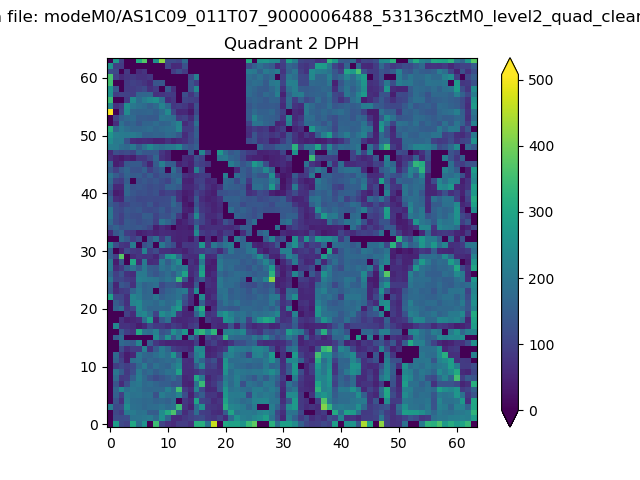 |
Quadrant C |
| Plot type | Count rate plots | Images |
|---|---|---|
| Comparison with Poisson distribution Blue bars denote a histogram of data divided into 1 sec bins. Red curve is a Poisson curve with rate = median count rate of data. |
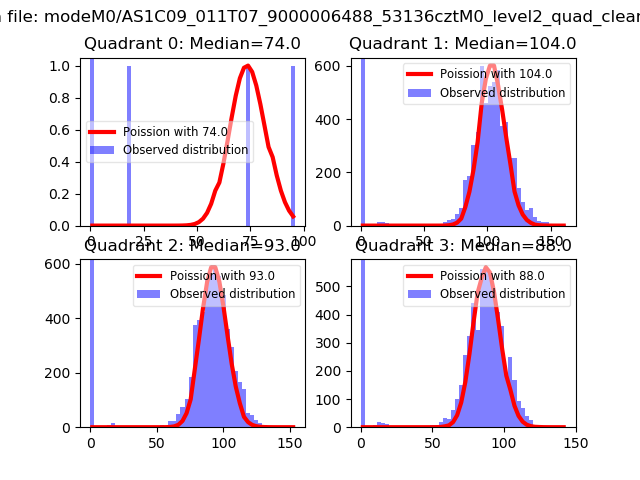 |
 |
| Quadrant-wise count rates Data is divided into 100 sec bins |
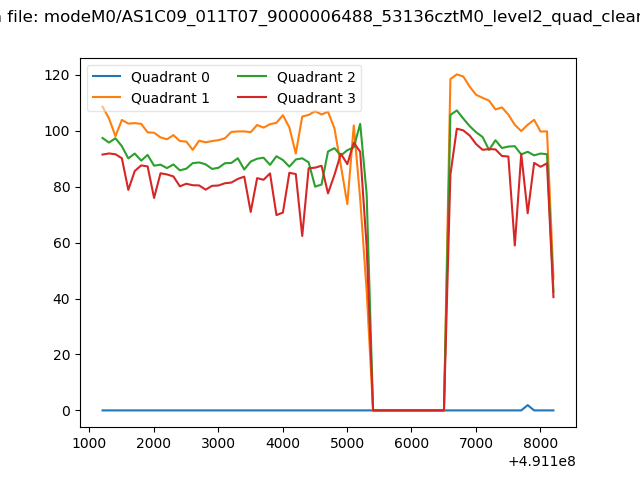 |
|
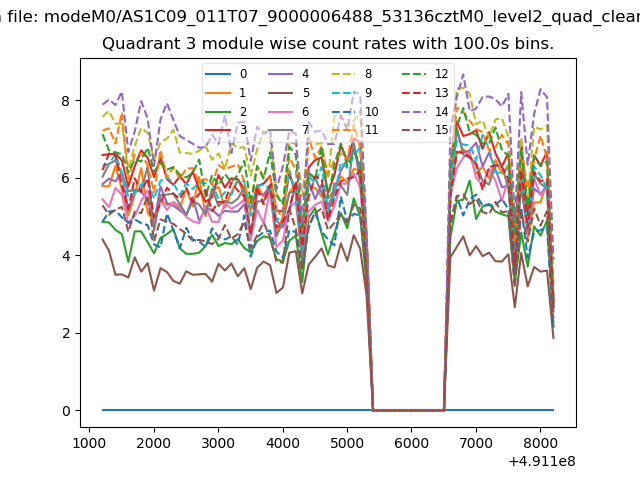
| Module-wise count rates for Quadrant A Data is divided into 100 sec bins |
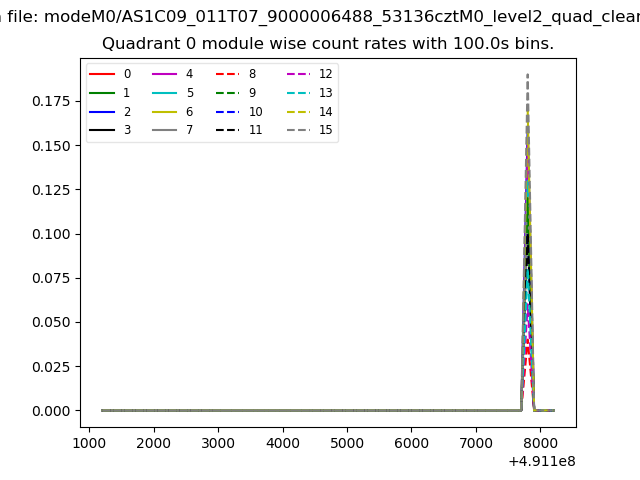 |
 |
| Module-wise count rates for Quadrant B Data is divided into 100 sec bins |
 |
 |
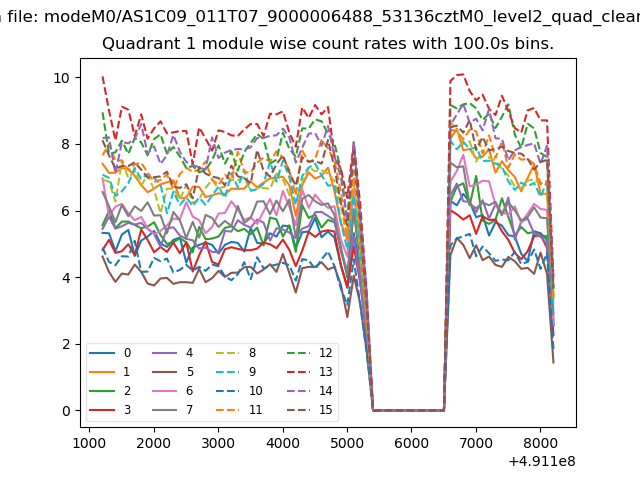
| Module-wise count rates for Quadrant C Data is divided into 100 sec bins |
 |
 |
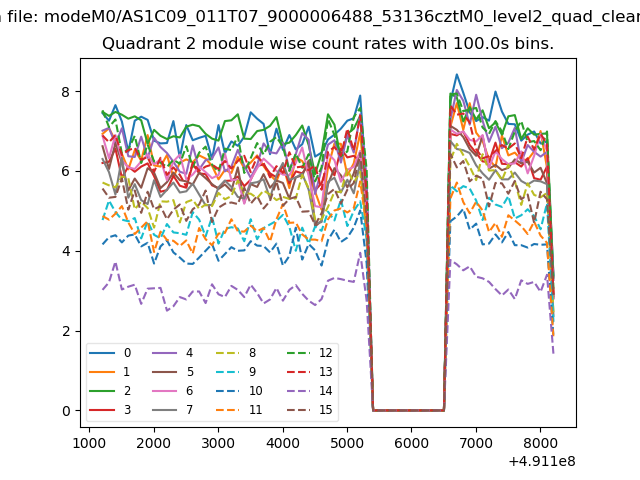
| Module-wise count rates for Quadrant D Data is divided into 100 sec bins |
 |
 |
| Parameter | Plot |
|---|---|
| CZT HV Monitor | 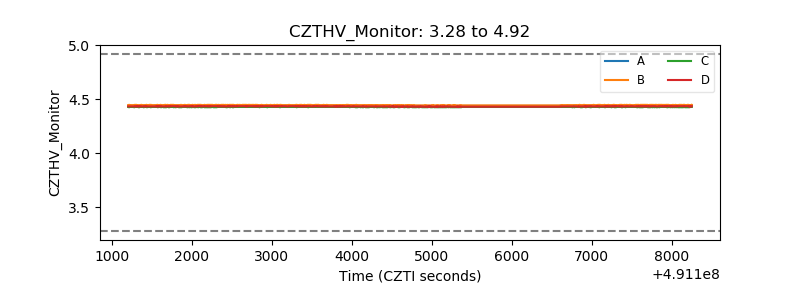 |
| D_VDD | 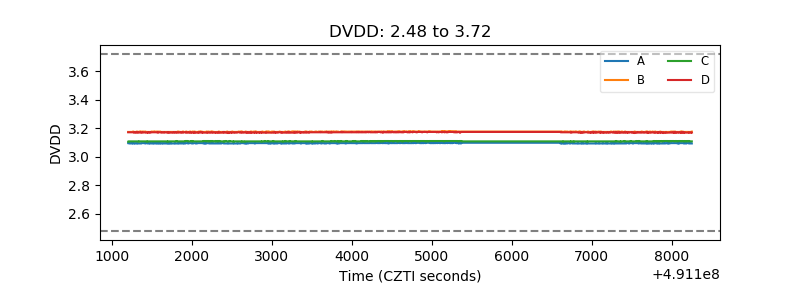 |
| Temperature 1 | 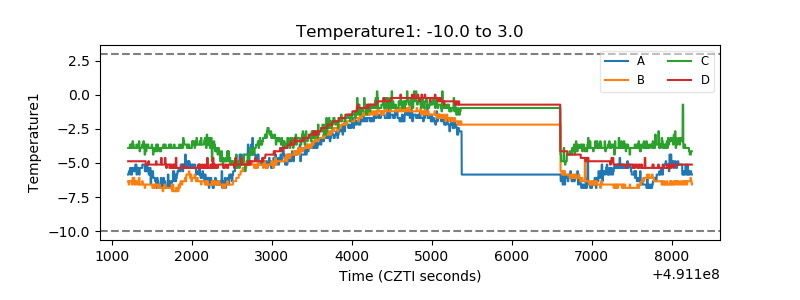 |
| Veto HV Monitor | 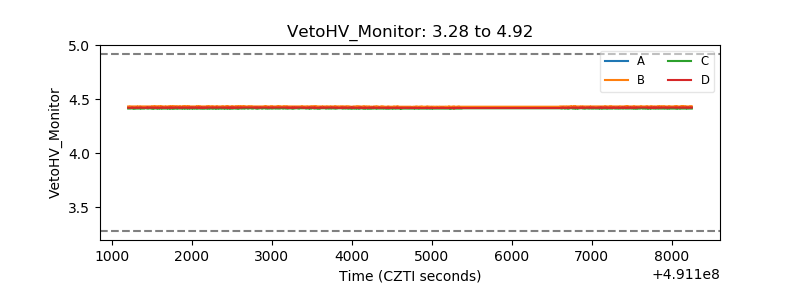 |
| Veto LLD | 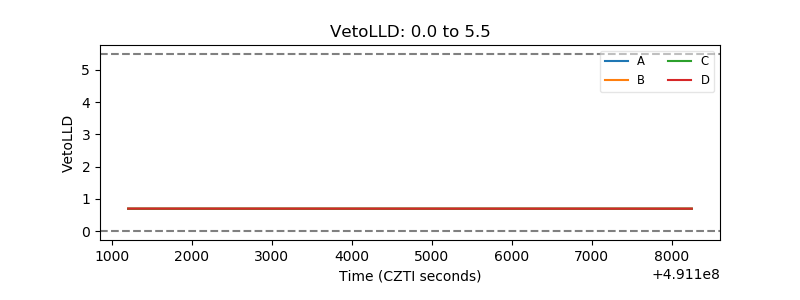 |
| Alpha Counter | 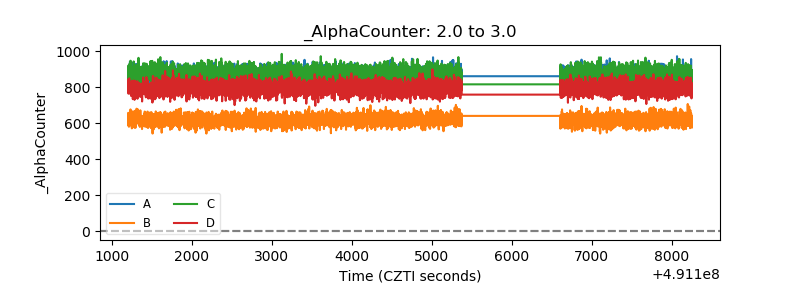 |
| _CPM_Rate | 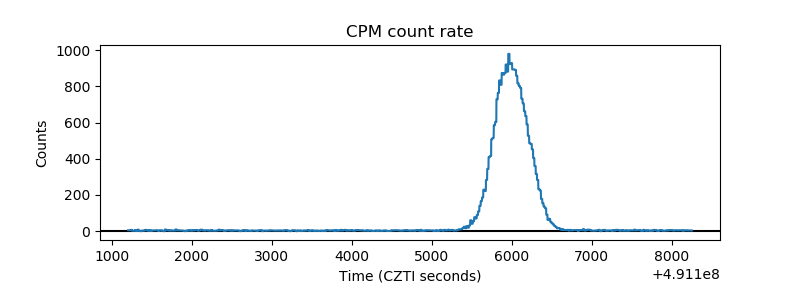 |
| CZT Counter | 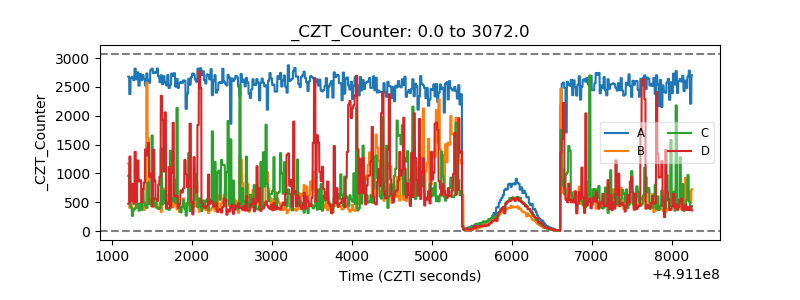 |
| +2.5 Volts monitor | 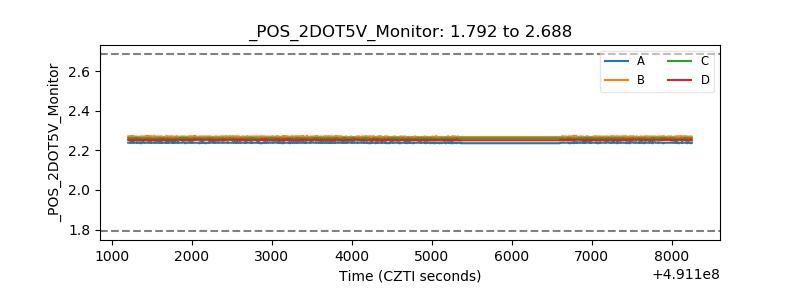 |
| +5 Volts monitor |  |
| _ROLL_ROT | 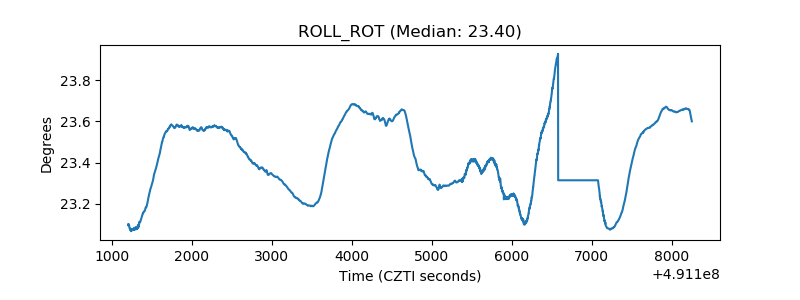 |
| _Roll_DEC | 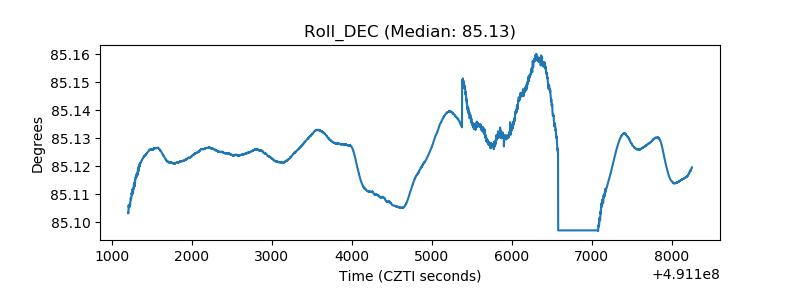 |
| _Roll_RA | 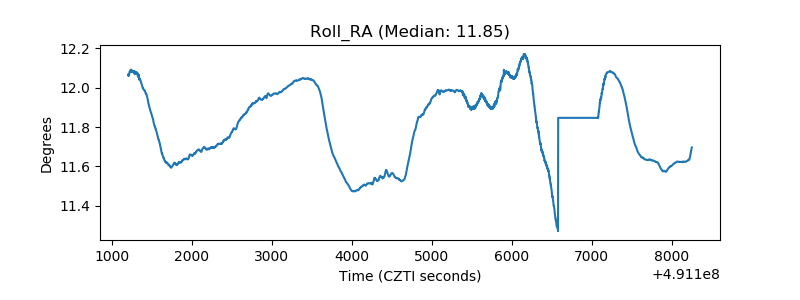 |
| Veto Counter | 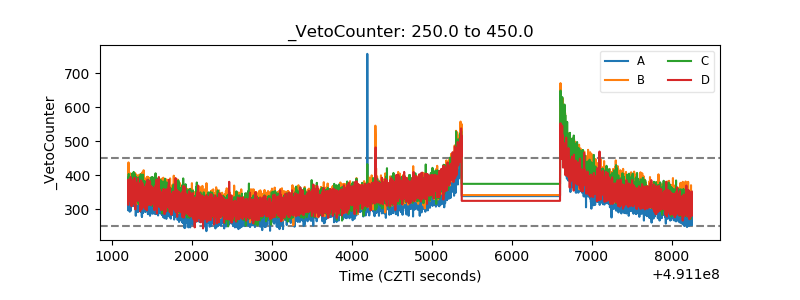 |