| Param | Original file | Final file |
|---|---|---|
| Filename | modeM0/AS1C09_011T07_9000006488_53137cztM0_level2.fits | modeM0/AS1C09_011T07_9000006488_53137cztM0_level2_quad_clean.evt |
| Size (bytes) | 781,318,080 | 69,626,880 |
| Size | 745.1 MB | 66.4 MB |
| Events in quadrant A | 15,327,319 | 6,360 |
| Events in quadrant B | 3,415,842 | 625,456 |
| Events in quadrant C | 5,606,236 | 526,416 |
| Events in quadrant D | 4,095,484 | 521,103 |
| Mode SS | |||
|---|---|---|---|
| Quadrant | BADHDUFLAG | Total packets | Discarded packets |
| A | 0 | 126 | 0 |
| B | 0 | 126 | 0 |
| C | 0 | 126 | 0 |
| D | 0 | 126 | 0 |
| Mode M9 | |||
|---|---|---|---|
| Quadrant | BADHDUFLAG | Total packets | Discarded packets |
| A | 0 | 11 | 0 |
| B | 0 | 11 | 0 |
| C | 0 | 11 | 0 |
| D | 0 | 11 | 0 |
| Mode M0 | |||
|---|---|---|---|
| Quadrant | BADHDUFLAG | Total packets | Discarded packets |
| A | 0 | 49574 | 1 |
| B | 0 | 14580 | 1 |
| C | 0 | 20922 | 3 |
| D | 0 | 16563 | 1 |
| Quadrant | Total seconds | Saturated seconds | Saturation percentage |
|---|---|---|---|
| A | 6140 | 6091 | 99.201954% |
| B | 6141 | 156 | 2.540303% |
| C | 6140 | 575 | 9.364821% |
| D | 6140 | 239 | 3.892508% |
Noise dominated data is calculated using 1-second bins in cleaned event files. If a bin has >2000 counts, and if more than 50% of those come from <1% of pixels, then it is considered to be noise-dominated and hence unusable.
| Quadrant | # 1 sec bins | Bins with >0 counts | Bins with >2000 counts | High rate bins dominated by noise | Noise dominated (total time) | Noise dominated (detector-on time) | Marked lightcurve |
|---|---|---|---|---|---|---|---|
| A | 7290 | 6141 | 5356 | 5356 | 73.47% | 87.22% | 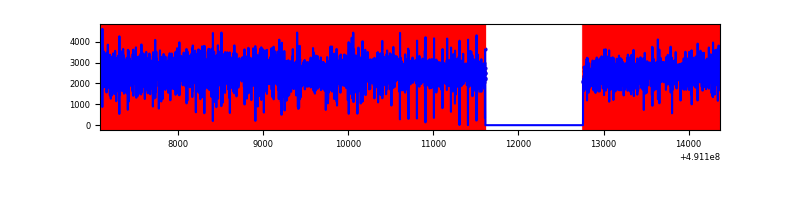 |
| B | 7291 | 6142 | 85 | 85 | 1.17% | 1.38% | 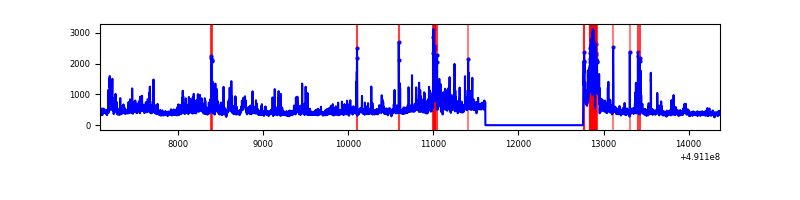 |
| C | 7290 | 6141 | 494 | 494 | 6.78% | 8.04% | 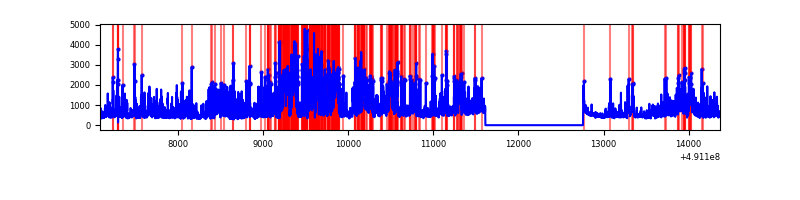 |
| D | 7290 | 6141 | 211 | 211 | 2.89% | 3.44% | 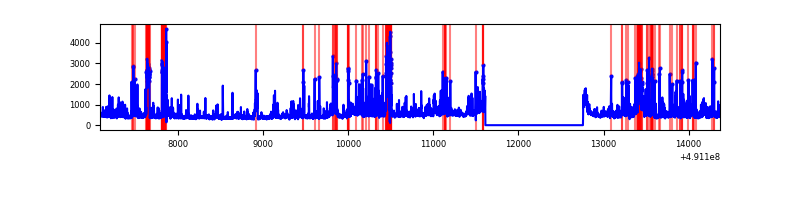 |
Top three noisy pixels from each quadrant. If the there are fewer than three noisy pixels in the level2.evt file, extra rows are filled as -1
| Pixel properties | Quadrant properties | ||||||
|---|---|---|---|---|---|---|---|
| Quadrant | DetID | PixID | Counts | Sigma | Mean | Median | Sigma |
| A | 9 | 191 | 14356838 | 261972.34 | 214 | 210 | 54.8 |
| A | 3 | 14 | 31436 | 569.8 | 214 | 210 | 54.8 |
| A | 0 | 8 | 23219 | 419.86 | 214 | 210 | 54.8 |
| B | 1 | 255 | 282257 | 2154.63 | 620 | 599 | 130.7 |
| B | 0 | 213 | 177680 | 1354.64 | 620 | 599 | 130.7 |
| B | 10 | 254 | 173591 | 1323.36 | 620 | 599 | 130.7 |
| C | 9 | 38 | 1111990 | 6916.94 | 584 | 579 | 160.7 |
| C | 15 | 224 | 651958 | 4053.9 | 584 | 579 | 160.7 |
| C | 13 | 3 | 552502 | 3434.93 | 584 | 579 | 160.7 |
| D | 3 | 224 | 340447 | 1986.18 | 596 | 570 | 171.1 |
| D | 8 | 176 | 290867 | 1696.44 | 596 | 570 | 171.1 |
| D | 1 | 0 | 203792 | 1187.59 | 596 | 570 | 171.1 |
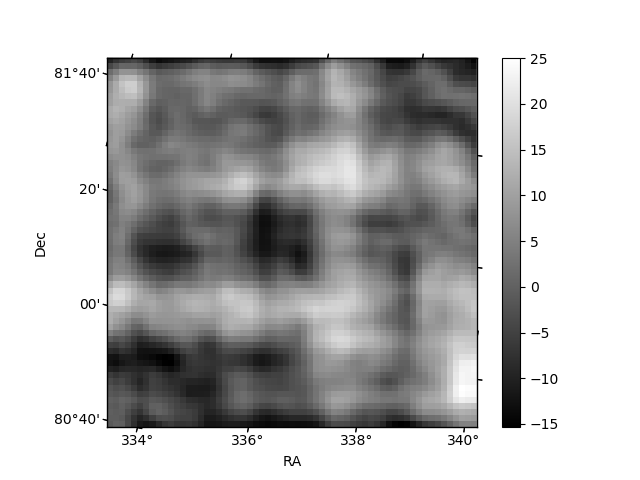
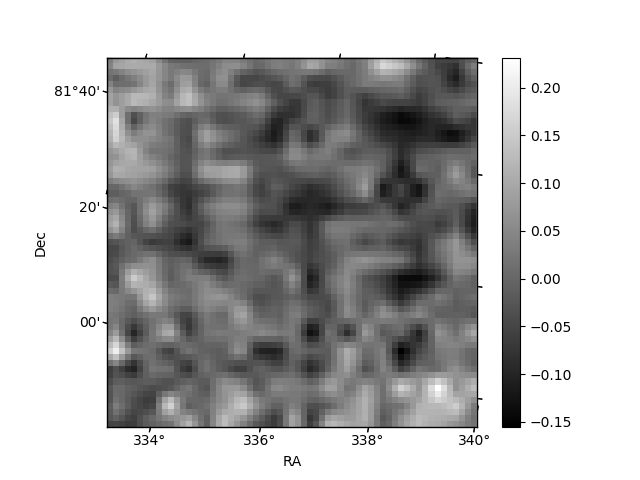
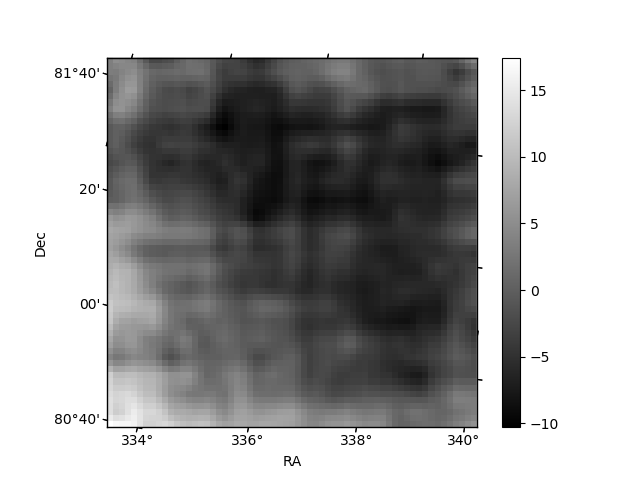
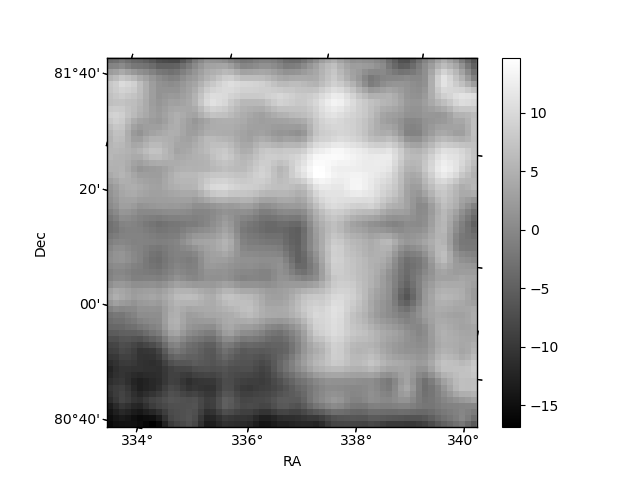
Histogram calculated using DETX and DETY for each event in the final _common_clean file
| Quadrant A | 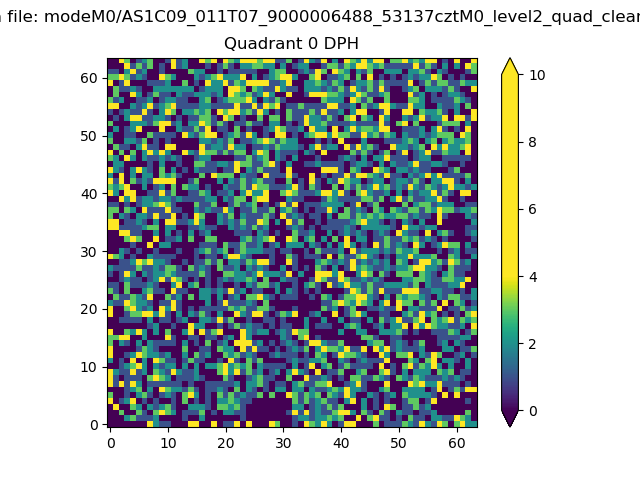 |
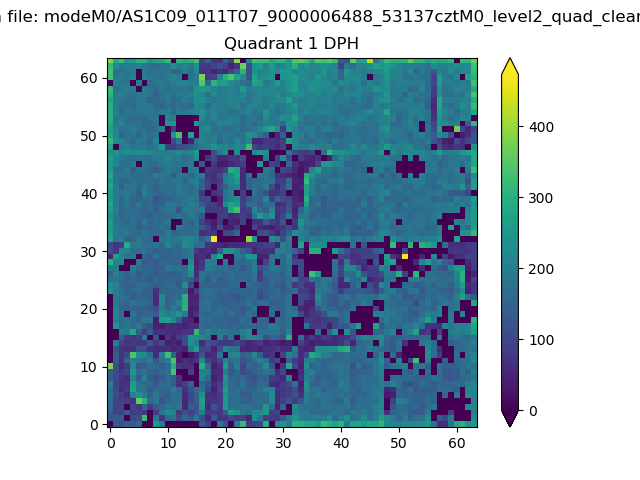 |
Quadrant B |
|---|---|---|---|
| Quadrant D | 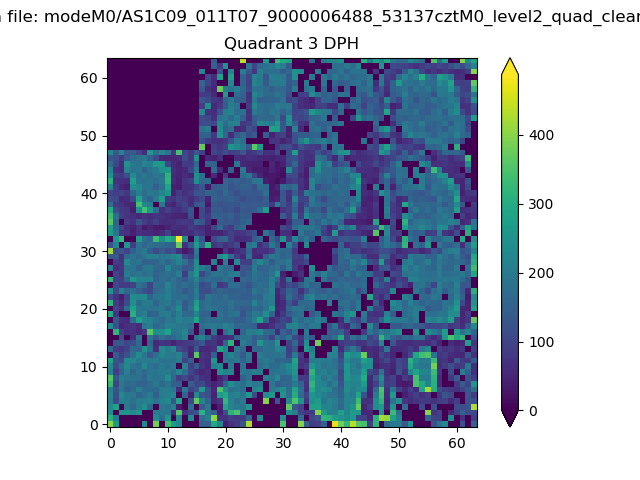 |
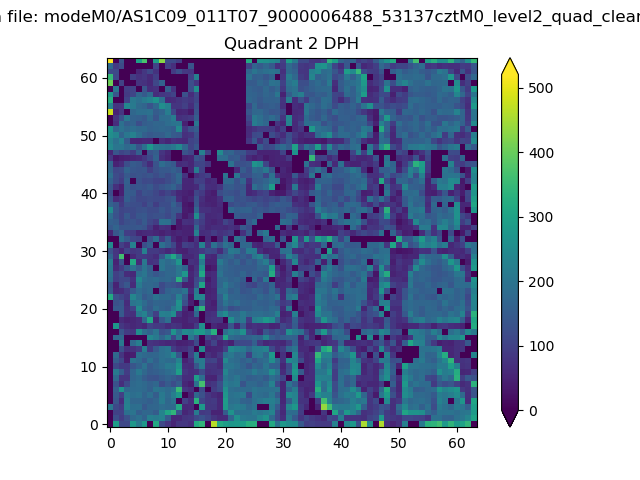 |
Quadrant C |
| Plot type | Count rate plots | Images |
|---|---|---|
| Comparison with Poisson distribution Blue bars denote a histogram of data divided into 1 sec bins. Red curve is a Poisson curve with rate = median count rate of data. |
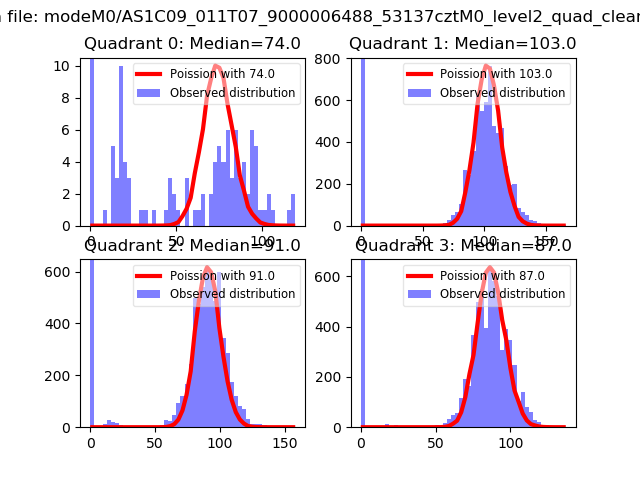 |
 |
| Quadrant-wise count rates Data is divided into 100 sec bins |
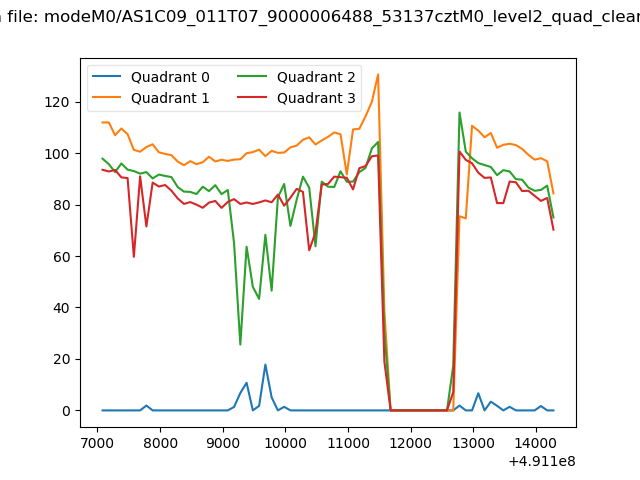 |
|
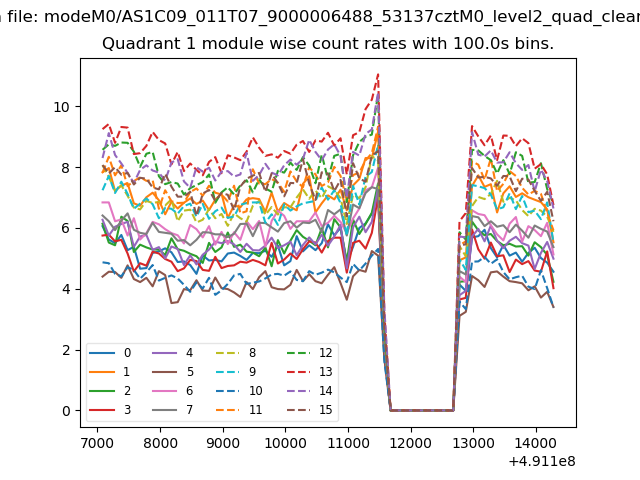
| Module-wise count rates for Quadrant A Data is divided into 100 sec bins |
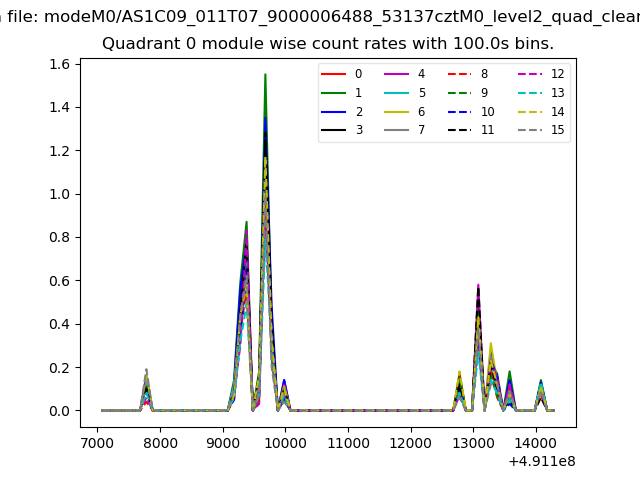 |
 |
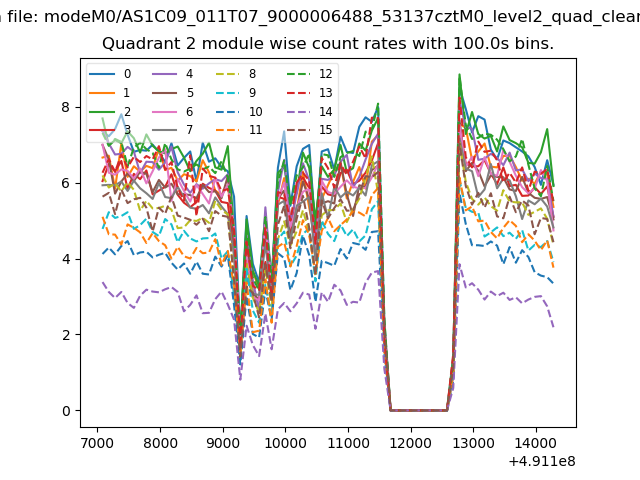
| Module-wise count rates for Quadrant B Data is divided into 100 sec bins |
 |
 |
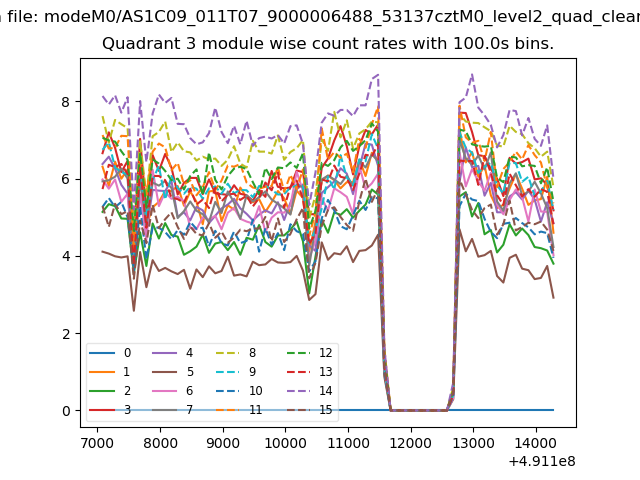
| Module-wise count rates for Quadrant C Data is divided into 100 sec bins |
 |
 |
| Module-wise count rates for Quadrant D Data is divided into 100 sec bins |
 |
 |
| Parameter | Plot |
|---|---|
| CZT HV Monitor |  |
| D_VDD | 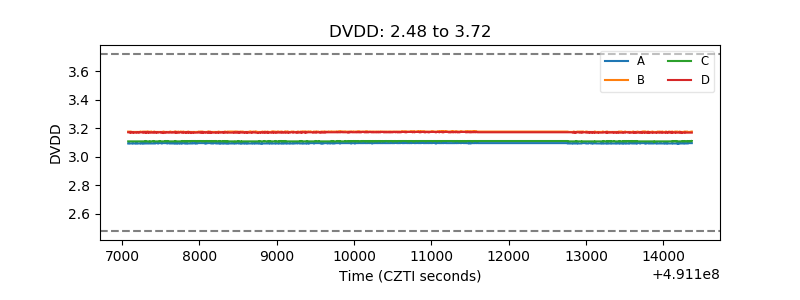 |
| Temperature 1 | 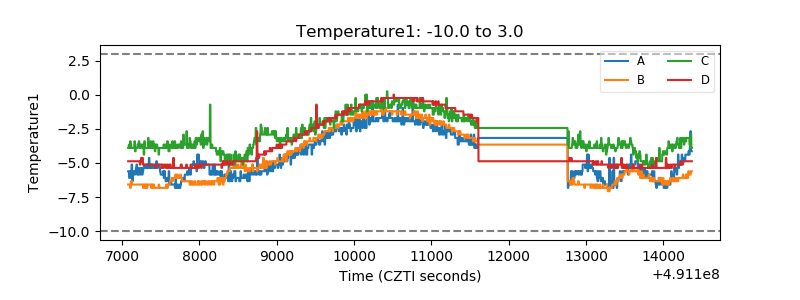 |
| Veto HV Monitor | 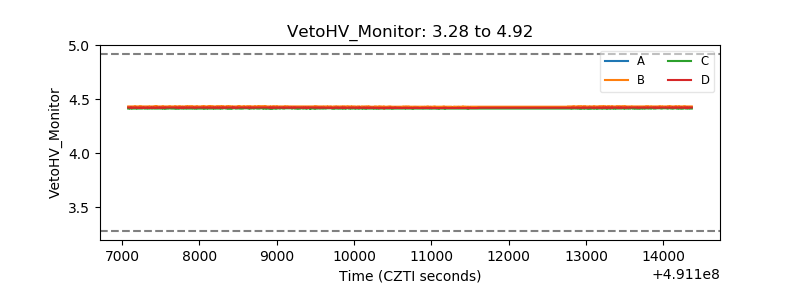 |
| Veto LLD | 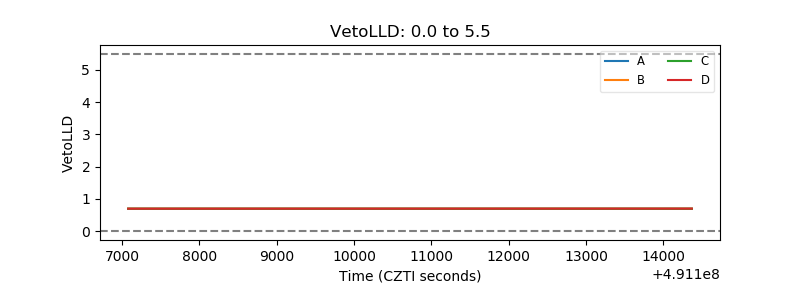 |
| Alpha Counter | 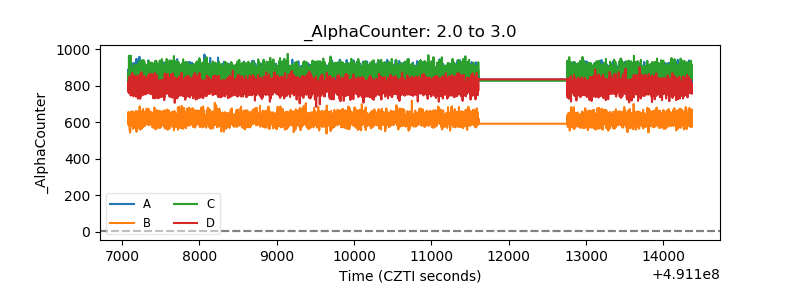 |
| _CPM_Rate | 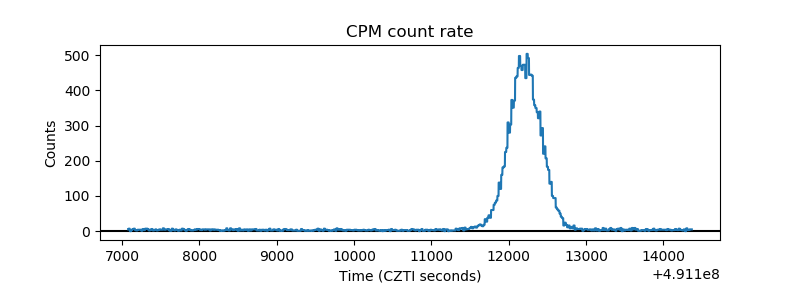 |
| CZT Counter | 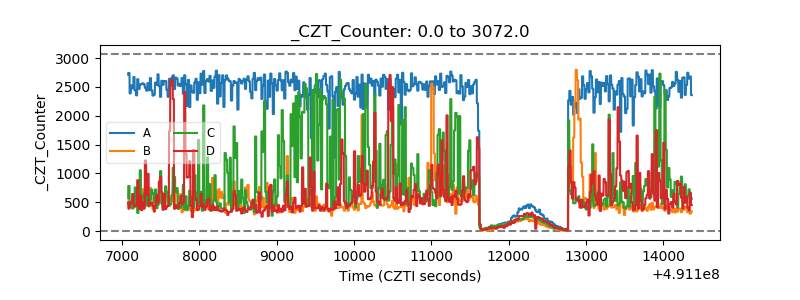 |
| +2.5 Volts monitor |  |
| +5 Volts monitor |  |
| _ROLL_ROT | 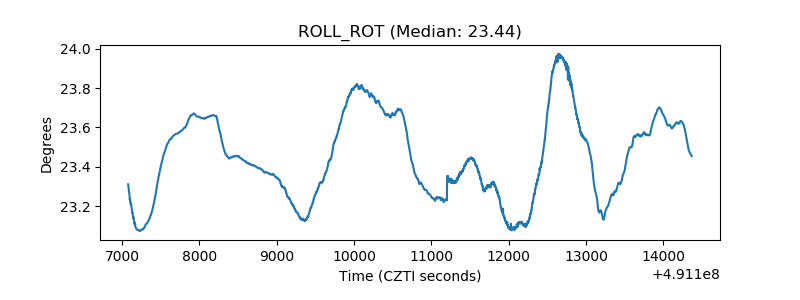 |
| _Roll_DEC | 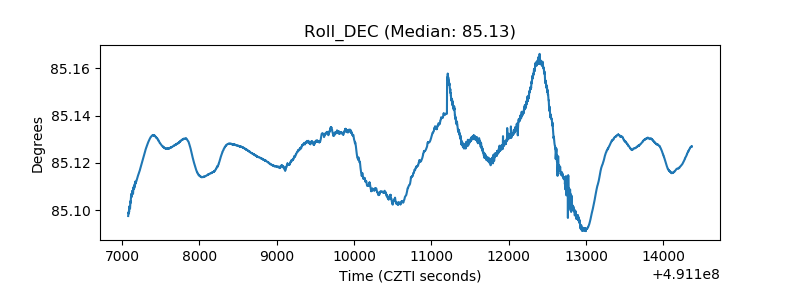 |
| _Roll_RA | 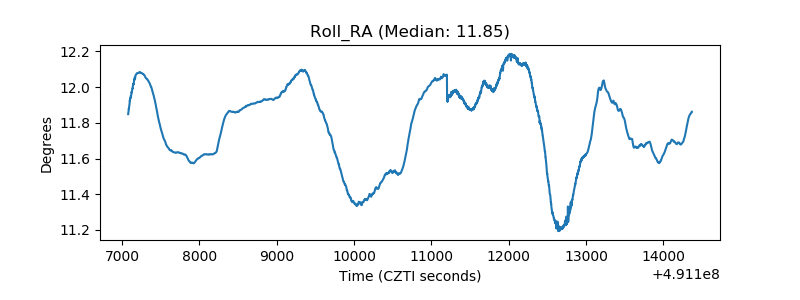 |
| Veto Counter | 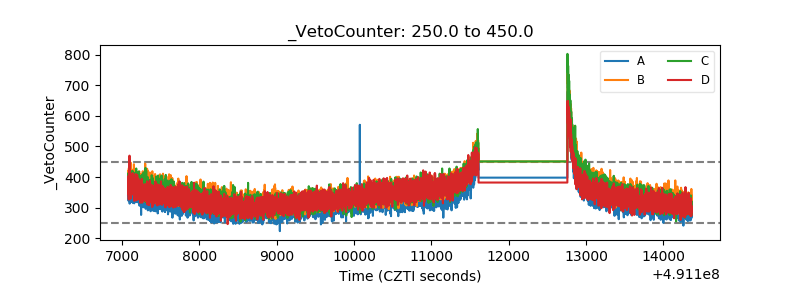 |