| Param | Original file | Final file |
|---|---|---|
| Filename | modeM0/AS1C09_011T07_9000006488_53140cztM0_level2.fits | modeM0/AS1C09_011T07_9000006488_53140cztM0_level2_quad_clean.evt |
| Size (bytes) | 960,822,720 | 75,669,120 |
| Size | 916.3 MB | 72.2 MB |
| Events in quadrant A | 17,726,563 | 2,265 |
| Events in quadrant B | 5,837,623 | 633,309 |
| Events in quadrant C | 6,951,996 | 575,066 |
| Events in quadrant D | 4,505,809 | 590,604 |
| Mode SS | |||
|---|---|---|---|
| Quadrant | BADHDUFLAG | Total packets | Discarded packets |
| A | 0 | 140 | 0 |
| B | 0 | 140 | 0 |
| C | 0 | 140 | 0 |
| D | 0 | 140 | 0 |
| Mode M0 | |||
|---|---|---|---|
| Quadrant | BADHDUFLAG | Total packets | Discarded packets |
| A | 0 | 57367 | 0 |
| B | 0 | 22345 | 1 |
| C | 0 | 25605 | 0 |
| D | 0 | 18396 | 0 |
| Quadrant | Total seconds | Saturated seconds | Saturation percentage |
|---|---|---|---|
| A | 7030 | 7014 | 99.772404% |
| B | 7030 | 874 | 12.432432% |
| C | 7030 | 838 | 11.920341% |
| D | 7030 | 154 | 2.190612% |
Noise dominated data is calculated using 1-second bins in cleaned event files. If a bin has >2000 counts, and if more than 50% of those come from <1% of pixels, then it is considered to be noise-dominated and hence unusable.
| Quadrant | # 1 sec bins | Bins with >0 counts | Bins with >2000 counts | High rate bins dominated by noise | Noise dominated (total time) | Noise dominated (detector-on time) | Marked lightcurve |
|---|---|---|---|---|---|---|---|
| A | 7030 | 7029 | 6146 | 6146 | 87.43% | 87.44% | 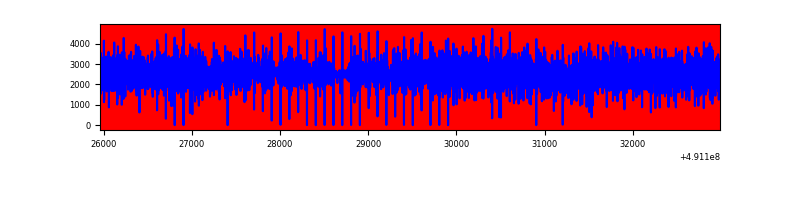 |
| B | 7030 | 7030 | 608 | 608 | 8.65% | 8.65% | 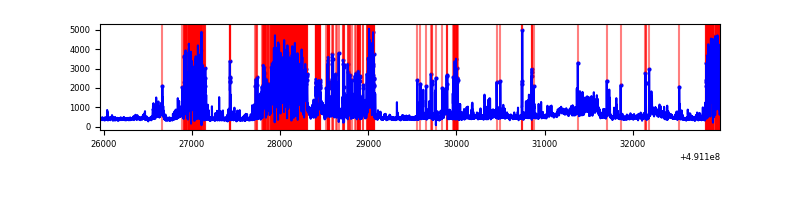 |
| C | 7030 | 7029 | 664 | 664 | 9.45% | 9.45% | 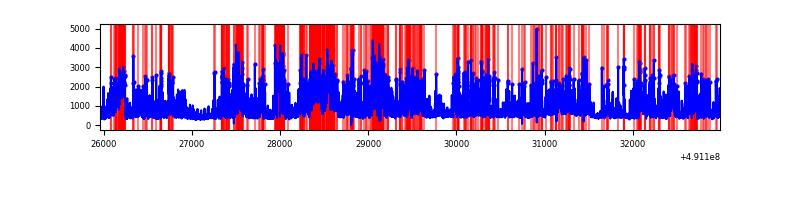 |
| D | 7030 | 7030 | 103 | 103 | 1.47% | 1.47% | 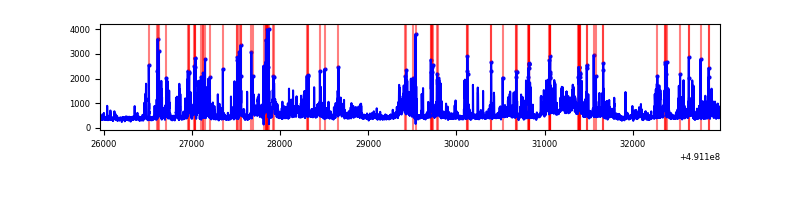 |
Top three noisy pixels from each quadrant. If the there are fewer than three noisy pixels in the level2.evt file, extra rows are filled as -1
| Pixel properties | Quadrant properties | ||||||
|---|---|---|---|---|---|---|---|
| Quadrant | DetID | PixID | Counts | Sigma | Mean | Median | Sigma |
| A | 9 | 191 | 16520818 | 298420.41 | 217 | 211 | 55.4 |
| A | 0 | 8 | 165028 | 2977.18 | 217 | 211 | 55.4 |
| A | 7 | 206 | 67956 | 1223.71 | 217 | 211 | 55.4 |
| B | 2 | 249 | 1802828 | 12286.86 | 681 | 659 | 146.7 |
| B | 10 | 247 | 406924 | 2769.84 | 681 | 659 | 146.7 |
| B | 1 | 255 | 264666 | 1799.95 | 681 | 659 | 146.7 |
| C | 15 | 224 | 2814478 | 15222.79 | 673 | 665 | 184.8 |
| C | 9 | 38 | 773479 | 4180.94 | 673 | 665 | 184.8 |
| C | 0 | 240 | 207128 | 1116.97 | 673 | 665 | 184.8 |
| D | 12 | 3 | 756603 | 3736.43 | 702 | 668 | 202.3 |
| D | 3 | 12 | 199089 | 980.75 | 702 | 668 | 202.3 |
| D | 10 | 172 | 110671 | 543.72 | 702 | 668 | 202.3 |
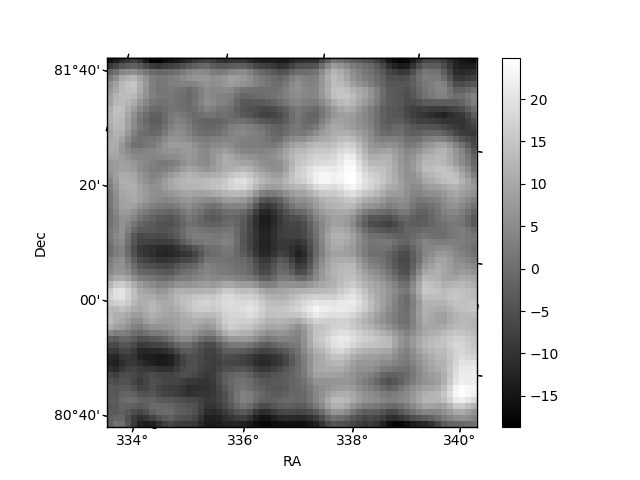
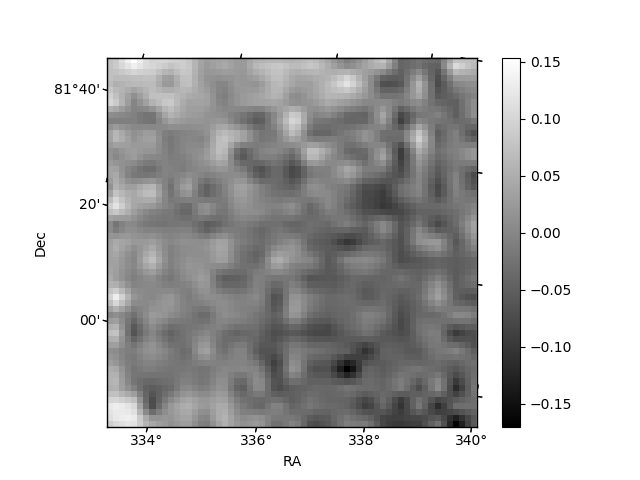
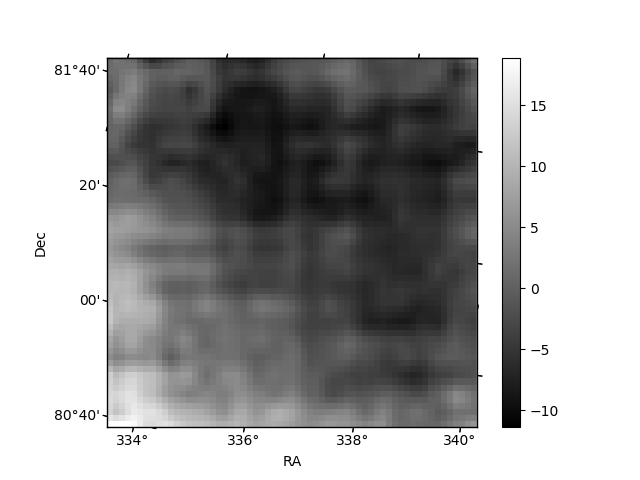
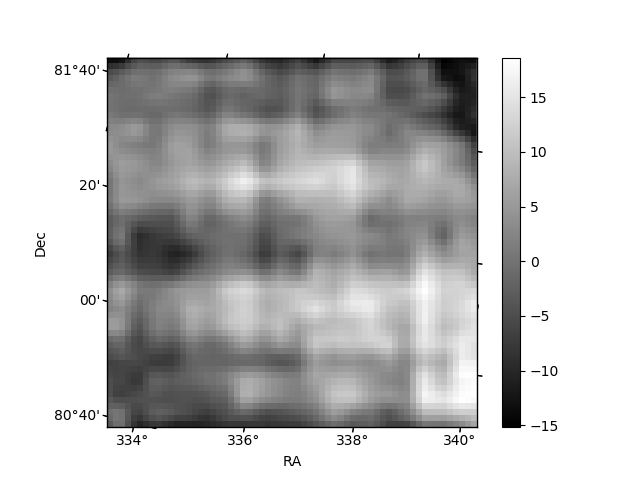
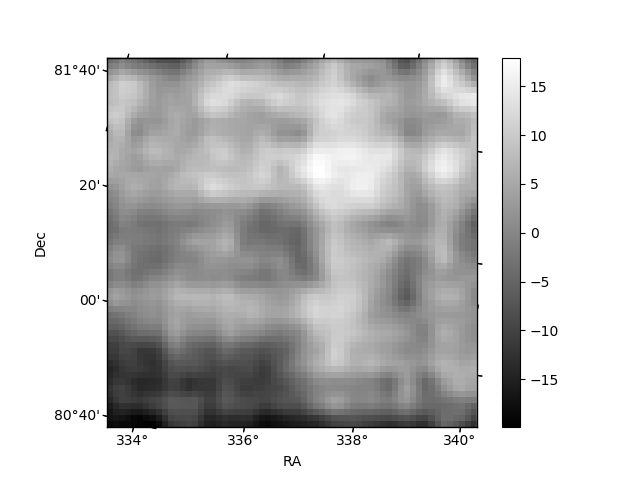
Histogram calculated using DETX and DETY for each event in the final _common_clean file
| Quadrant A | 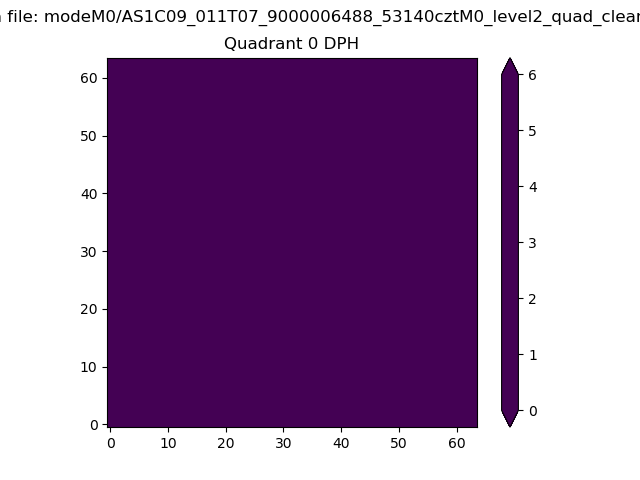 |
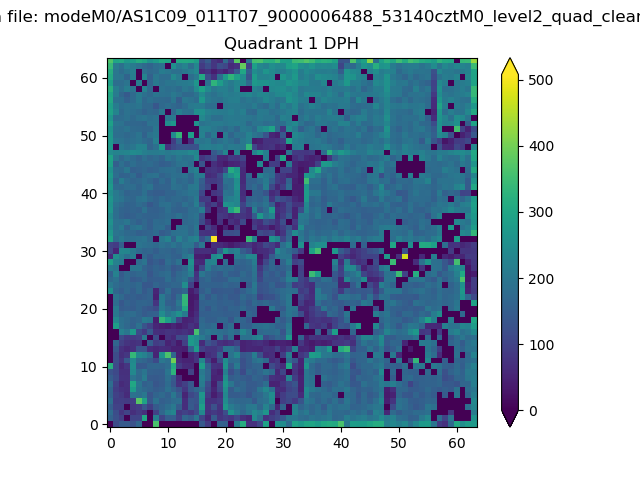 |
Quadrant B |
|---|---|---|---|
| Quadrant D | 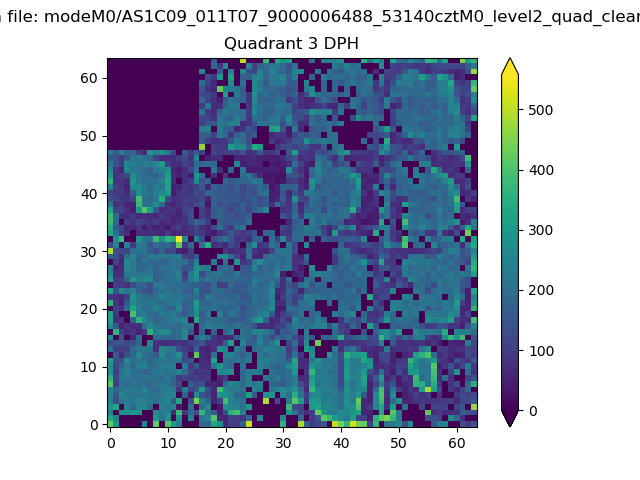 |
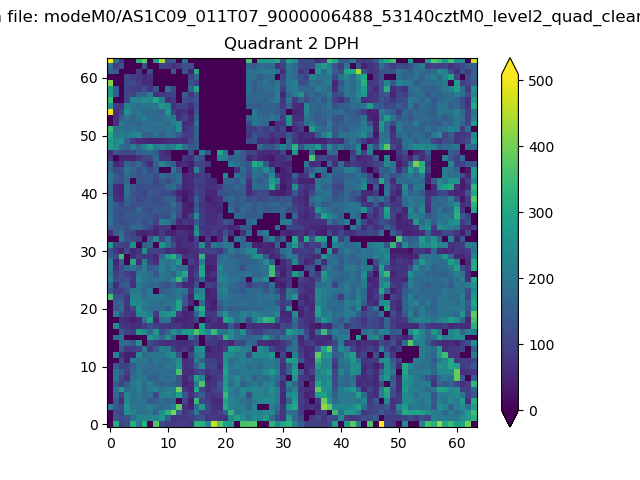 |
Quadrant C |
| Plot type | Count rate plots | Images |
|---|---|---|
| Comparison with Poisson distribution Blue bars denote a histogram of data divided into 1 sec bins. Red curve is a Poisson curve with rate = median count rate of data. |
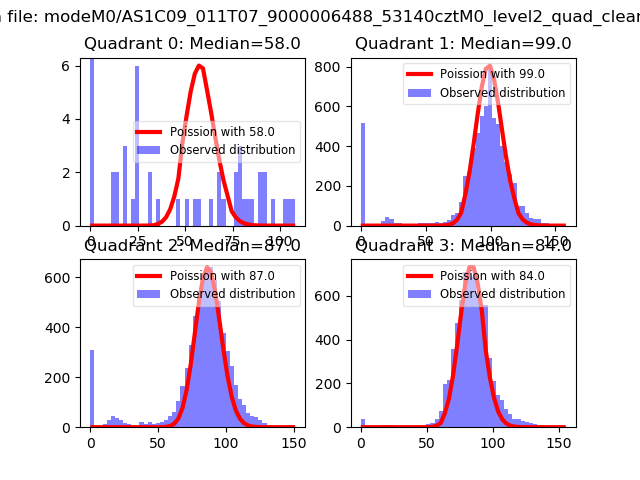 |
 |
| Quadrant-wise count rates Data is divided into 100 sec bins |
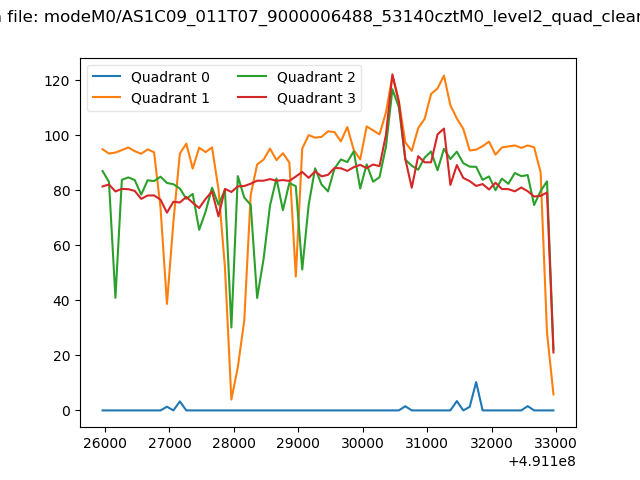 |
|
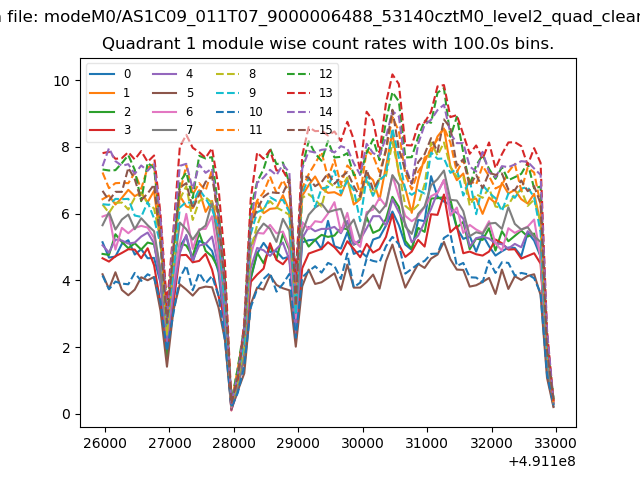
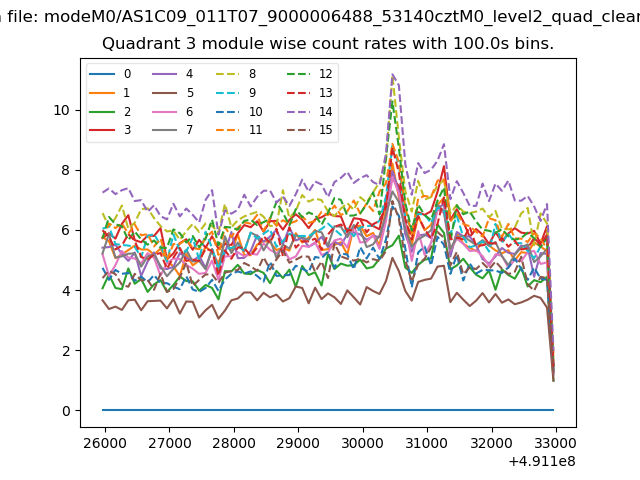
| Module-wise count rates for Quadrant A Data is divided into 100 sec bins |
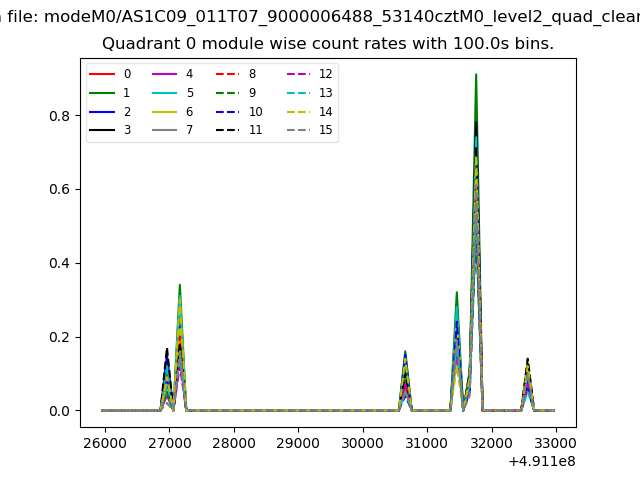 |
 |
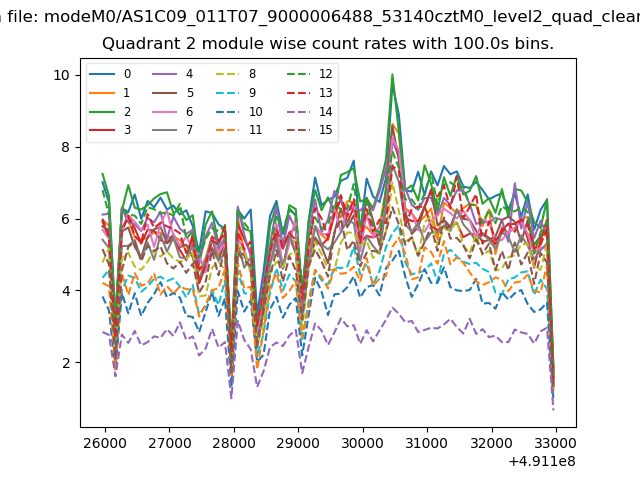
| Module-wise count rates for Quadrant B Data is divided into 100 sec bins |
 |
 |
| Module-wise count rates for Quadrant C Data is divided into 100 sec bins |
 |
 |
| Module-wise count rates for Quadrant D Data is divided into 100 sec bins |
 |
 |
| Parameter | Plot |
|---|---|
| CZT HV Monitor | 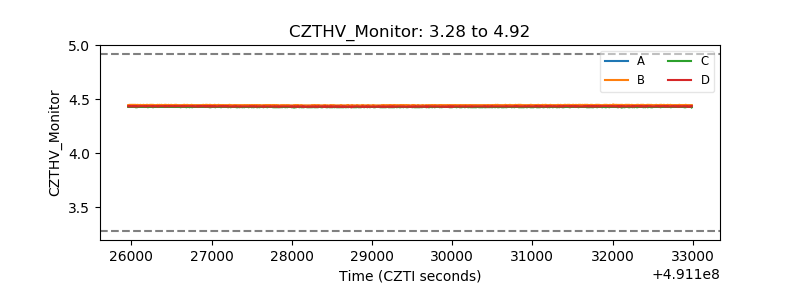 |
| D_VDD | 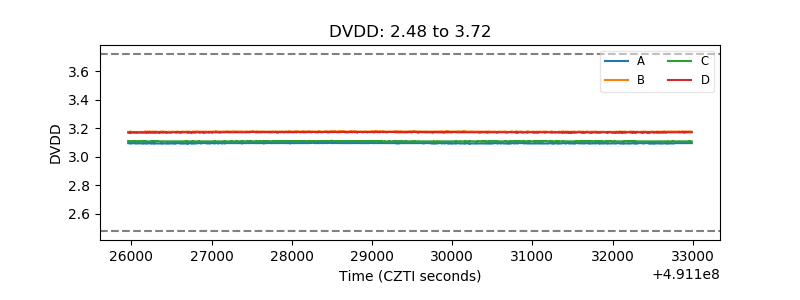 |
| Temperature 1 | 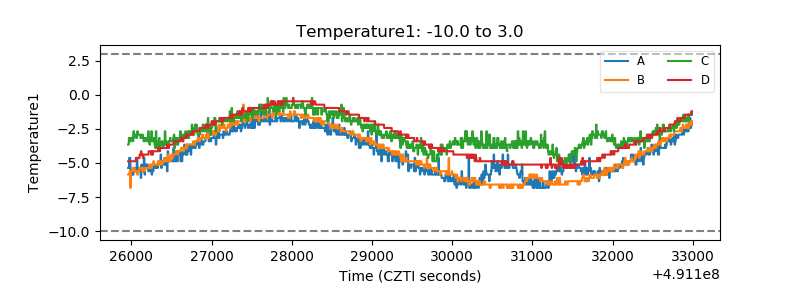 |
| Veto HV Monitor | 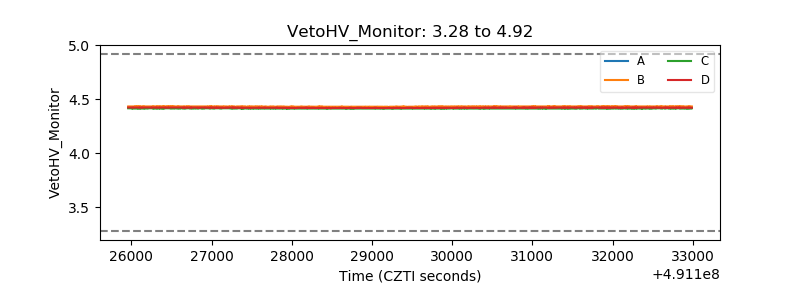 |
| Veto LLD | 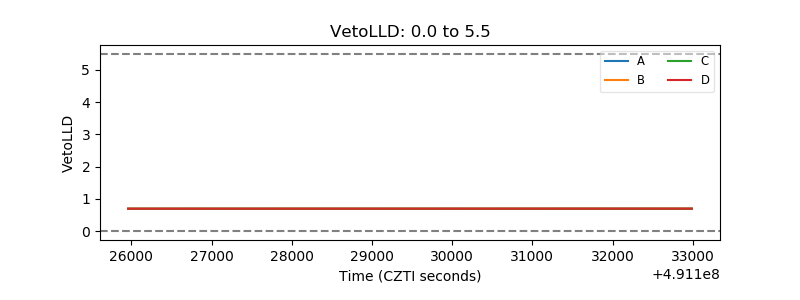 |
| Alpha Counter | 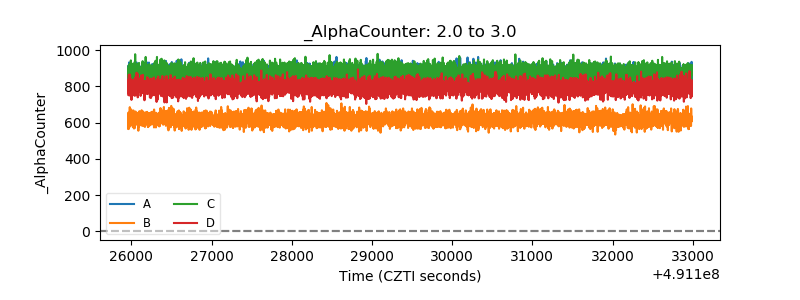 |
| _CPM_Rate | 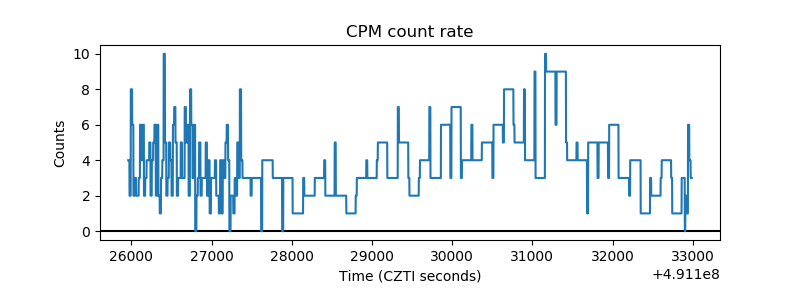 |
| CZT Counter | 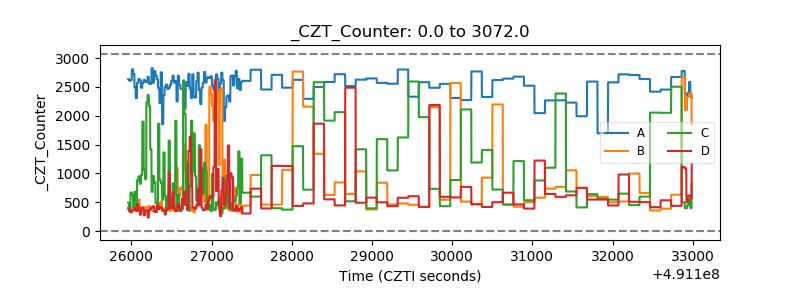 |
| +2.5 Volts monitor | 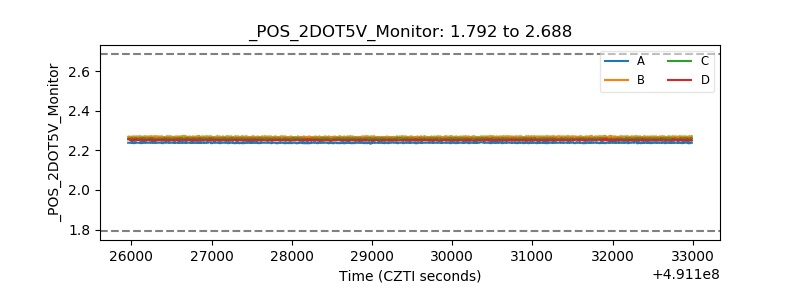 |
| +5 Volts monitor |  |
| _ROLL_ROT | 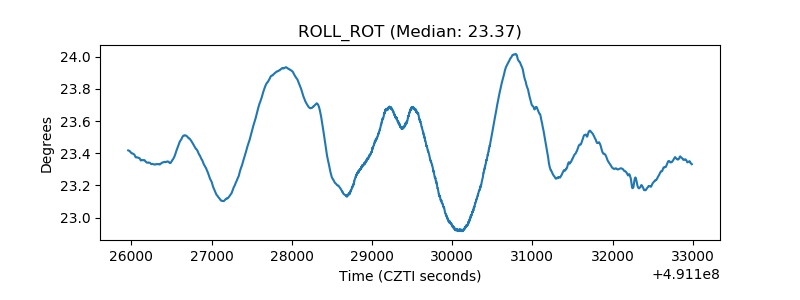 |
| _Roll_DEC | 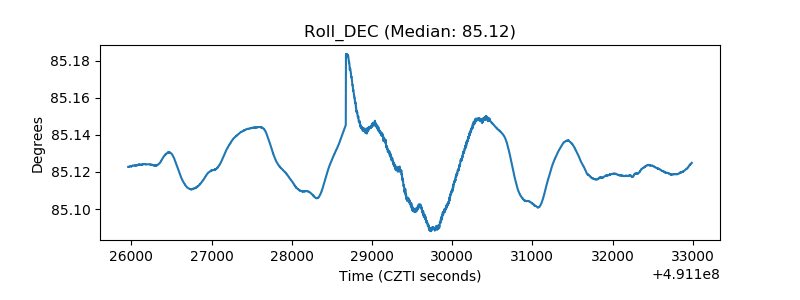 |
| _Roll_RA | 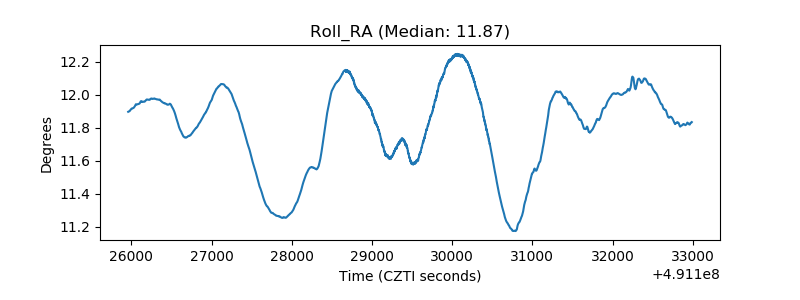 |
| Veto Counter | 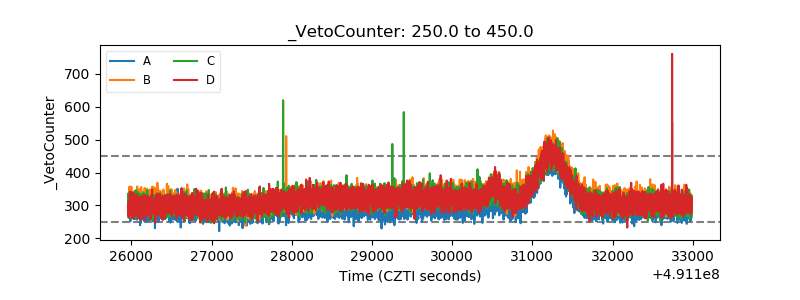 |