| Param | Original file | Final file |
|---|---|---|
| Filename | modeM0/AS1C09_011T07_9000006488_53141cztM0_level2.fits | modeM0/AS1C09_011T07_9000006488_53141cztM0_level2_quad_clean.evt |
| Size (bytes) | 1,116,224,640 | 69,258,240 |
| Size | 1.0 GB | 66.0 MB |
| Events in quadrant A | 17,817,435 | 4,262 |
| Events in quadrant B | 10,035,308 | 515,629 |
| Events in quadrant C | 8,919,914 | 496,340 |
| Events in quadrant D | 4,000,640 | 588,675 |
| Mode SS | |||
|---|---|---|---|
| Quadrant | BADHDUFLAG | Total packets | Discarded packets |
| A | 0 | 140 | 0 |
| B | 0 | 140 | 0 |
| C | 0 | 140 | 0 |
| D | 0 | 140 | 0 |
| Mode M0 | |||
|---|---|---|---|
| Quadrant | BADHDUFLAG | Total packets | Discarded packets |
| A | 0 | 57722 | 0 |
| B | 0 | 34761 | 0 |
| C | 0 | 31424 | 0 |
| D | 0 | 17013 | 0 |
| Quadrant | Total seconds | Saturated seconds | Saturation percentage |
|---|---|---|---|
| A | 7064 | 7032 | 99.546999% |
| B | 7064 | 2218 | 31.398641% |
| C | 7065 | 1705 | 24.133050% |
| D | 7065 | 119 | 1.684360% |
Noise dominated data is calculated using 1-second bins in cleaned event files. If a bin has >2000 counts, and if more than 50% of those come from <1% of pixels, then it is considered to be noise-dominated and hence unusable.
| Quadrant | # 1 sec bins | Bins with >0 counts | Bins with >2000 counts | High rate bins dominated by noise | Noise dominated (total time) | Noise dominated (detector-on time) | Marked lightcurve |
|---|---|---|---|---|---|---|---|
| A | 7063 | 7063 | 6125 | 6125 | 86.72% | 86.72% | 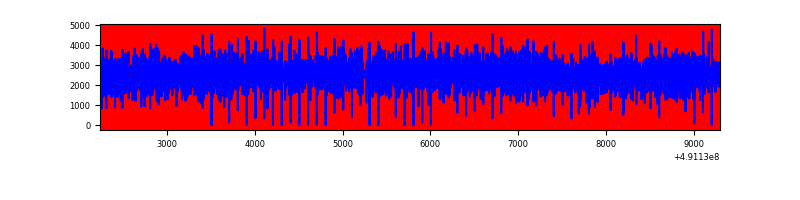 |
| B | 7064 | 7064 | 1634 | 1634 | 23.13% | 23.13% | 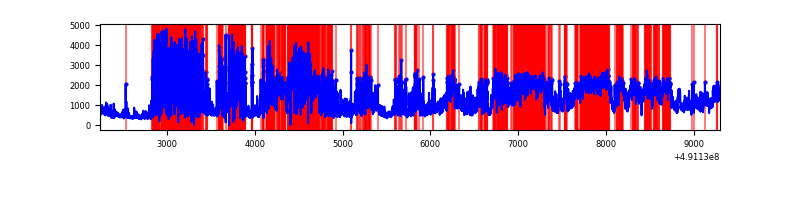 |
| C | 7065 | 7064 | 1431 | 1431 | 20.25% | 20.26% | 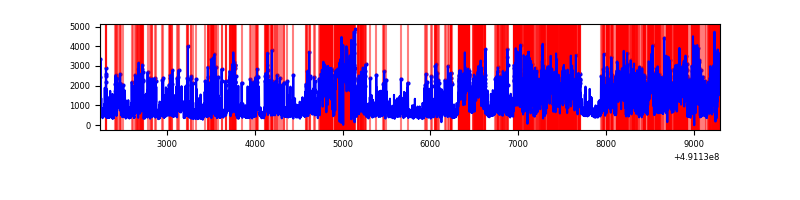 |
| D | 7065 | 7065 | 120 | 120 | 1.70% | 1.70% | 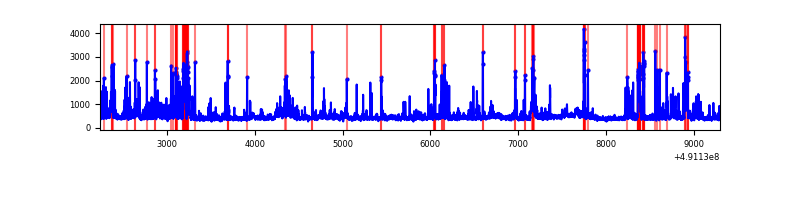 |
Top three noisy pixels from each quadrant. If the there are fewer than three noisy pixels in the level2.evt file, extra rows are filled as -1
| Pixel properties | Quadrant properties | ||||||
|---|---|---|---|---|---|---|---|
| Quadrant | DetID | PixID | Counts | Sigma | Mean | Median | Sigma |
| A | 9 | 191 | 16368706 | 259183.64 | 244 | 238 | 63.2 |
| A | 0 | 8 | 321945 | 5094.01 | 244 | 238 | 63.2 |
| A | 12 | 80 | 48523 | 764.56 | 244 | 238 | 63.2 |
| B | 10 | 254 | 4642893 | 34403.85 | 627 | 604 | 134.9 |
| B | 2 | 249 | 2314689 | 17149.61 | 627 | 604 | 134.9 |
| B | 0 | 213 | 249876 | 1847.35 | 627 | 604 | 134.9 |
| C | 15 | 224 | 2104020 | 12200.51 | 627 | 622 | 172.4 |
| C | 15 | 157 | 2093723 | 12140.78 | 627 | 622 | 172.4 |
| C | 9 | 38 | 616452 | 3572.05 | 627 | 622 | 172.4 |
| D | 12 | 3 | 466258 | 2344.48 | 696 | 665 | 198.6 |
| D | 3 | 12 | 231996 | 1164.86 | 696 | 665 | 198.6 |
| D | 8 | 176 | 144049 | 722.0 | 696 | 665 | 198.6 |
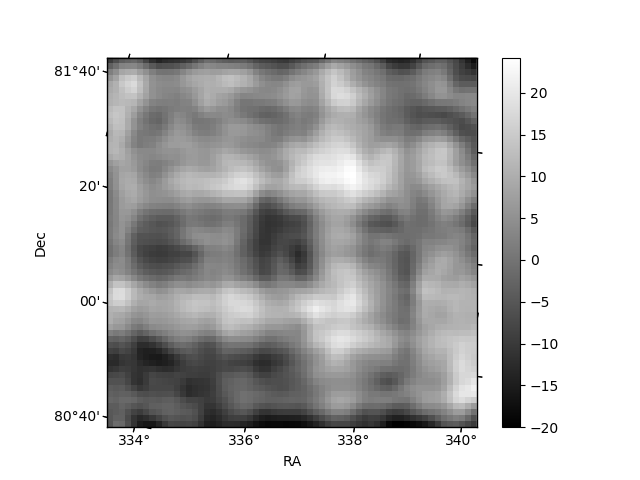
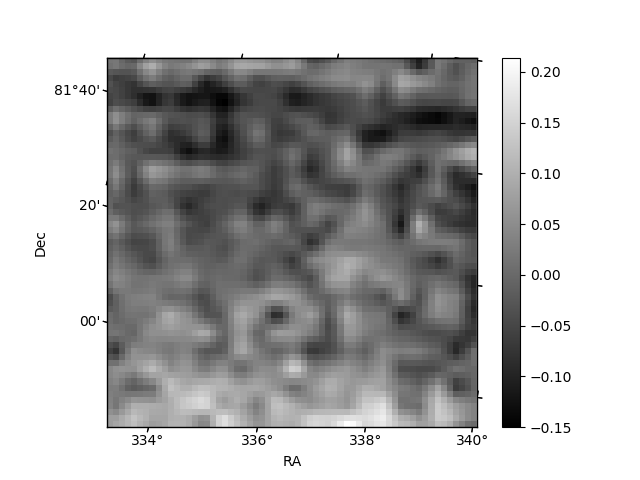
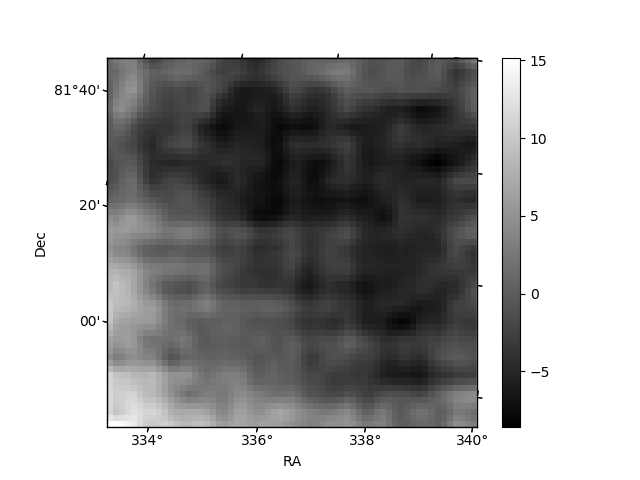
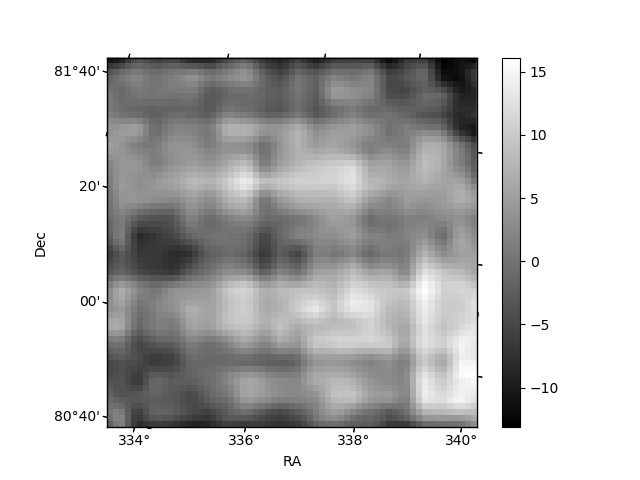
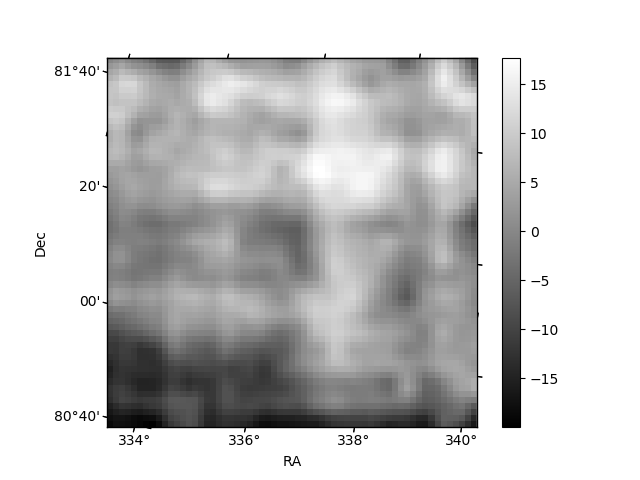
Histogram calculated using DETX and DETY for each event in the final _common_clean file
| Quadrant A | 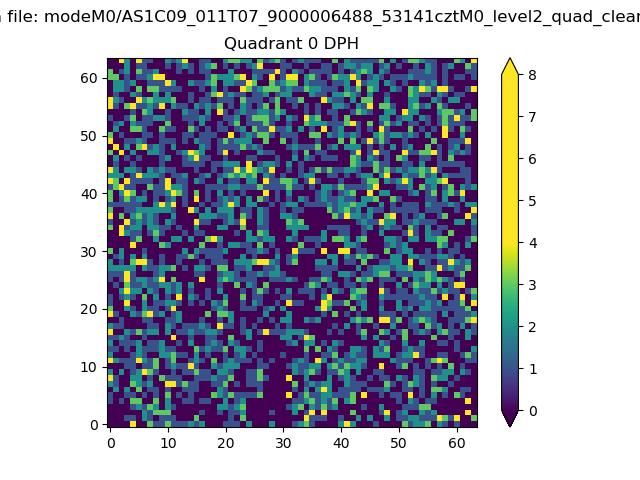 |
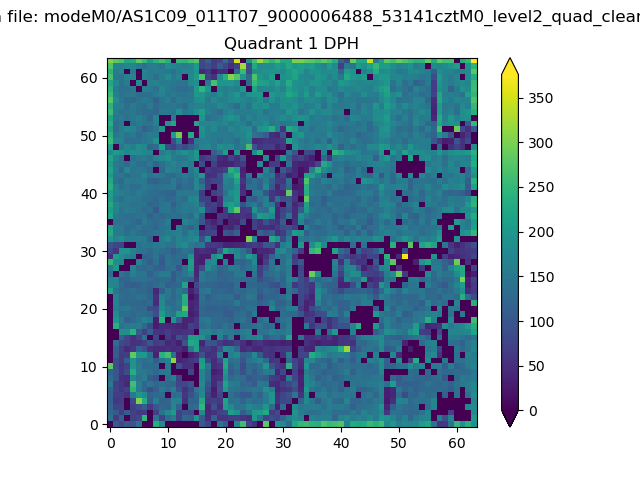 |
Quadrant B |
|---|---|---|---|
| Quadrant D | 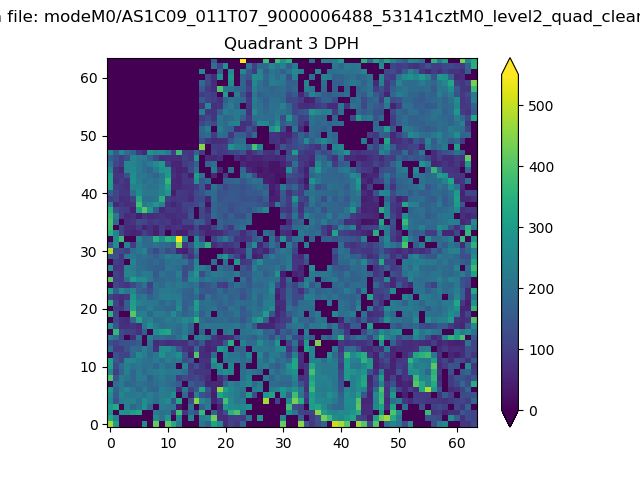 |
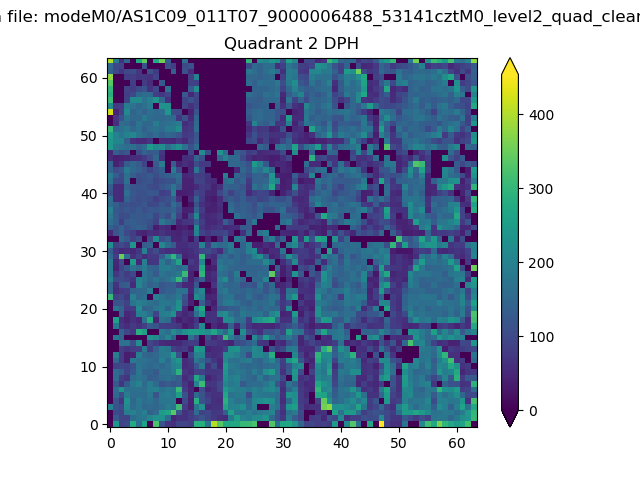 |
Quadrant C |
| Plot type | Count rate plots | Images |
|---|---|---|
| Comparison with Poisson distribution Blue bars denote a histogram of data divided into 1 sec bins. Red curve is a Poisson curve with rate = median count rate of data. |
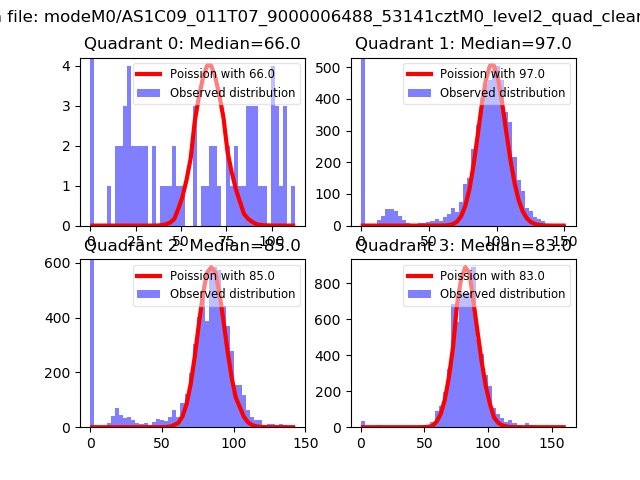 |
 |
| Quadrant-wise count rates Data is divided into 100 sec bins |
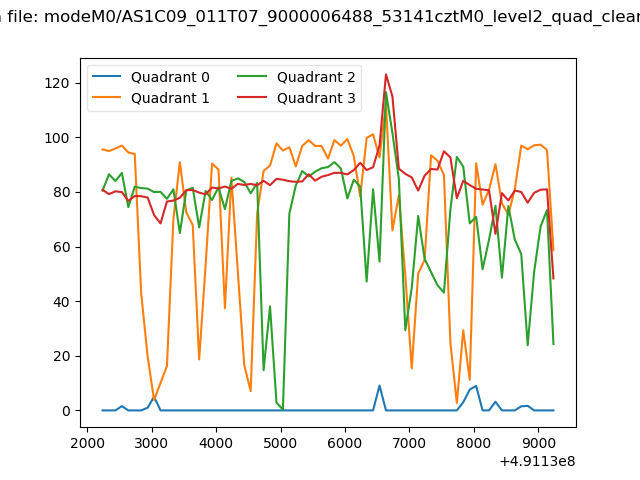 |
|
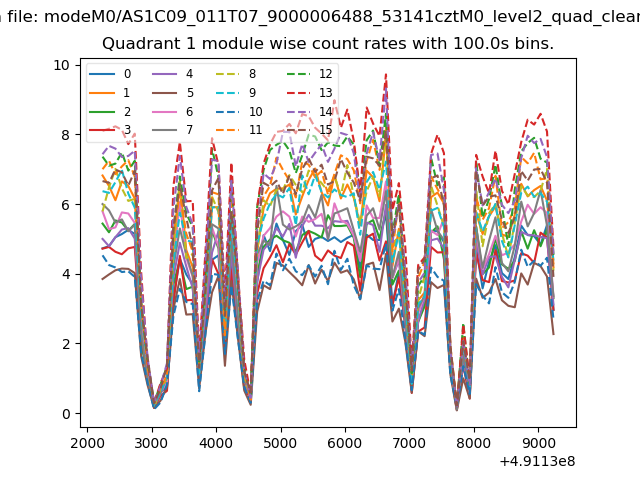
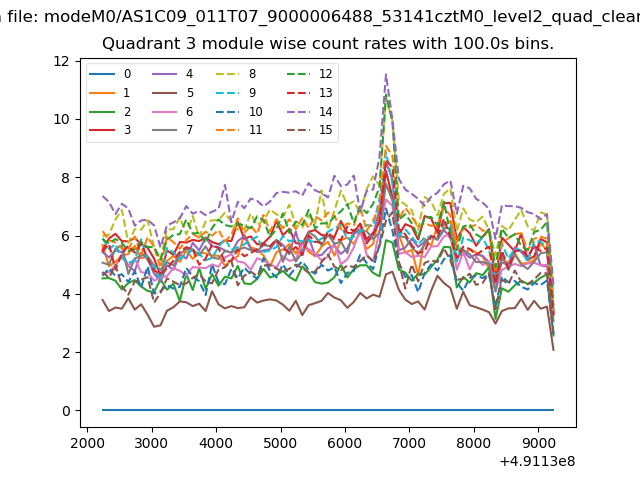
| Module-wise count rates for Quadrant A Data is divided into 100 sec bins |
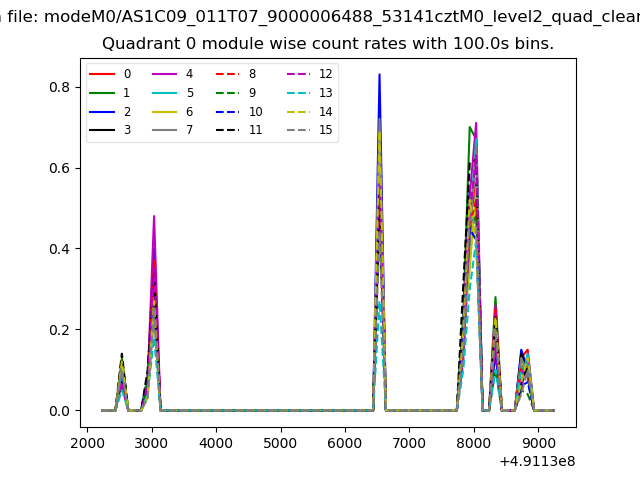 |
 |
| Module-wise count rates for Quadrant B Data is divided into 100 sec bins |
 |
 |
| Module-wise count rates for Quadrant C Data is divided into 100 sec bins |
 |
 |
| Module-wise count rates for Quadrant D Data is divided into 100 sec bins |
 |
 |
| Parameter | Plot |
|---|---|
| CZT HV Monitor | 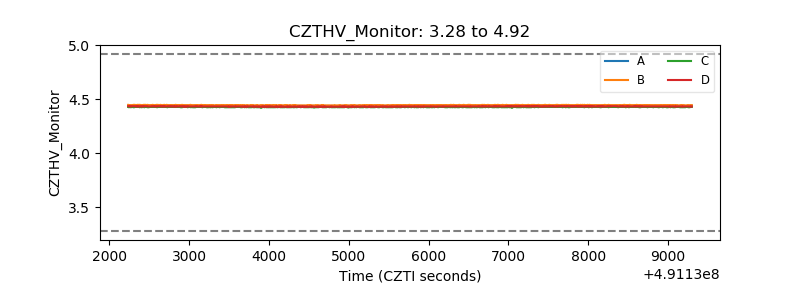 |
| D_VDD | 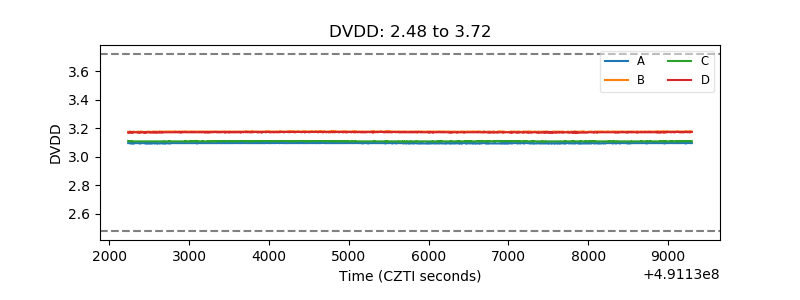 |
| Temperature 1 |  |
| Veto HV Monitor | 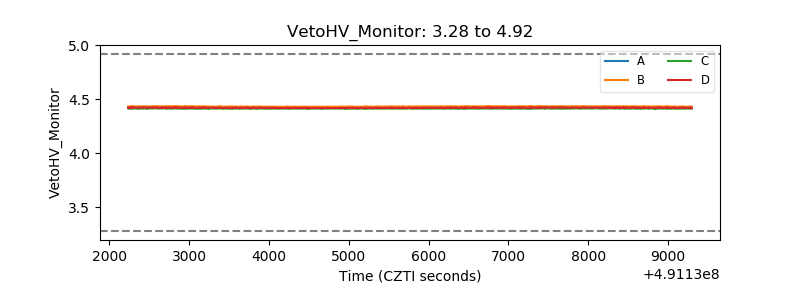 |
| Veto LLD | 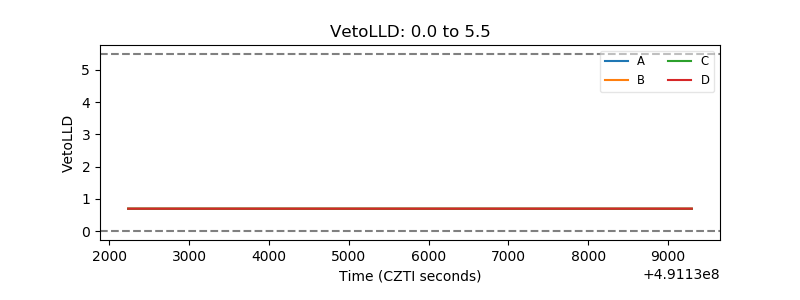 |
| Alpha Counter | 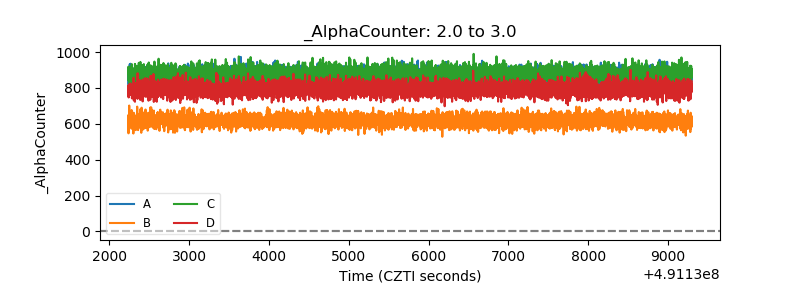 |
| _CPM_Rate | 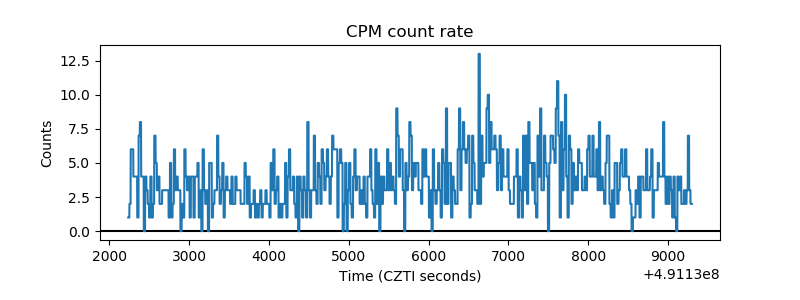 |
| CZT Counter | 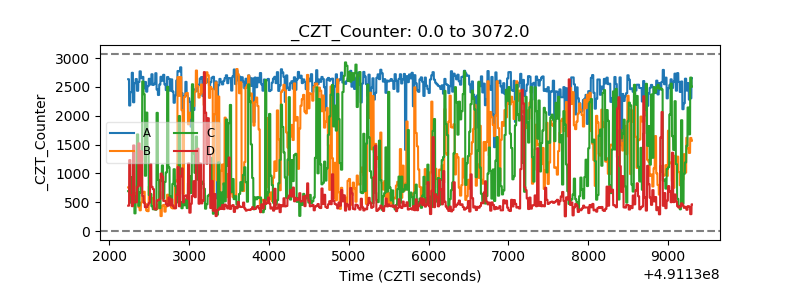 |
| +2.5 Volts monitor |  |
| +5 Volts monitor |  |
| _ROLL_ROT | 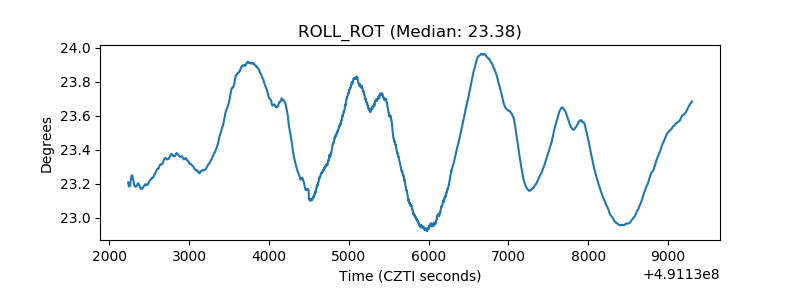 |
| _Roll_DEC | 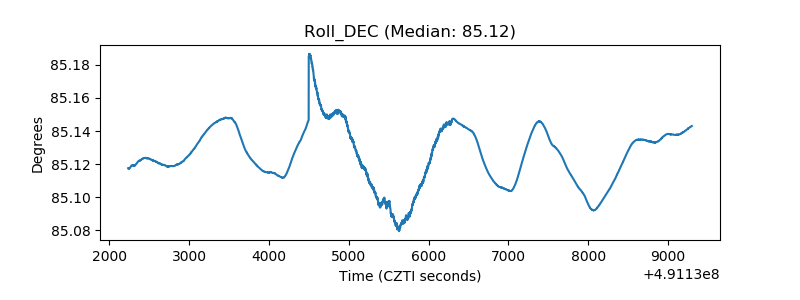 |
| _Roll_RA | 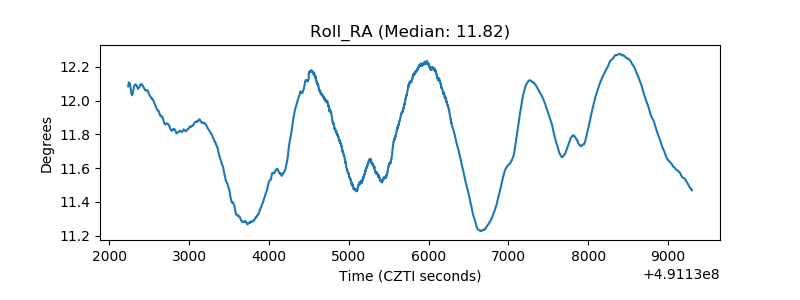 |
| Veto Counter | 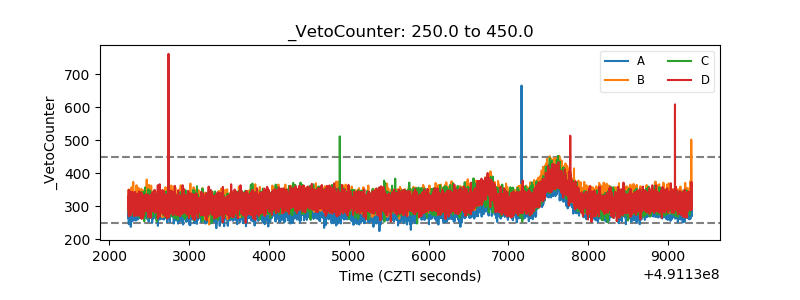 |