| Param | Original file | Final file |
|---|---|---|
| Filename | modeM0/AS1C09_011T07_9000006488_53142cztM0_level2.fits | modeM0/AS1C09_011T07_9000006488_53142cztM0_level2_quad_clean.evt |
| Size (bytes) | 1,243,647,360 | 71,642,880 |
| Size | 1.2 GB | 68.3 MB |
| Events in quadrant A | 17,973,097 | 32,626 |
| Events in quadrant B | 12,068,485 | 518,536 |
| Events in quadrant C | 11,054,907 | 465,660 |
| Events in quadrant D | 4,361,799 | 630,687 |
| Mode SS | |||
|---|---|---|---|
| Quadrant | BADHDUFLAG | Total packets | Discarded packets |
| A | 0 | 150 | 0 |
| B | 0 | 150 | 0 |
| C | 0 | 150 | 0 |
| D | 0 | 150 | 0 |
| Mode M0 | |||
|---|---|---|---|
| Quadrant | BADHDUFLAG | Total packets | Discarded packets |
| A | 0 | 58419 | 7 |
| B | 0 | 41116 | 0 |
| C | 0 | 38061 | 0 |
| D | 0 | 18240 | 0 |
| Quadrant | Total seconds | Saturated seconds | Saturation percentage |
|---|---|---|---|
| A | 7407 | 7151 | 96.543810% |
| B | 7520 | 2771 | 36.848404% |
| C | 7521 | 2579 | 34.290653% |
| D | 7521 | 112 | 1.489164% |
Noise dominated data is calculated using 1-second bins in cleaned event files. If a bin has >2000 counts, and if more than 50% of those come from <1% of pixels, then it is considered to be noise-dominated and hence unusable.
| Quadrant | # 1 sec bins | Bins with >0 counts | Bins with >2000 counts | High rate bins dominated by noise | Noise dominated (total time) | Noise dominated (detector-on time) | Marked lightcurve |
|---|---|---|---|---|---|---|---|
| A | 7520 | 7407 | 5970 | 5970 | 79.39% | 80.60% | 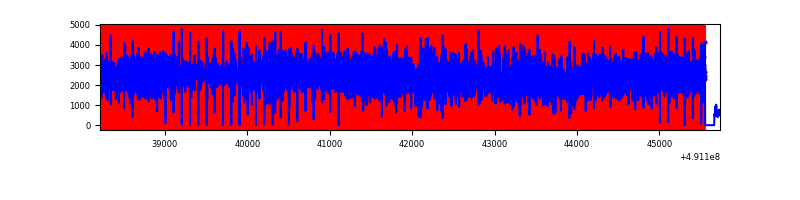 |
| B | 7520 | 7520 | 2313 | 2313 | 30.76% | 30.76% | 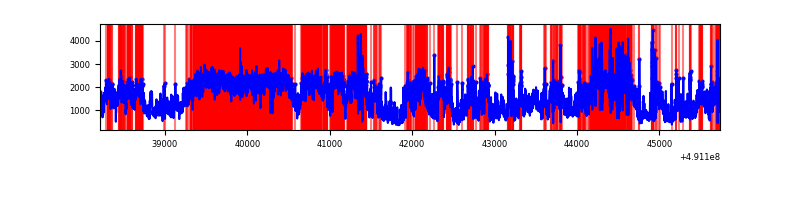 |
| C | 7521 | 7520 | 2052 | 2052 | 27.28% | 27.29% | 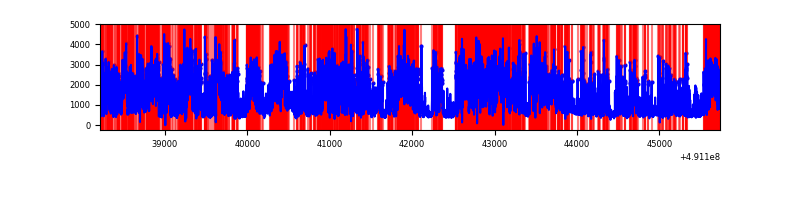 |
| D | 7521 | 7521 | 87 | 87 | 1.16% | 1.16% | 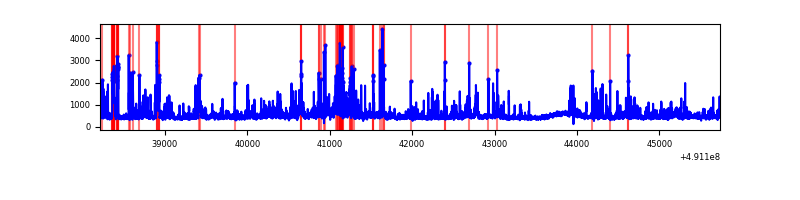 |
Top three noisy pixels from each quadrant. If the there are fewer than three noisy pixels in the level2.evt file, extra rows are filled as -1
| Pixel properties | Quadrant properties | ||||||
|---|---|---|---|---|---|---|---|
| Quadrant | DetID | PixID | Counts | Sigma | Mean | Median | Sigma |
| A | 9 | 191 | 16179639 | 198731.34 | 318 | 310 | 81.4 |
| A | 0 | 8 | 163528 | 2004.81 | 318 | 310 | 81.4 |
| A | 10 | 253 | 96268 | 1178.66 | 318 | 310 | 81.4 |
| B | 10 | 254 | 7901454 | 52000.76 | 709 | 685 | 151.9 |
| B | 2 | 249 | 716568 | 4711.75 | 709 | 685 | 151.9 |
| B | 0 | 213 | 154723 | 1013.84 | 709 | 685 | 151.9 |
| C | 15 | 157 | 4329651 | 23844.45 | 652 | 647 | 181.6 |
| C | 15 | 224 | 1524100 | 8391.28 | 652 | 647 | 181.6 |
| C | 15 | 147 | 536904 | 2953.74 | 652 | 647 | 181.6 |
| D | 12 | 3 | 416293 | 1912.52 | 756 | 722 | 217.3 |
| D | 2 | 62 | 264209 | 1212.61 | 756 | 722 | 217.3 |
| D | 3 | 12 | 158919 | 728.05 | 756 | 722 | 217.3 |
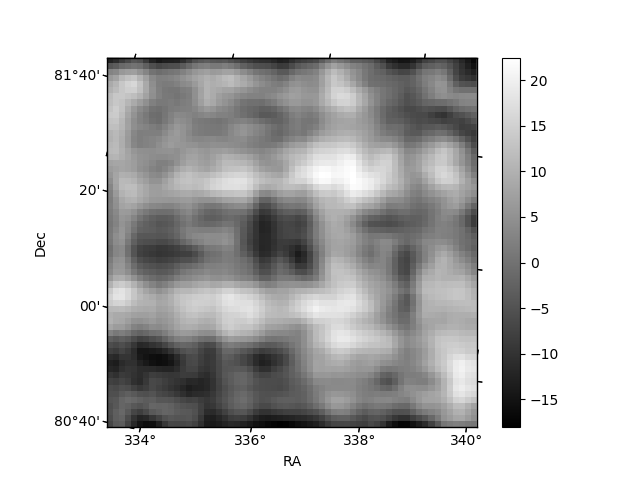
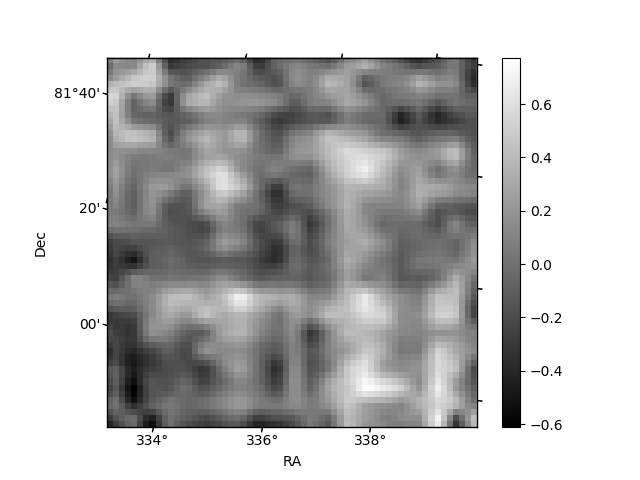
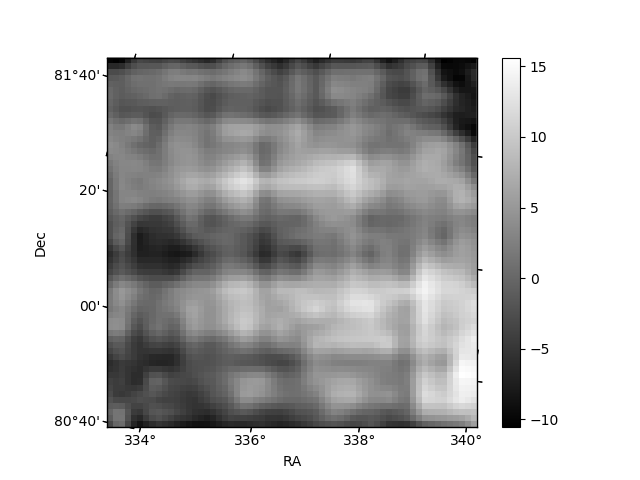
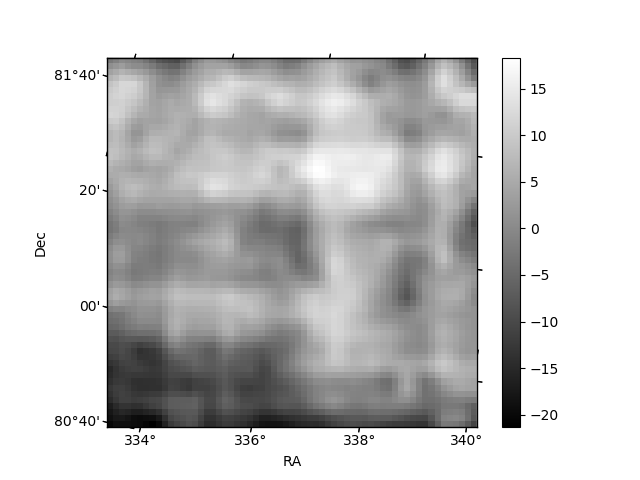
Histogram calculated using DETX and DETY for each event in the final _common_clean file
| Quadrant A | 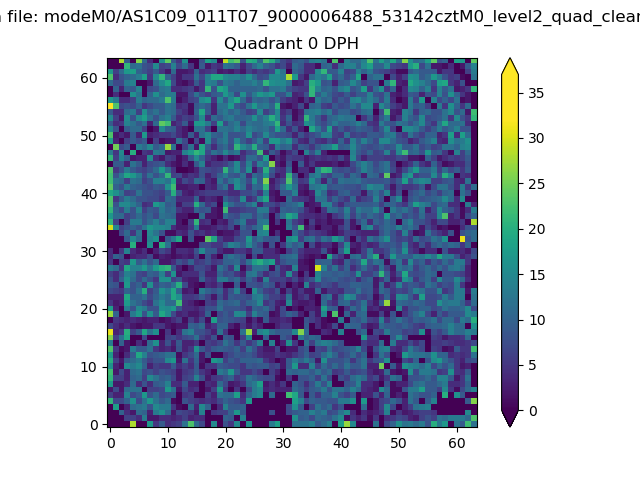 |
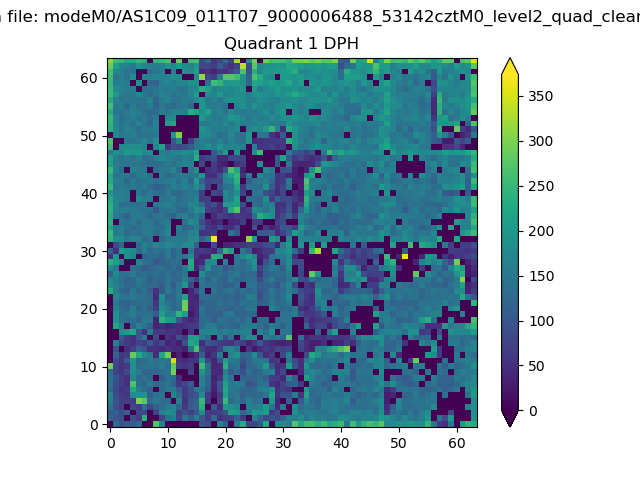 |
Quadrant B |
|---|---|---|---|
| Quadrant D | 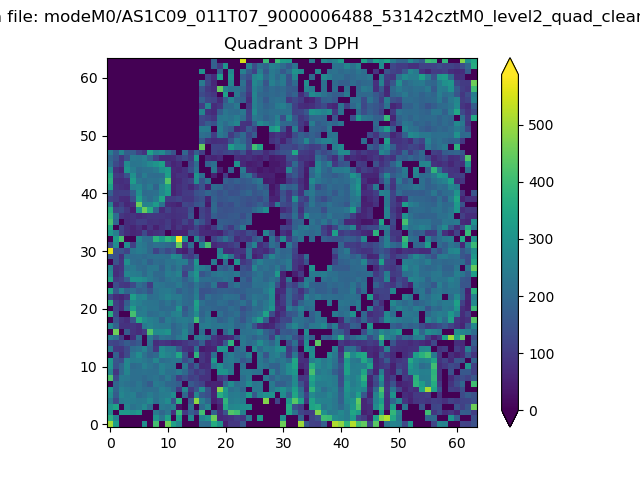 |
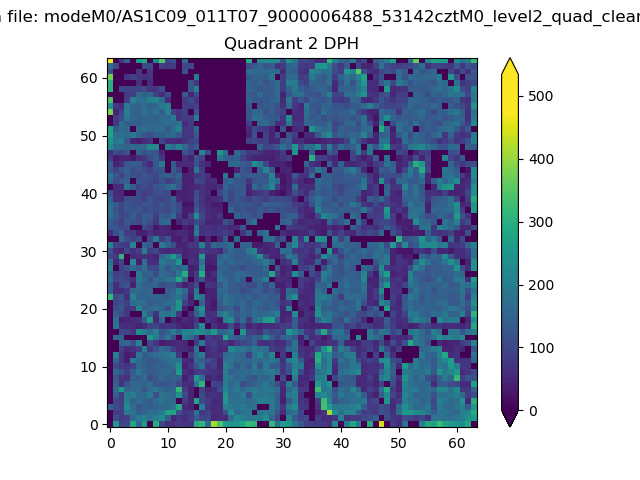 |
Quadrant C |
| Plot type | Count rate plots | Images |
|---|---|---|
| Comparison with Poisson distribution Blue bars denote a histogram of data divided into 1 sec bins. Red curve is a Poisson curve with rate = median count rate of data. |
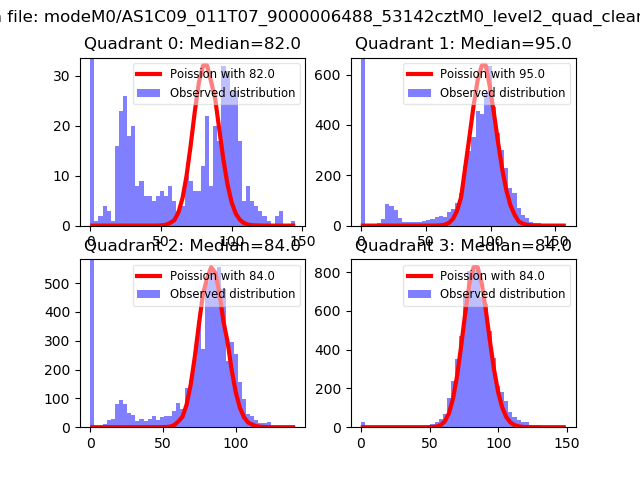 |
 |
| Quadrant-wise count rates Data is divided into 100 sec bins |
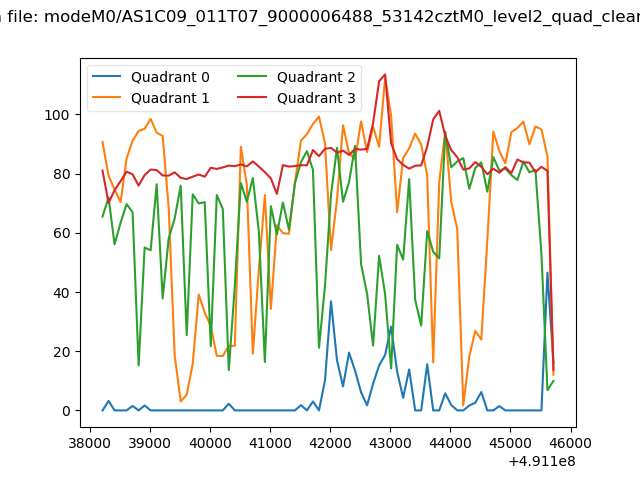 |
|
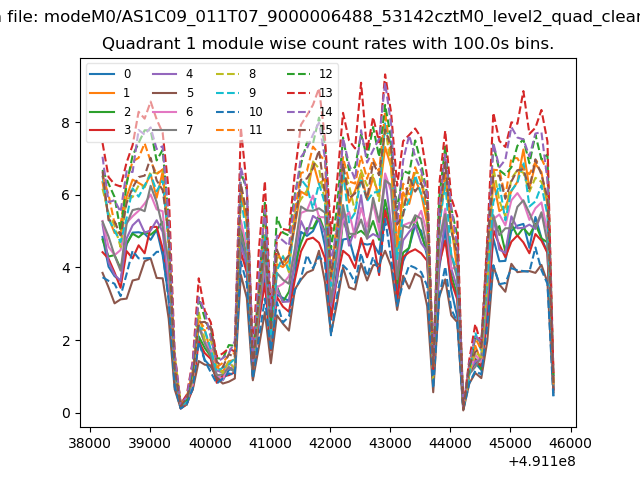
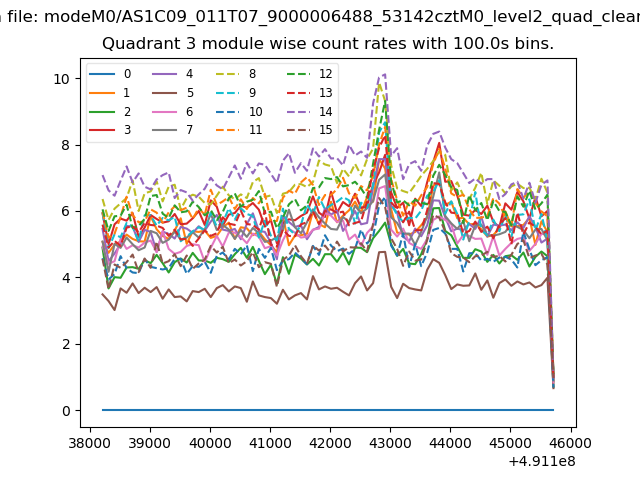
| Module-wise count rates for Quadrant A Data is divided into 100 sec bins |
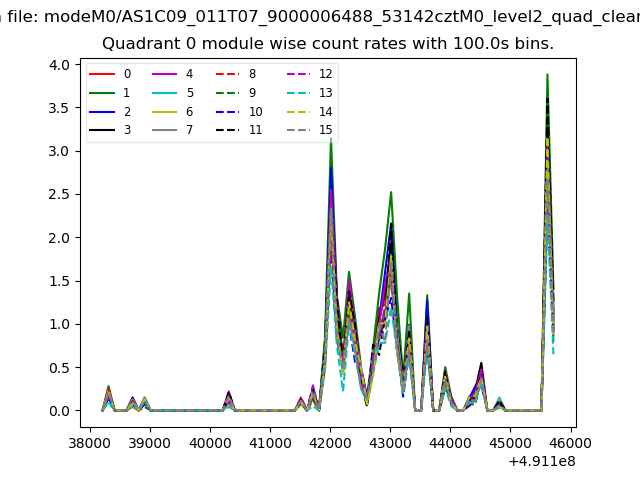 |
 |
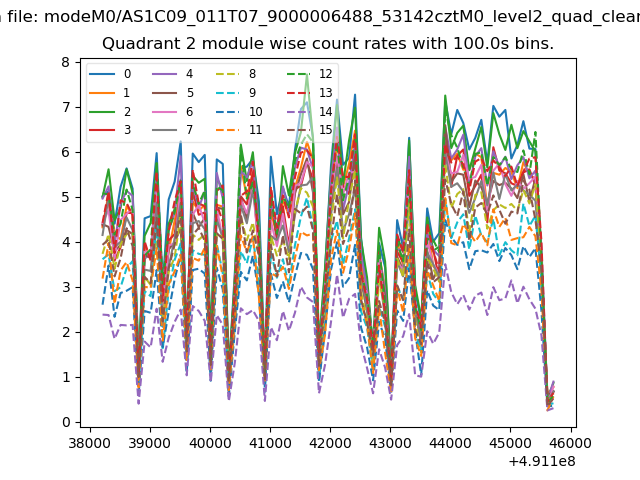
| Module-wise count rates for Quadrant B Data is divided into 100 sec bins |
 |
 |
| Module-wise count rates for Quadrant C Data is divided into 100 sec bins |
 |
 |
| Module-wise count rates for Quadrant D Data is divided into 100 sec bins |
 |
 |
| Parameter | Plot |
|---|---|
| CZT HV Monitor | 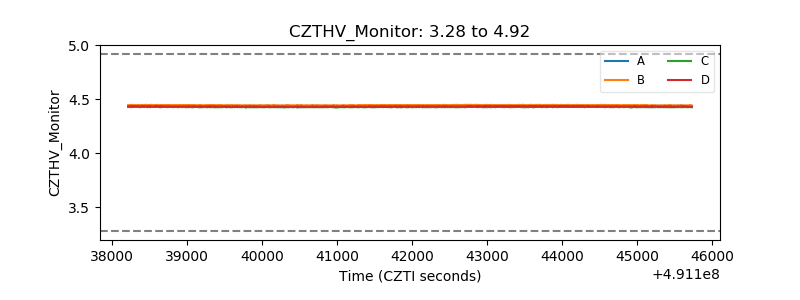 |
| D_VDD | 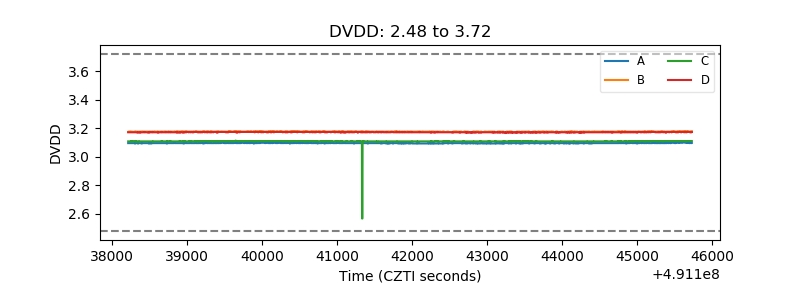 |
| Temperature 1 | 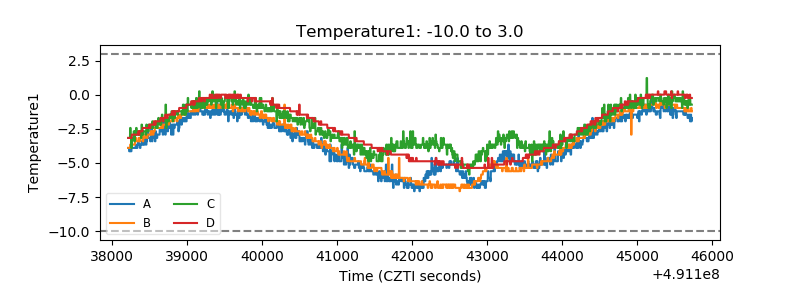 |
| Veto HV Monitor | 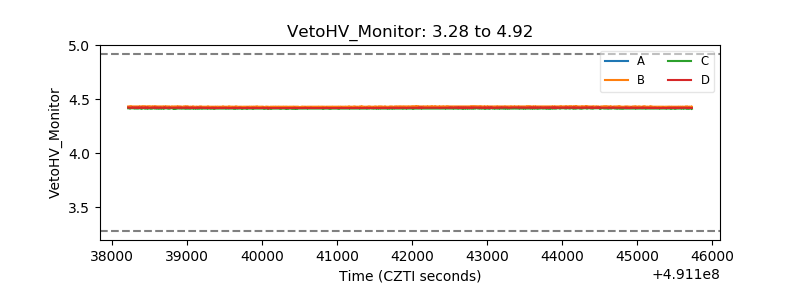 |
| Veto LLD | 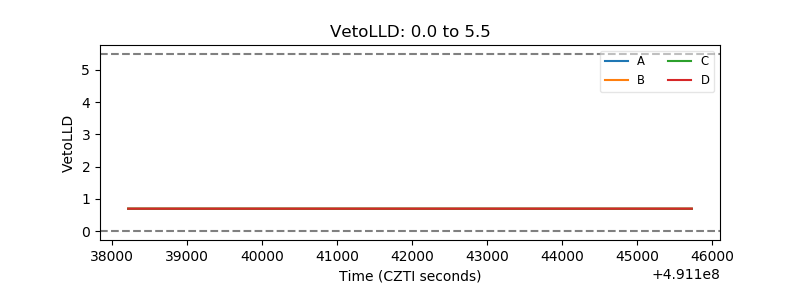 |
| Alpha Counter | 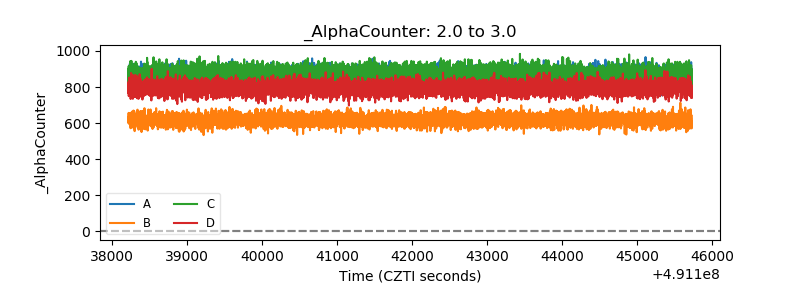 |
| _CPM_Rate | 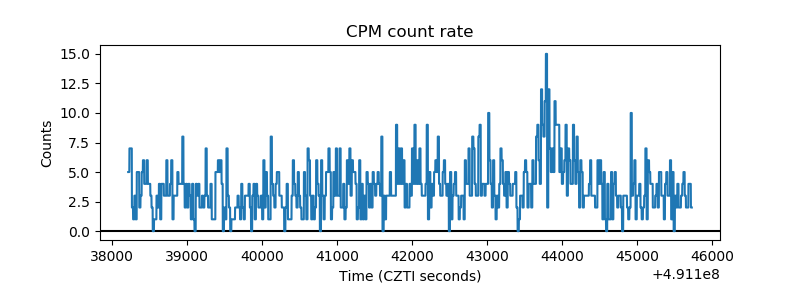 |
| CZT Counter | 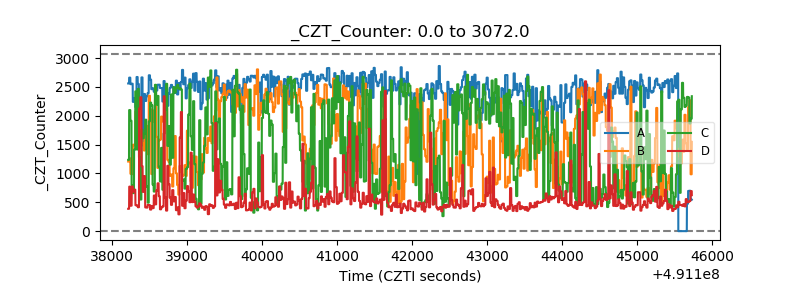 |
| +2.5 Volts monitor | 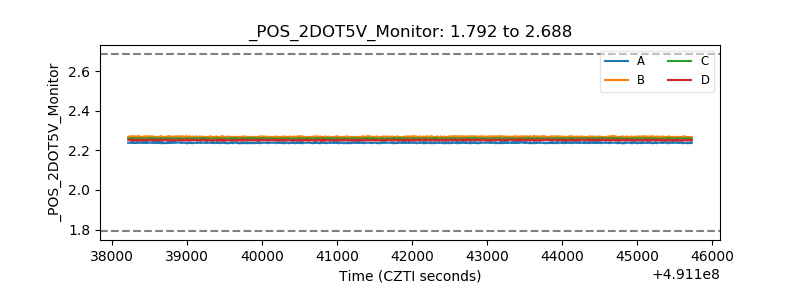 |
| +5 Volts monitor |  |
| _ROLL_ROT | 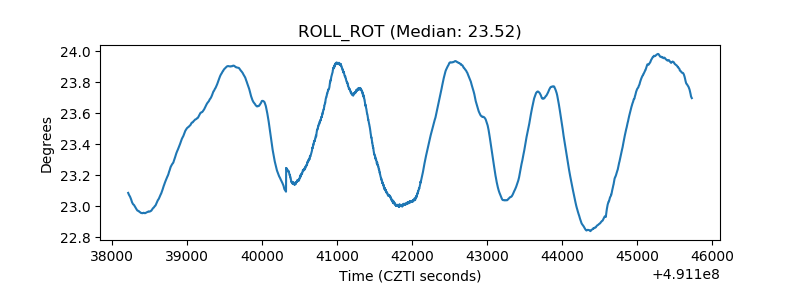 |
| _Roll_DEC | 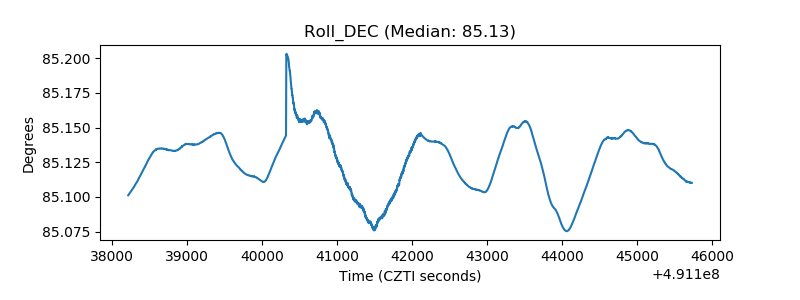 |
| _Roll_RA | 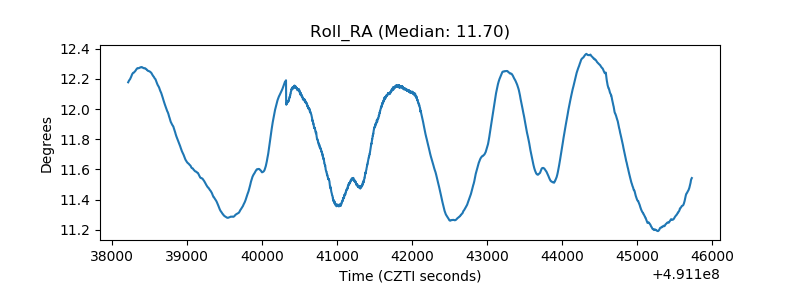 |
| Veto Counter | 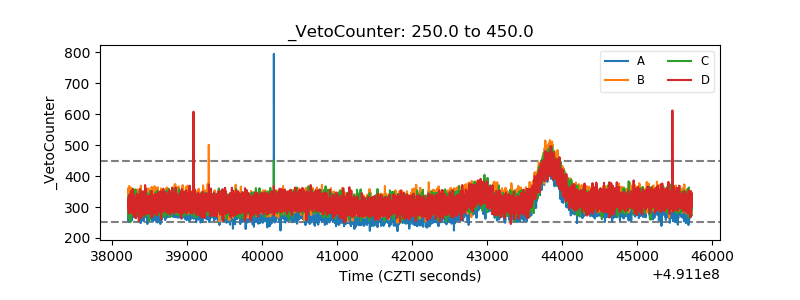 |