| Param | Original file | Final file |
|---|---|---|
| Filename | modeM0/AS1C09_011T07_9000006488_53145cztM0_level2.fits | modeM0/AS1C09_011T07_9000006488_53145cztM0_level2_quad_clean.evt |
| Size (bytes) | 1,732,881,600 | 231,655,680 |
| Size | 1.6 GB | 220.9 MB |
| Events in quadrant A | 11,852,674 | 1,541,152 |
| Events in quadrant B | 11,709,392 | 1,759,048 |
| Events in quadrant C | 21,377,936 | 1,239,191 |
| Events in quadrant D | 17,818,549 | 1,234,787 |
| Mode SS | |||
|---|---|---|---|
| Quadrant | BADHDUFLAG | Total packets | Discarded packets |
| A | 0 | 366 | 0 |
| B | 0 | 366 | 0 |
| C | 0 | 366 | 0 |
| D | 0 | 366 | 0 |
| Mode M9 | |||
|---|---|---|---|
| Quadrant | BADHDUFLAG | Total packets | Discarded packets |
| A | 0 | 16 | 0 |
| B | 0 | 16 | 0 |
| C | 0 | 16 | 0 |
| D | 0 | 16 | 0 |
| Mode M0 | |||
|---|---|---|---|
| Quadrant | BADHDUFLAG | Total packets | Discarded packets |
| A | 0 | 48107 | 10 |
| B | 0 | 47328 | 3 |
| C | 0 | 76110 | 3 |
| D | 0 | 65549 | 4 |
| Quadrant | Total seconds | Saturated seconds | Saturation percentage |
|---|---|---|---|
| A | 17884 | 1495 | 8.359427% |
| B | 17997 | 398 | 2.211480% |
| C | 17997 | 4038 | 22.437073% |
| D | 17997 | 3007 | 16.708340% |
Noise dominated data is calculated using 1-second bins in cleaned event files. If a bin has >2000 counts, and if more than 50% of those come from <1% of pixels, then it is considered to be noise-dominated and hence unusable.
| Quadrant | # 1 sec bins | Bins with >0 counts | Bins with >2000 counts | High rate bins dominated by noise | Noise dominated (total time) | Noise dominated (detector-on time) | Marked lightcurve |
|---|---|---|---|---|---|---|---|
| A | 19637 | 17887 | 1162 | 1162 | 5.92% | 6.50% | 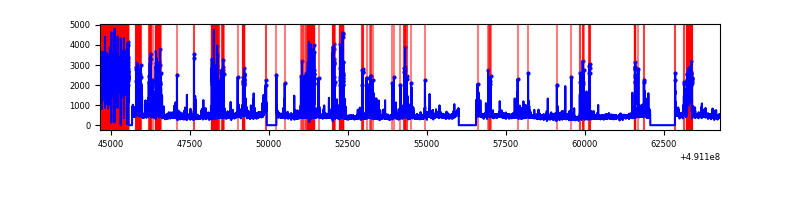 |
| B | 19637 | 18000 | 209 | 209 | 1.06% | 1.16% | 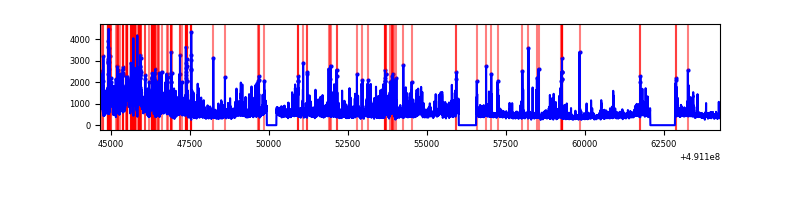 |
| C | 19637 | 17999 | 3131 | 3131 | 15.94% | 17.40% |  |
| D | 19637 | 18000 | 2530 | 2530 | 12.88% | 14.06% | 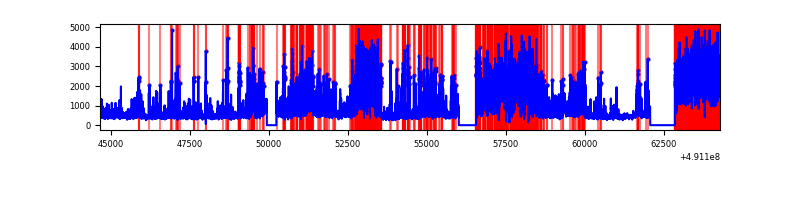 |
Top three noisy pixels from each quadrant. If the there are fewer than three noisy pixels in the level2.evt file, extra rows are filled as -1
| Pixel properties | Quadrant properties | ||||||
|---|---|---|---|---|---|---|---|
| Quadrant | DetID | PixID | Counts | Sigma | Mean | Median | Sigma |
| A | 9 | 191 | 2070061 | 4678.9 | 1785 | 1743 | 442.1 |
| A | 0 | 8 | 1098779 | 2481.69 | 1785 | 1743 | 442.1 |
| A | 7 | 206 | 352946 | 794.48 | 1785 | 1743 | 442.1 |
| B | 10 | 254 | 1784971 | 4618.07 | 1841 | 1775 | 386.1 |
| B | 4 | 81 | 802021 | 2072.45 | 1841 | 1775 | 386.1 |
| B | 2 | 249 | 484975 | 1251.38 | 1841 | 1775 | 386.1 |
| C | 15 | 224 | 4563477 | 9868.85 | 1671 | 1651 | 462.2 |
| C | 15 | 157 | 3334893 | 7210.99 | 1671 | 1651 | 462.2 |
| C | 1 | 241 | 1607797 | 3474.67 | 1671 | 1651 | 462.2 |
| D | 15 | 125 | 7083496 | 14158.97 | 1694 | 1614 | 500.2 |
| D | 3 | 12 | 550011 | 1096.42 | 1694 | 1614 | 500.2 |
| D | 2 | 153 | 451887 | 900.24 | 1694 | 1614 | 500.2 |
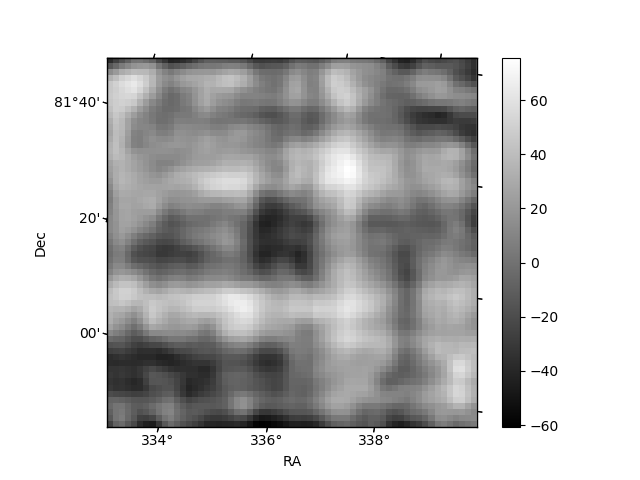
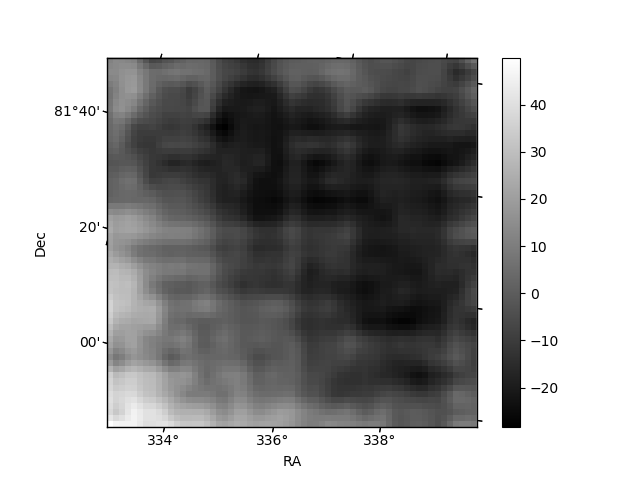
Histogram calculated using DETX and DETY for each event in the final _common_clean file
| Quadrant A | 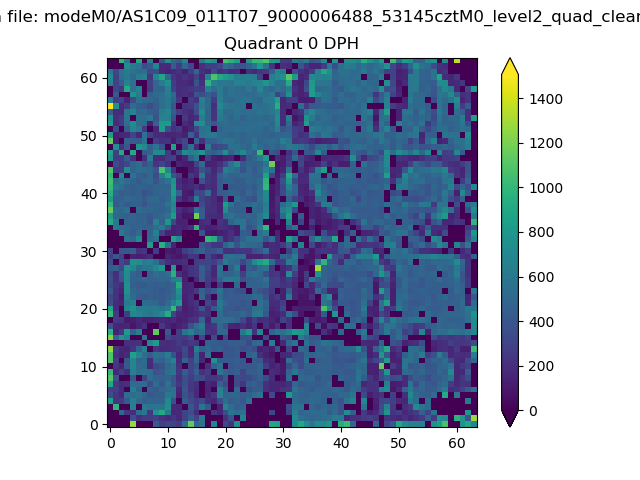 |
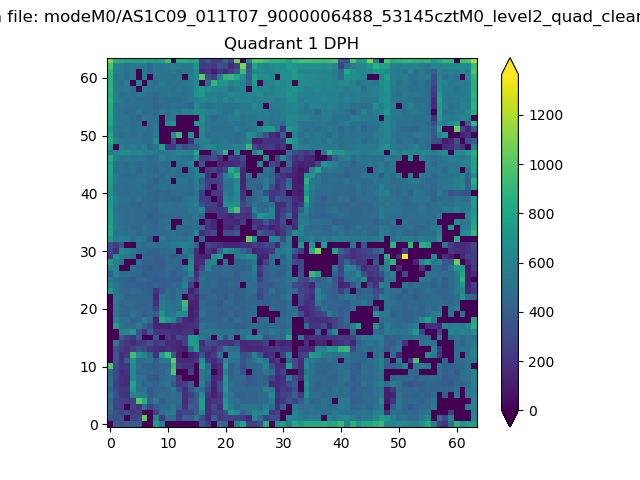 |
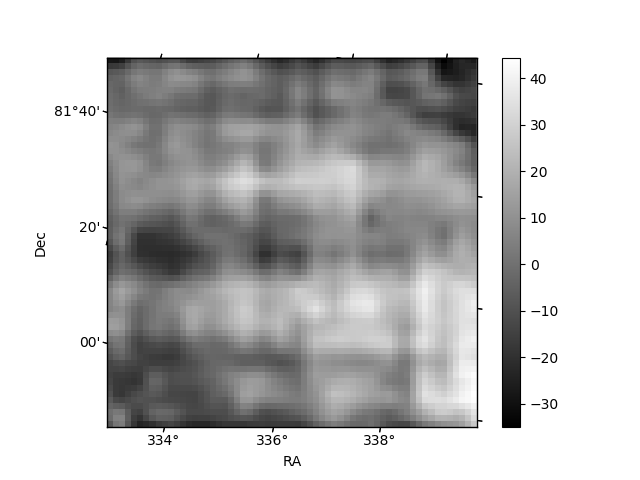
Quadrant B |
|---|---|---|---|
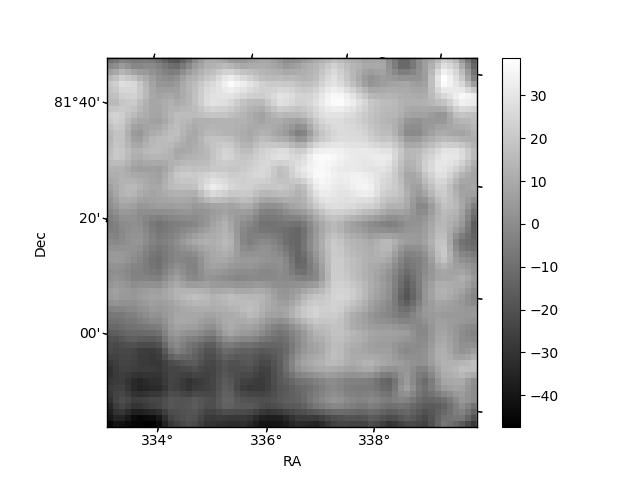
| Quadrant D | 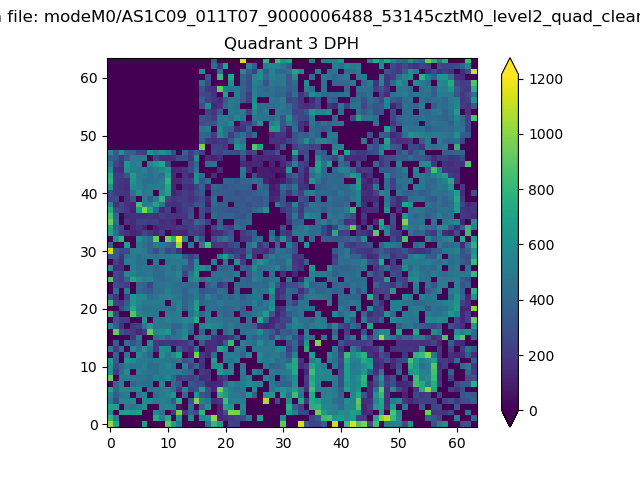 |
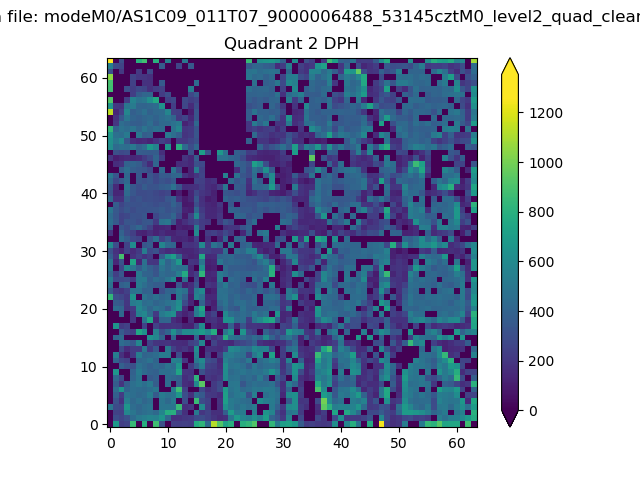 |
Quadrant C |
| Plot type | Count rate plots | Images |
|---|---|---|
| Comparison with Poisson distribution Blue bars denote a histogram of data divided into 1 sec bins. Red curve is a Poisson curve with rate = median count rate of data. |
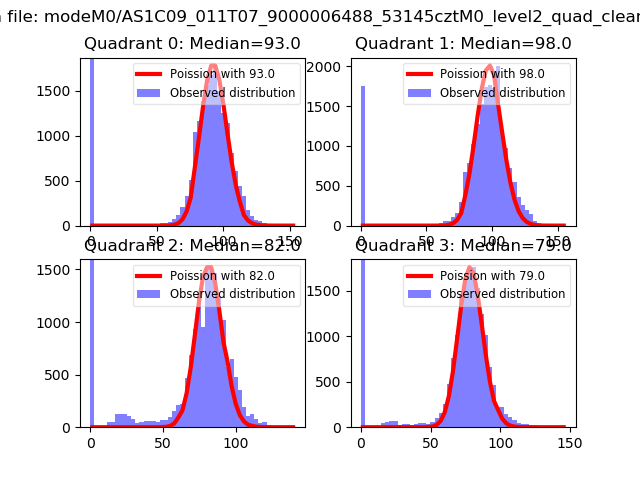 |
 |
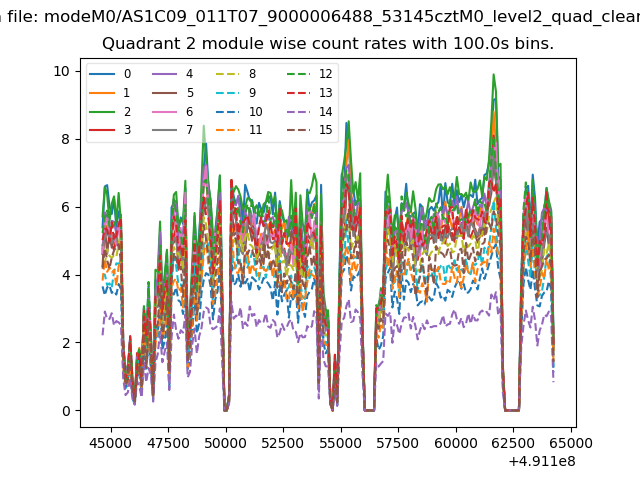
| Quadrant-wise count rates Data is divided into 100 sec bins |
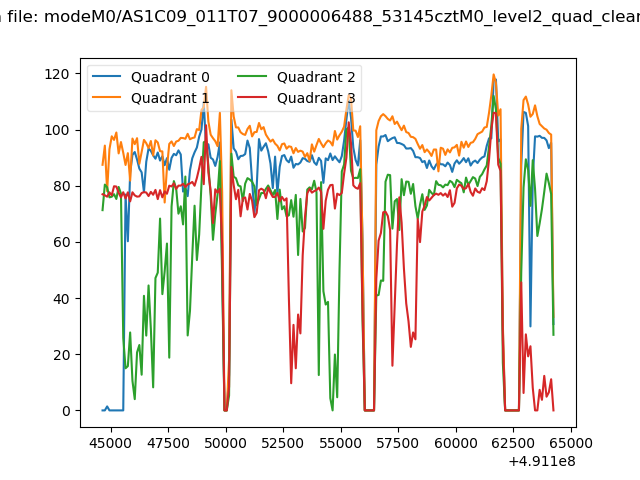 |
|
| Module-wise count rates for Quadrant A Data is divided into 100 sec bins |
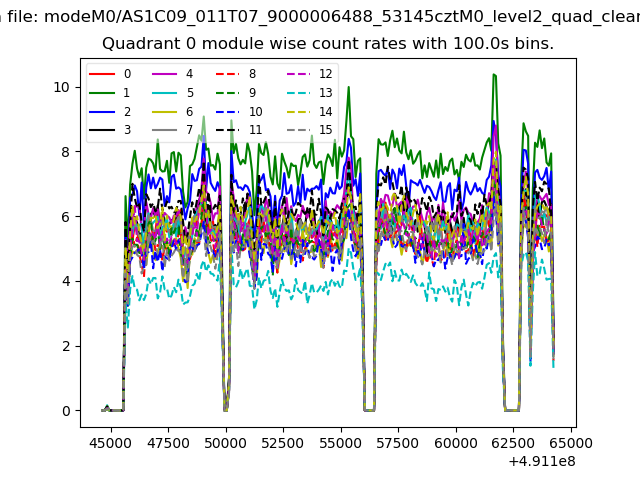 |
 |
| Module-wise count rates for Quadrant B Data is divided into 100 sec bins |
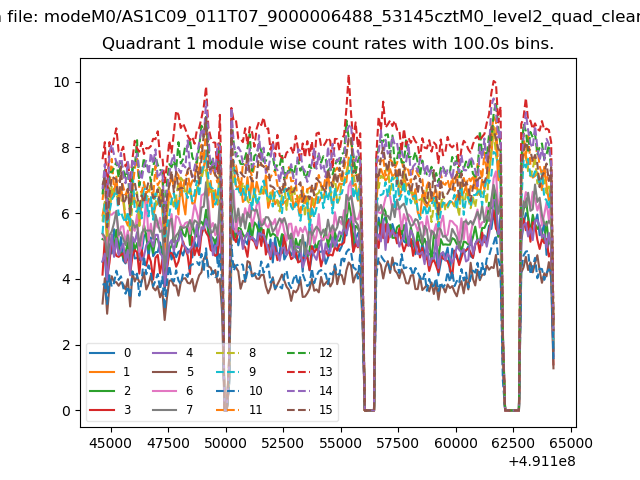 |
 |
| Module-wise count rates for Quadrant C Data is divided into 100 sec bins |
 |
 |
| Module-wise count rates for Quadrant D Data is divided into 100 sec bins |
 |
 |
| Parameter | Plot |
|---|---|
| CZT HV Monitor | 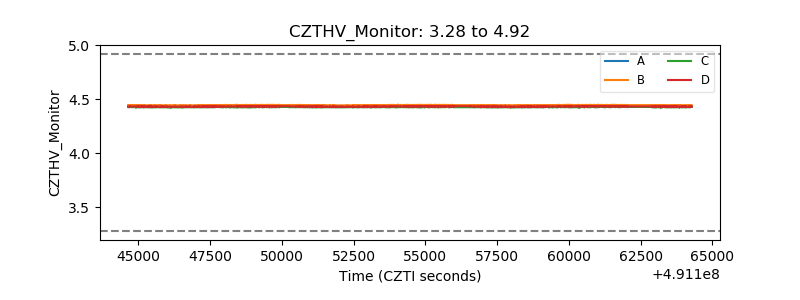 |
| D_VDD | 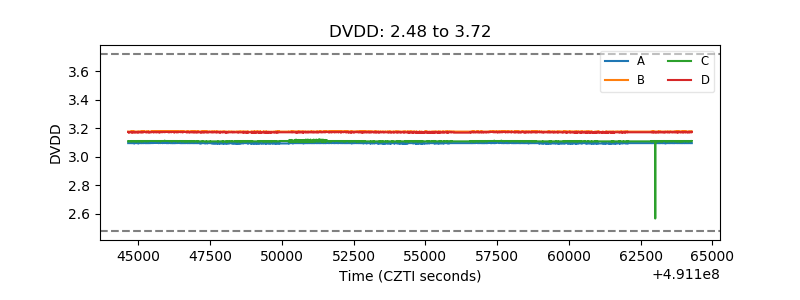 |
| Temperature 1 | 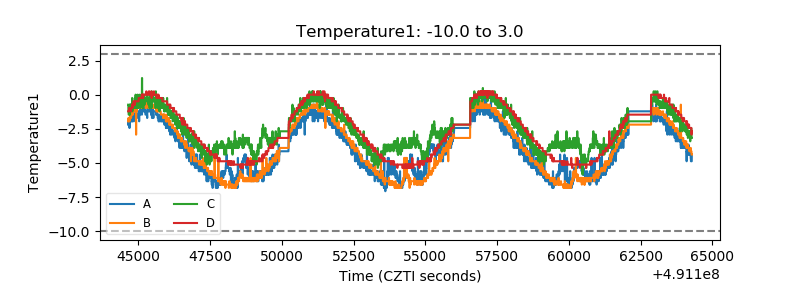 |
| Veto HV Monitor | 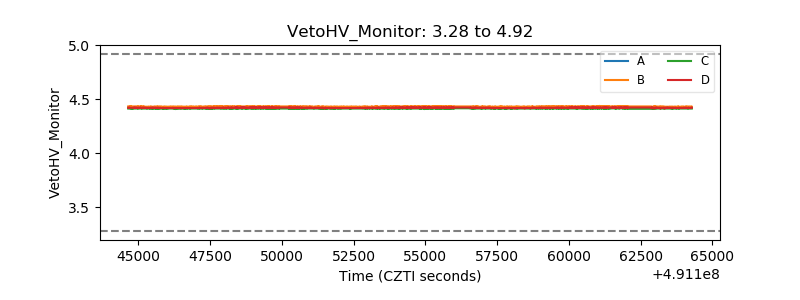 |
| Veto LLD | 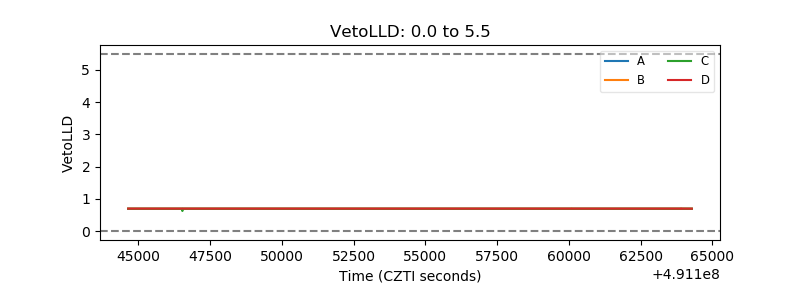 |
| Alpha Counter | 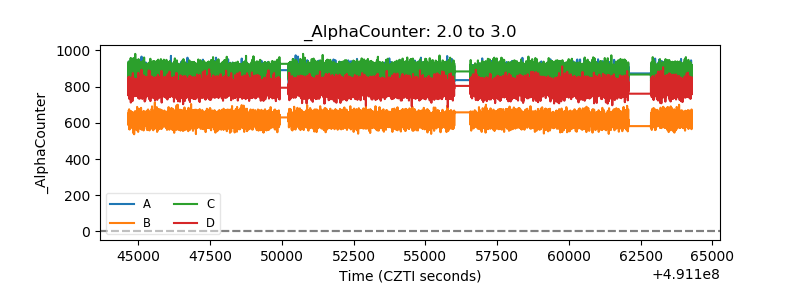 |
| _CPM_Rate | 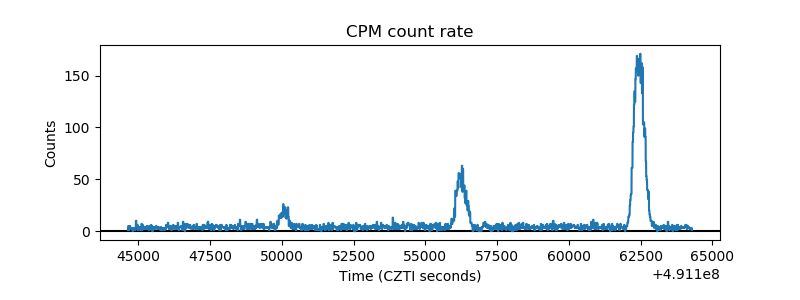 |
| CZT Counter | 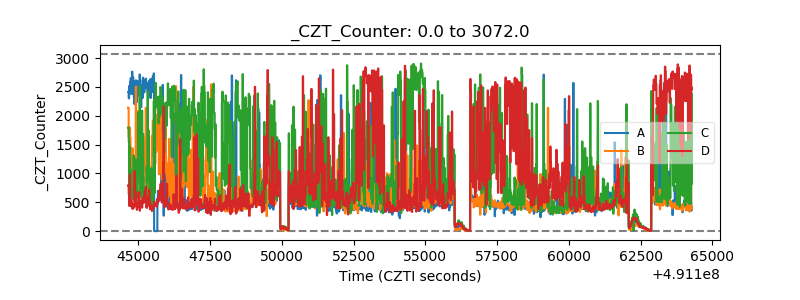 |
| +2.5 Volts monitor |  |
| +5 Volts monitor |  |
| _ROLL_ROT | 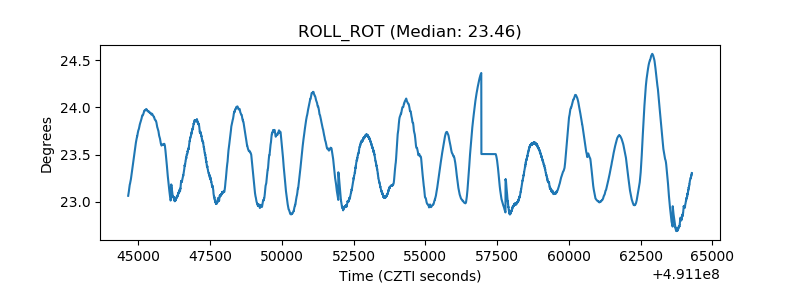 |
| _Roll_DEC | 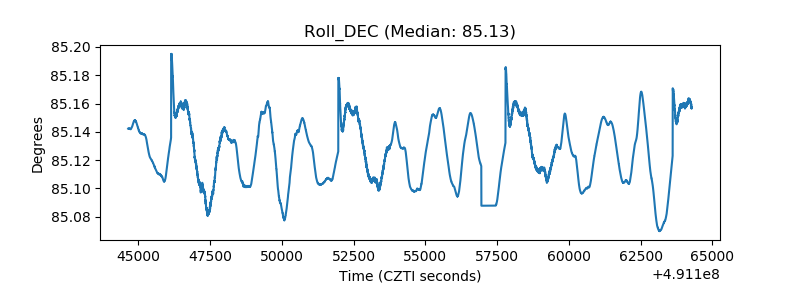 |
| _Roll_RA | 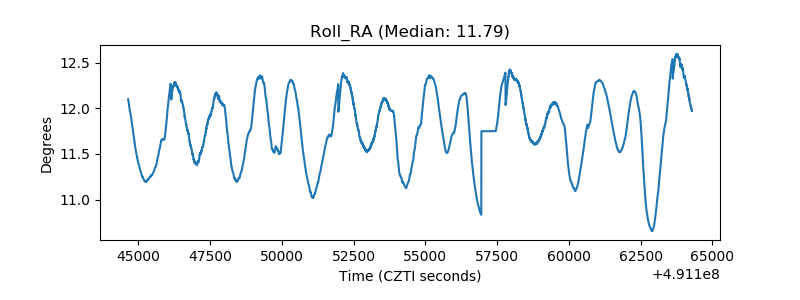 |
| Veto Counter | 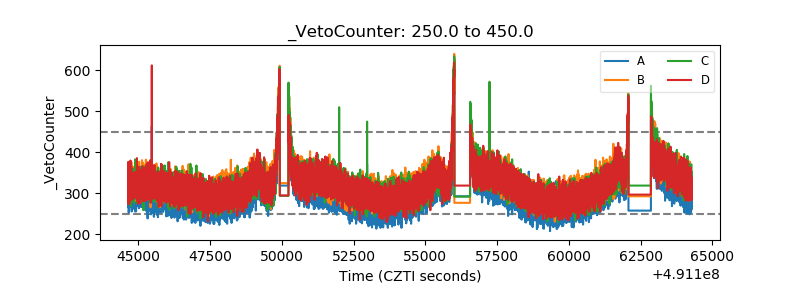 |