| Param | Original file | Final file |
|---|---|---|
| Filename | modeM0/AS1C09_011T07_9000006488_53149cztM0_level2.fits | modeM0/AS1C09_011T07_9000006488_53149cztM0_level2_quad_clean.evt |
| Size (bytes) | 525,185,280 | 90,953,280 |
| Size | 500.9 MB | 86.7 MB |
| Events in quadrant A | 4,412,129 | 588,320 |
| Events in quadrant B | 3,200,305 | 667,086 |
| Events in quadrant C | 7,146,363 | 492,546 |
| Events in quadrant D | 4,189,443 | 563,332 |
| Mode SS | |||
|---|---|---|---|
| Quadrant | BADHDUFLAG | Total packets | Discarded packets |
| A | 0 | 132 | 0 |
| B | 0 | 132 | 0 |
| C | 0 | 132 | 0 |
| D | 0 | 132 | 0 |
| Mode M9 | |||
|---|---|---|---|
| Quadrant | BADHDUFLAG | Total packets | Discarded packets |
| A | 0 | 22 | 0 |
| B | 0 | 22 | 0 |
| C | 0 | 22 | 0 |
| D | 0 | 22 | 0 |
| Mode M0 | |||
|---|---|---|---|
| Quadrant | BADHDUFLAG | Total packets | Discarded packets |
| A | 0 | 17668 | 2 |
| B | 0 | 14189 | 2 |
| C | 0 | 25668 | 2 |
| D | 0 | 17096 | 2 |
| Quadrant | Total seconds | Saturated seconds | Saturation percentage |
|---|---|---|---|
| A | 6340 | 459 | 7.239748% |
| B | 6340 | 97 | 1.529968% |
| C | 6341 | 1284 | 20.249172% |
| D | 6341 | 155 | 2.444409% |
Noise dominated data is calculated using 1-second bins in cleaned event files. If a bin has >2000 counts, and if more than 50% of those come from <1% of pixels, then it is considered to be noise-dominated and hence unusable.
| Quadrant | # 1 sec bins | Bins with >0 counts | Bins with >2000 counts | High rate bins dominated by noise | Noise dominated (total time) | Noise dominated (detector-on time) | Marked lightcurve |
|---|---|---|---|---|---|---|---|
| A | 8575 | 6342 | 402 | 402 | 4.69% | 6.34% | 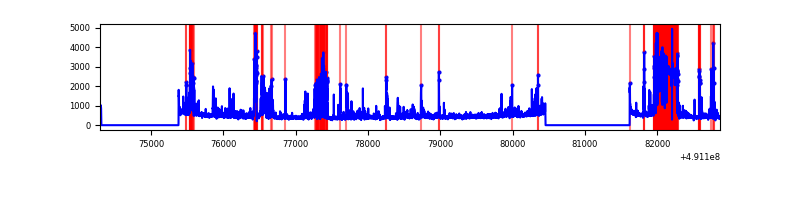 |
| B | 8575 | 6342 | 37 | 37 | 0.43% | 0.58% | 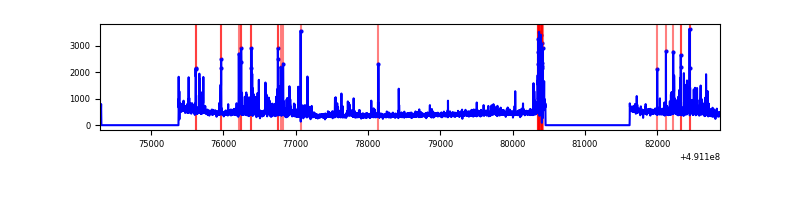 |
| C | 8576 | 6343 | 1221 | 1221 | 14.24% | 19.25% | 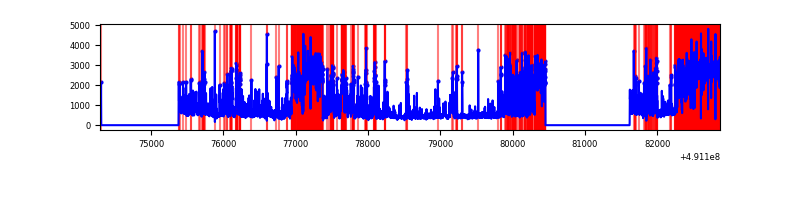 |
| D | 8576 | 6343 | 101 | 101 | 1.18% | 1.59% | 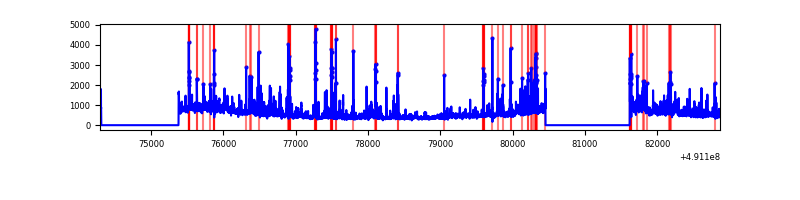 |
Top three noisy pixels from each quadrant. If the there are fewer than three noisy pixels in the level2.evt file, extra rows are filled as -1
| Pixel properties | Quadrant properties | ||||||
|---|---|---|---|---|---|---|---|
| Quadrant | DetID | PixID | Counts | Sigma | Mean | Median | Sigma |
| A | 12 | 115 | 1223266 | 7753.33 | 638 | 623 | 157.7 |
| A | 7 | 206 | 206628 | 1306.37 | 638 | 623 | 157.7 |
| A | 15 | 174 | 152936 | 965.88 | 638 | 623 | 157.7 |
| B | 4 | 81 | 235075 | 1699.67 | 659 | 638 | 137.9 |
| B | 2 | 249 | 115150 | 830.21 | 659 | 638 | 137.9 |
| B | 0 | 213 | 59373 | 425.83 | 659 | 638 | 137.9 |
| C | 1 | 241 | 2764429 | 16858.49 | 590 | 585 | 163.9 |
| C | 15 | 224 | 1174902 | 7162.92 | 590 | 585 | 163.9 |
| C | 0 | 240 | 339398 | 2066.64 | 590 | 585 | 163.9 |
| D | 15 | 125 | 497628 | 2686.29 | 643 | 613 | 185.0 |
| D | 2 | 153 | 277822 | 1498.27 | 643 | 613 | 185.0 |
| D | 9 | 49 | 158014 | 850.72 | 643 | 613 | 185.0 |
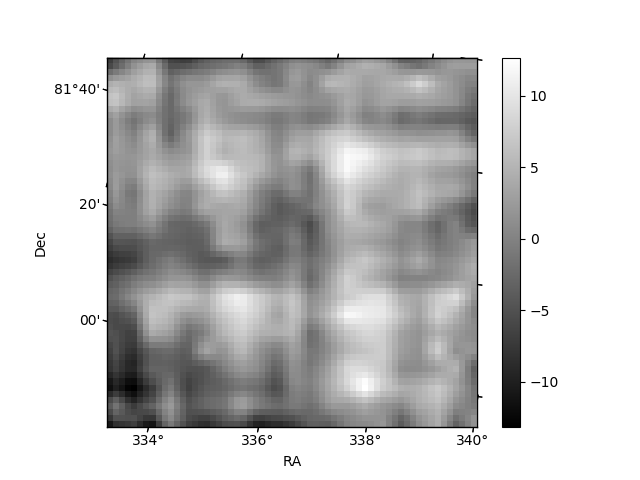
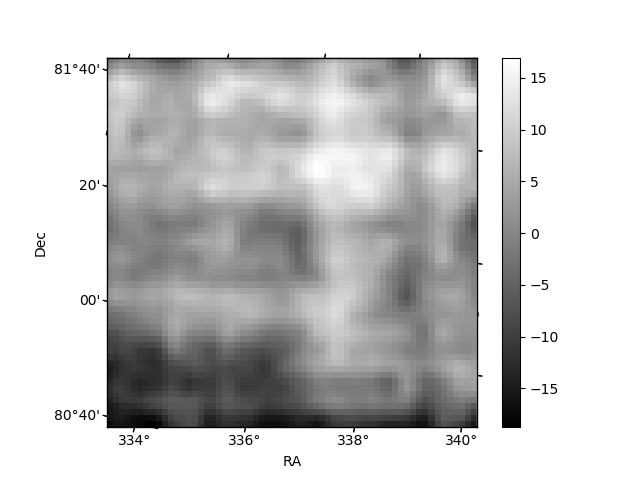
Histogram calculated using DETX and DETY for each event in the final _common_clean file
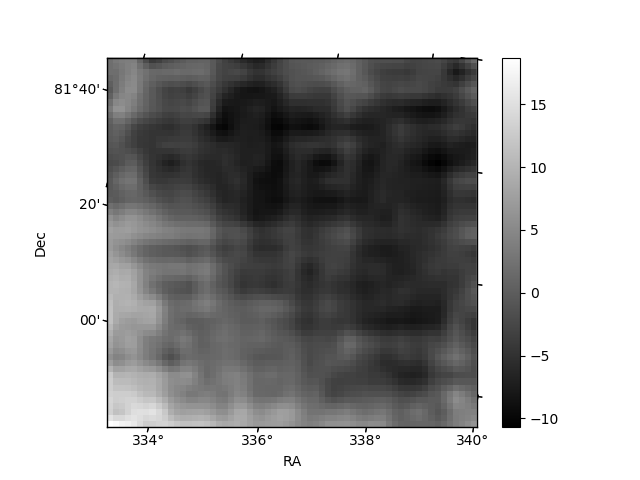
| Quadrant A | 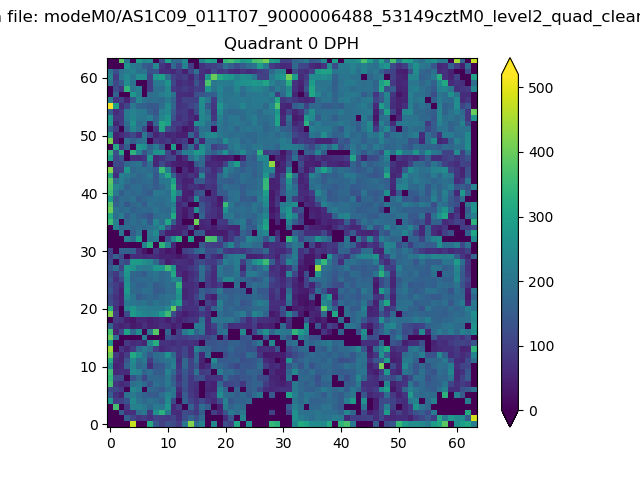 |
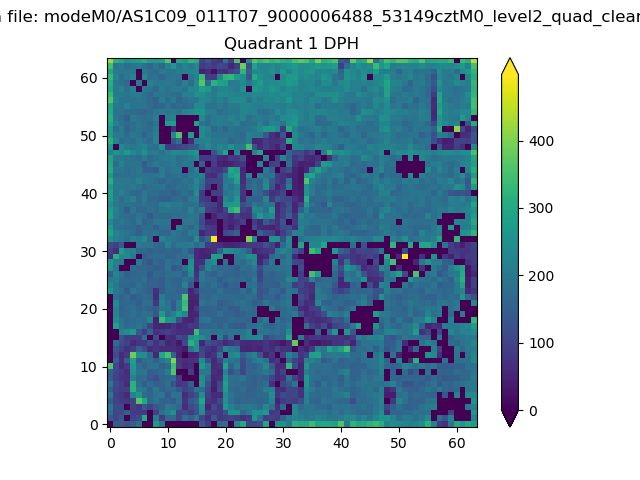 |
Quadrant B |
|---|---|---|---|
| Quadrant D | 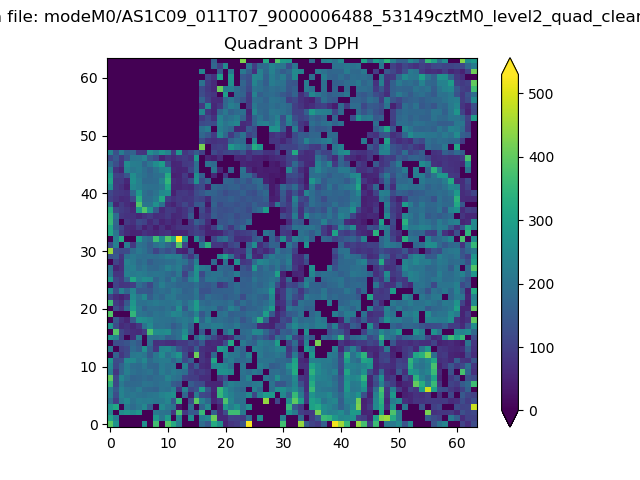 |
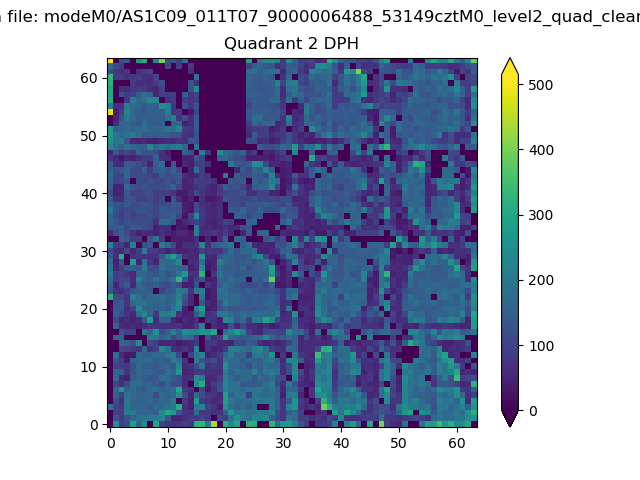 |
Quadrant C |
| Plot type | Count rate plots | Images |
|---|---|---|
| Comparison with Poisson distribution Blue bars denote a histogram of data divided into 1 sec bins. Red curve is a Poisson curve with rate = median count rate of data. |
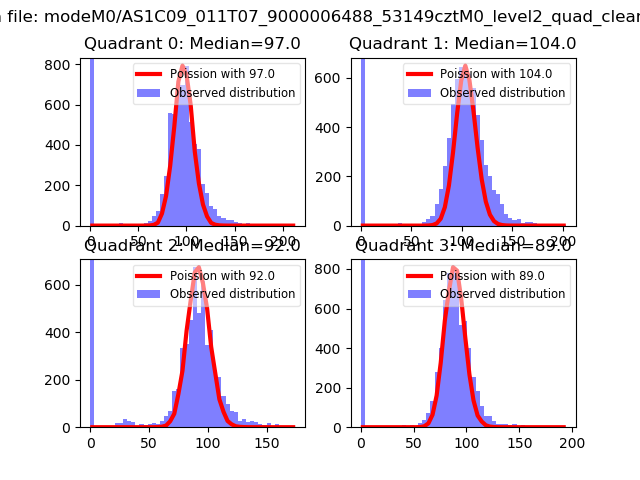 |
 |
| Quadrant-wise count rates Data is divided into 100 sec bins |
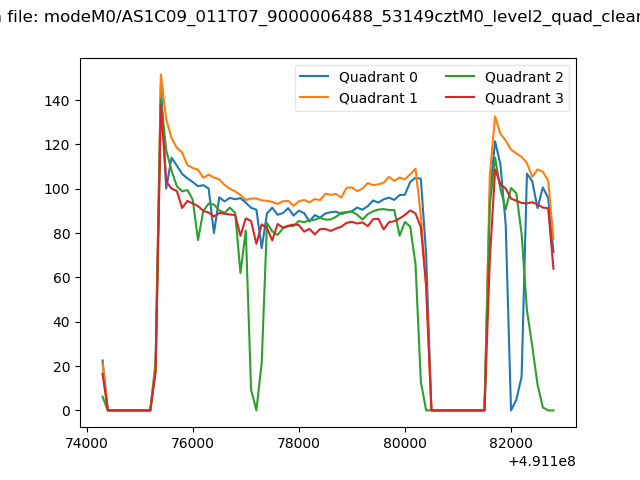 |
|
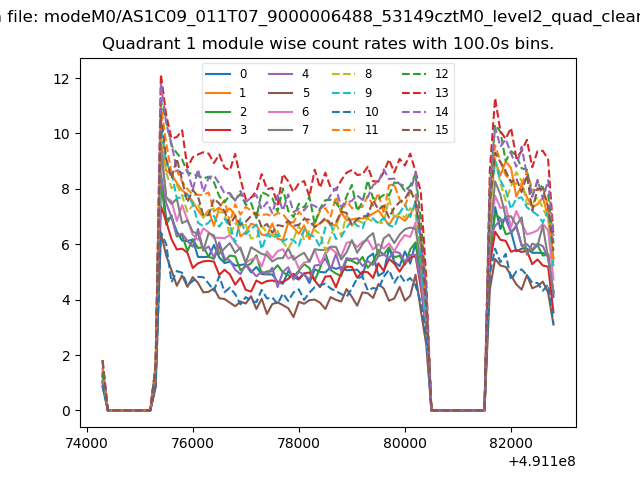
| Module-wise count rates for Quadrant A Data is divided into 100 sec bins |
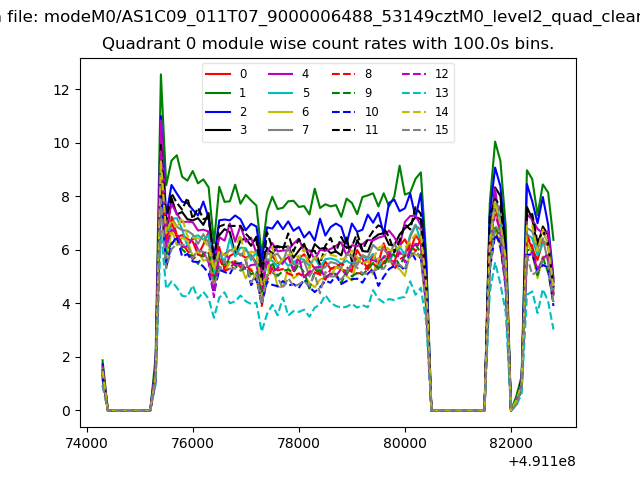 |
 |
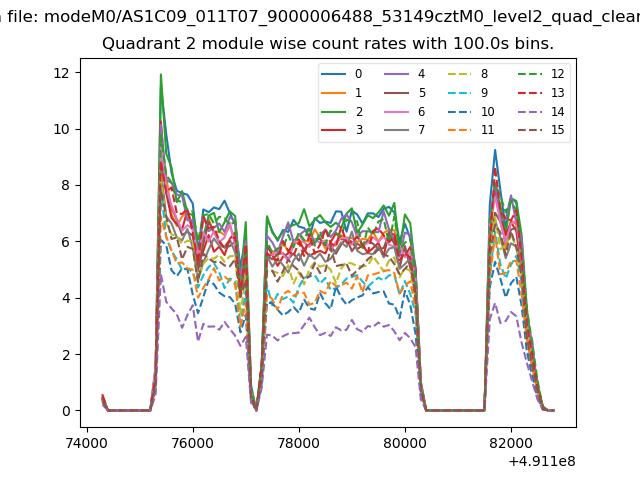
| Module-wise count rates for Quadrant B Data is divided into 100 sec bins |
 |
 |
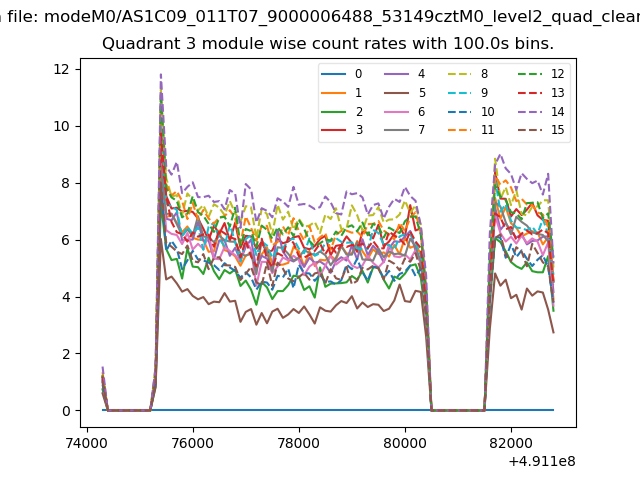
| Module-wise count rates for Quadrant C Data is divided into 100 sec bins |
 |
 |
| Module-wise count rates for Quadrant D Data is divided into 100 sec bins |
 |
 |
| Parameter | Plot |
|---|---|
| CZT HV Monitor | 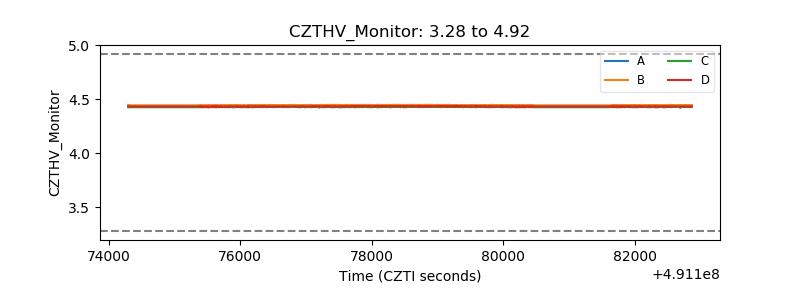 |
| D_VDD | 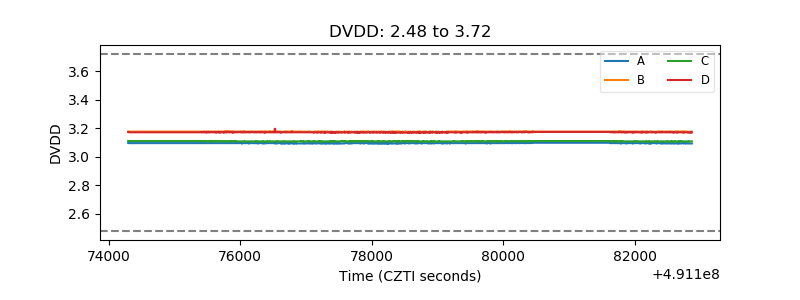 |
| Temperature 1 | 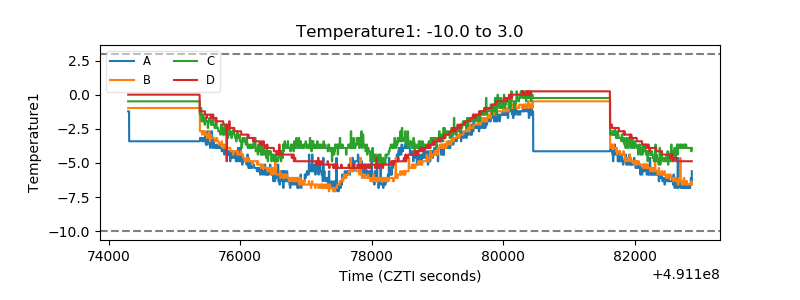 |
| Veto HV Monitor | 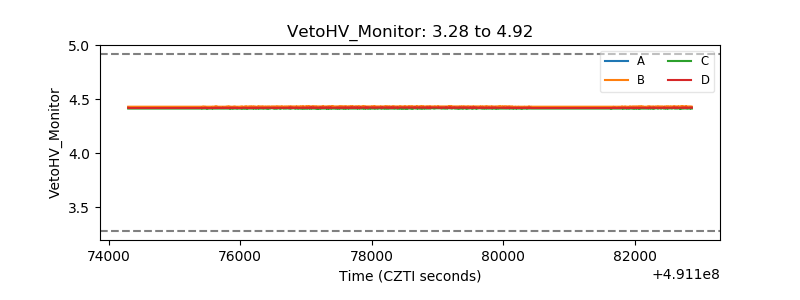 |
| Veto LLD | 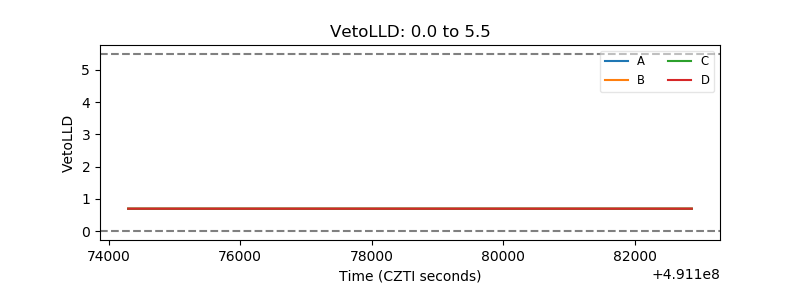 |
| Alpha Counter |  |
| _CPM_Rate | 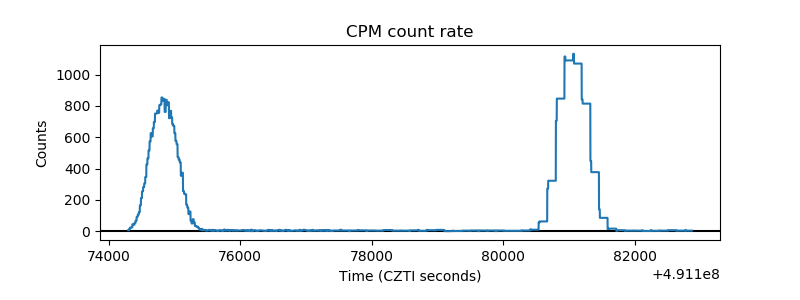 |
| CZT Counter | 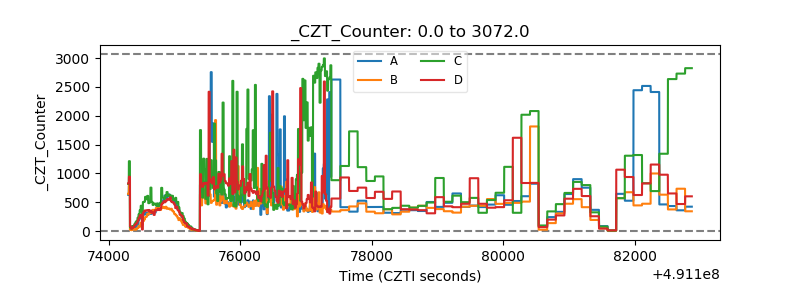 |
| +2.5 Volts monitor | 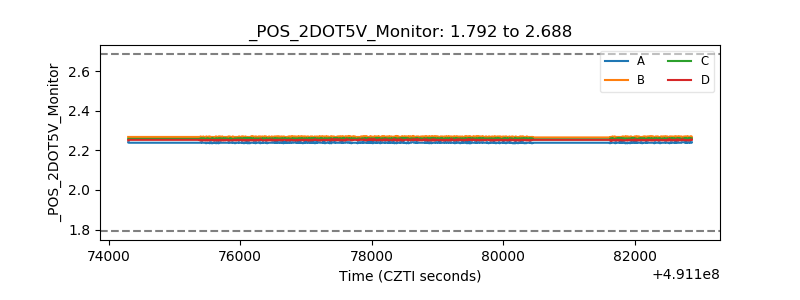 |
| +5 Volts monitor | 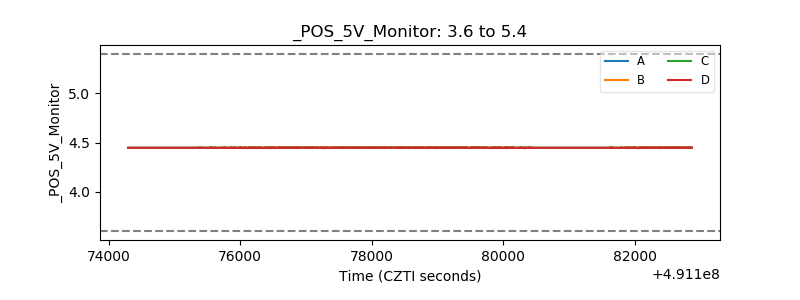 |
| _ROLL_ROT | 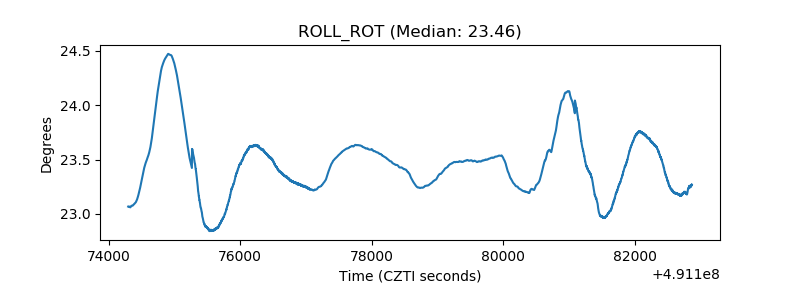 |
| _Roll_DEC | 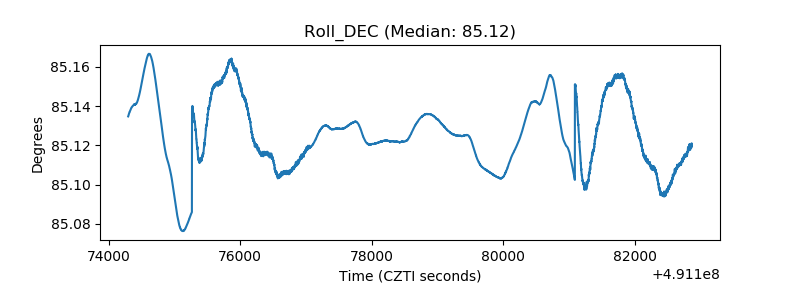 |
| _Roll_RA | 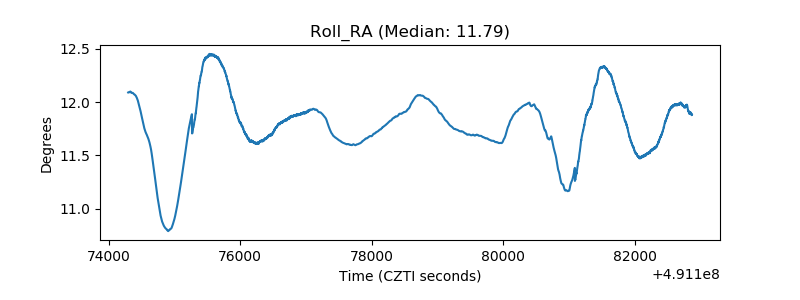 |
| Veto Counter | 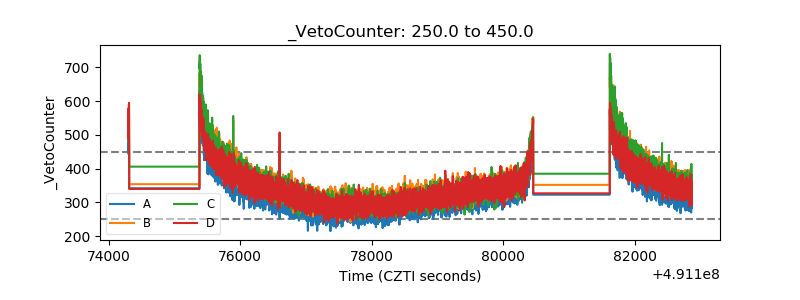 |