| Param | Original file | Final file |
|---|---|---|
| Filename | modeM0/AS1C09_011T07_9000006488_53150cztM0_level2.fits | modeM0/AS1C09_011T07_9000006488_53150cztM0_level2_quad_clean.evt |
| Size (bytes) | 550,823,040 | 95,376,960 |
| Size | 525.3 MB | 91.0 MB |
| Events in quadrant A | 4,021,635 | 628,473 |
| Events in quadrant B | 3,283,765 | 713,396 |
| Events in quadrant C | 7,113,427 | 528,650 |
| Events in quadrant D | 5,450,609 | 550,961 |
| Mode SS | |||
|---|---|---|---|
| Quadrant | BADHDUFLAG | Total packets | Discarded packets |
| A | 0 | 136 | 0 |
| B | 0 | 136 | 0 |
| C | 0 | 136 | 0 |
| D | 0 | 136 | 0 |
| Mode M9 | |||
|---|---|---|---|
| Quadrant | BADHDUFLAG | Total packets | Discarded packets |
| A | 0 | 25 | 0 |
| B | 0 | 25 | 0 |
| C | 0 | 25 | 0 |
| D | 0 | 25 | 0 |
| Mode M0 | |||
|---|---|---|---|
| Quadrant | BADHDUFLAG | Total packets | Discarded packets |
| A | 0 | 17037 | 2 |
| B | 0 | 14859 | 2 |
| C | 0 | 25740 | 8 |
| D | 0 | 21086 | 2 |
| Quadrant | Total seconds | Saturated seconds | Saturation percentage |
|---|---|---|---|
| A | 6697 | 382 | 5.704047% |
| B | 6698 | 84 | 1.254106% |
| C | 6697 | 1268 | 18.933851% |
| D | 6697 | 619 | 9.242945% |
Noise dominated data is calculated using 1-second bins in cleaned event files. If a bin has >2000 counts, and if more than 50% of those come from <1% of pixels, then it is considered to be noise-dominated and hence unusable.
| Quadrant | # 1 sec bins | Bins with >0 counts | Bins with >2000 counts | High rate bins dominated by noise | Noise dominated (total time) | Noise dominated (detector-on time) | Marked lightcurve |
|---|---|---|---|---|---|---|---|
| A | 9107 | 6699 | 330 | 330 | 3.62% | 4.93% | 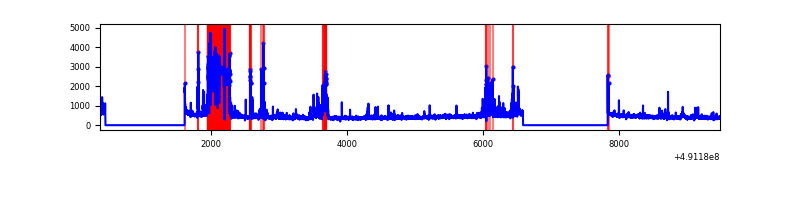 |
| B | 9108 | 6700 | 31 | 31 | 0.34% | 0.46% | 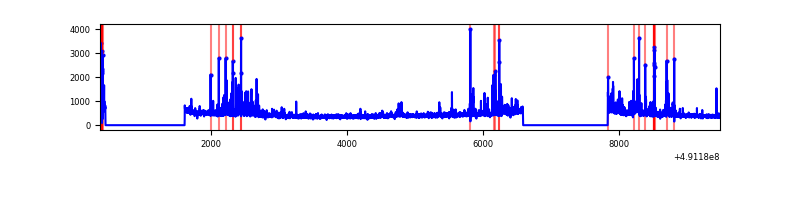 |
| C | 9107 | 6699 | 1181 | 1181 | 12.97% | 17.63% | 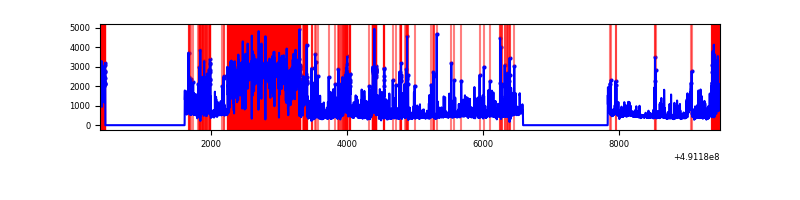 |
| D | 9107 | 6699 | 552 | 552 | 6.06% | 8.24% | 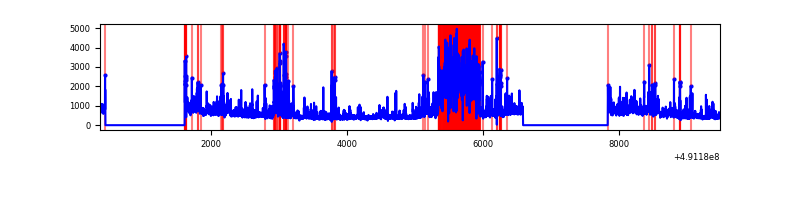 |
Top three noisy pixels from each quadrant. If the there are fewer than three noisy pixels in the level2.evt file, extra rows are filled as -1
| Pixel properties | Quadrant properties | ||||||
|---|---|---|---|---|---|---|---|
| Quadrant | DetID | PixID | Counts | Sigma | Mean | Median | Sigma |
| A | 12 | 115 | 857471 | 5115.94 | 673 | 657 | 167.5 |
| A | 15 | 174 | 128599 | 763.93 | 673 | 657 | 167.5 |
| A | 3 | 62 | 121157 | 719.49 | 673 | 657 | 167.5 |
| B | 4 | 81 | 202574 | 1388.32 | 695 | 673 | 145.4 |
| B | 10 | 247 | 63202 | 429.97 | 695 | 673 | 145.4 |
| B | 2 | 249 | 52020 | 353.08 | 695 | 673 | 145.4 |
| C | 1 | 241 | 2792814 | 16355.31 | 617 | 613 | 170.7 |
| C | 15 | 224 | 1090101 | 6381.67 | 617 | 613 | 170.7 |
| C | 13 | 3 | 346789 | 2027.72 | 617 | 613 | 170.7 |
| D | 10 | 172 | 1401581 | 7578.51 | 636 | 608 | 184.9 |
| D | 15 | 125 | 430487 | 2325.41 | 636 | 608 | 184.9 |
| D | 3 | 12 | 301793 | 1629.25 | 636 | 608 | 184.9 |
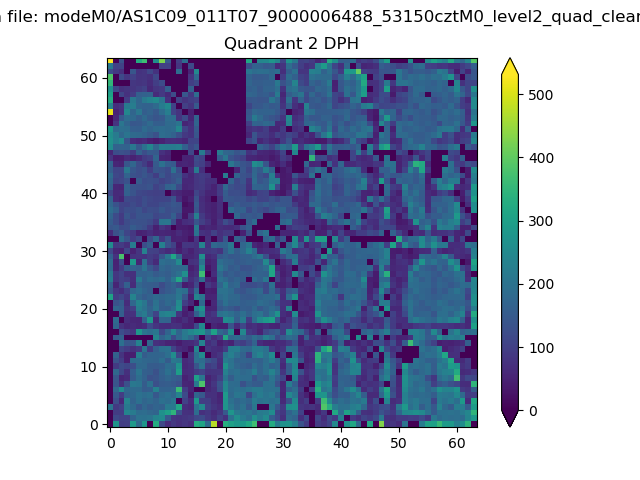
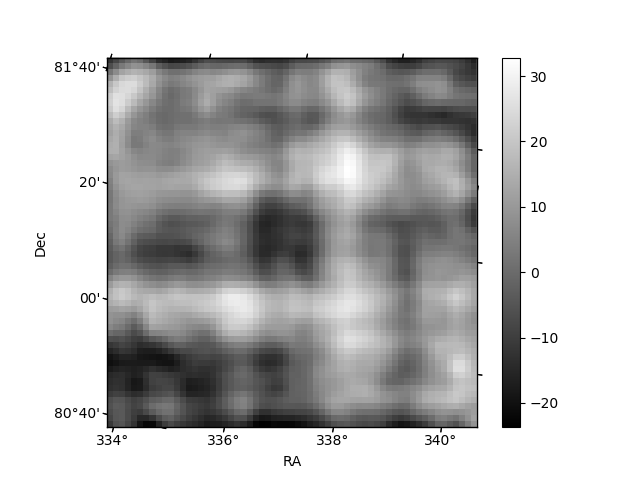
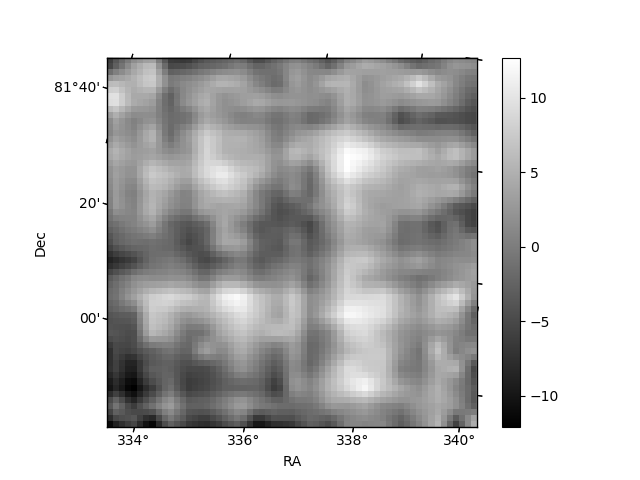
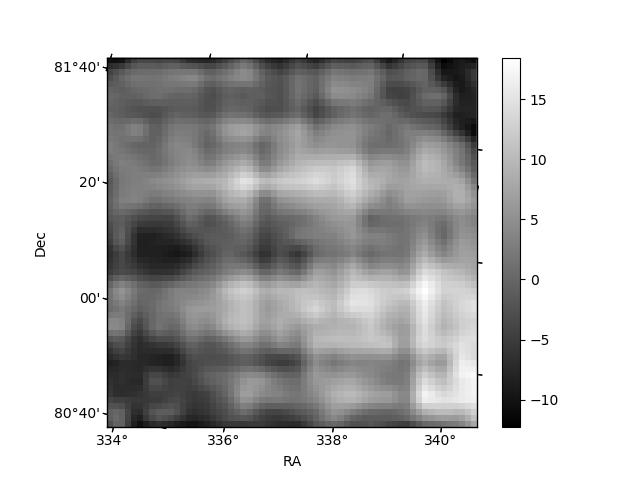
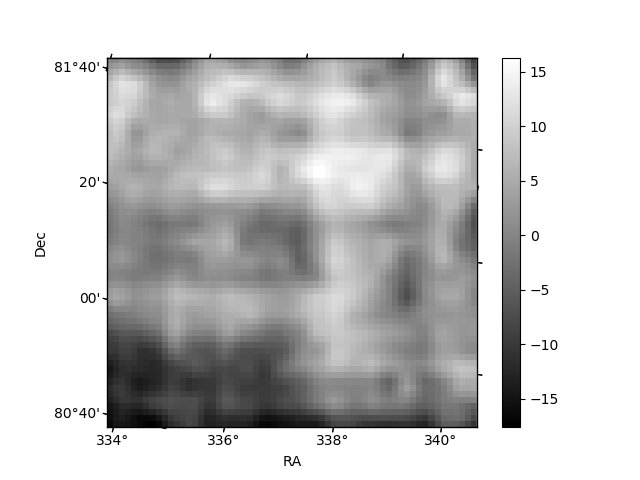
Histogram calculated using DETX and DETY for each event in the final _common_clean file
| Quadrant A | 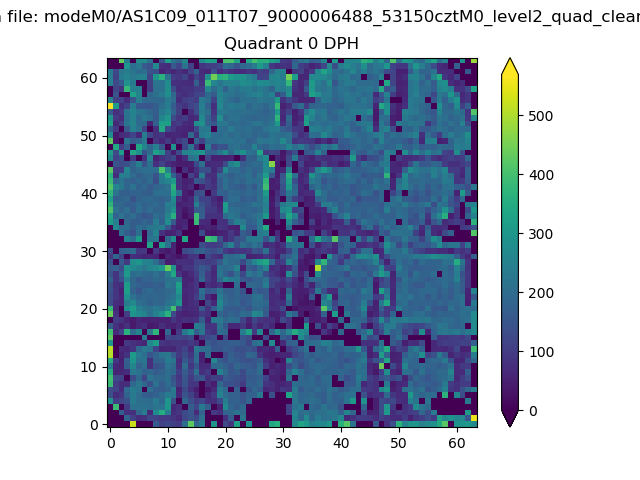 |
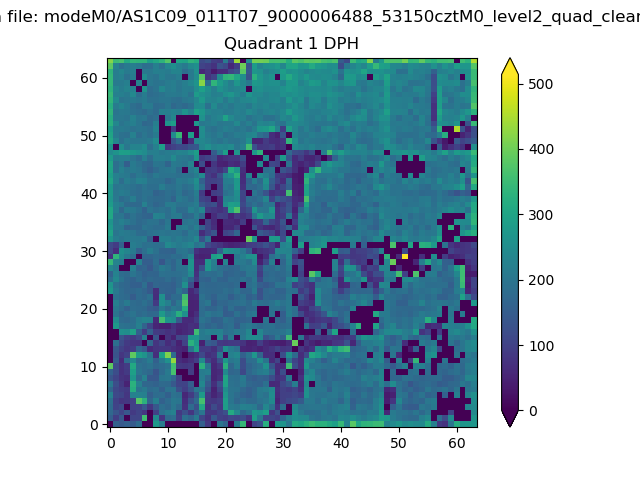 |
Quadrant B |
|---|---|---|---|
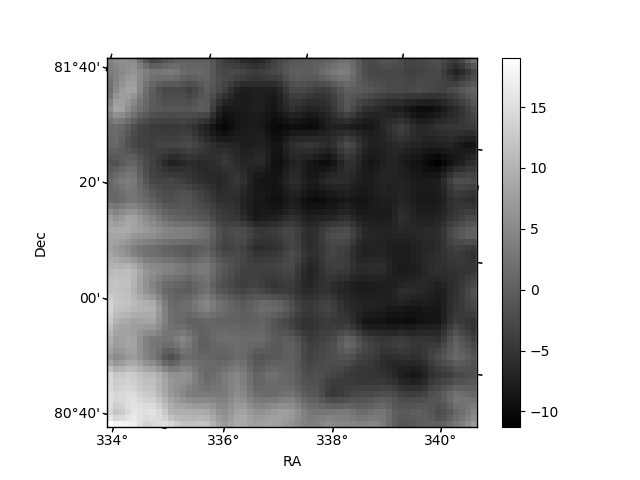
| Quadrant D | 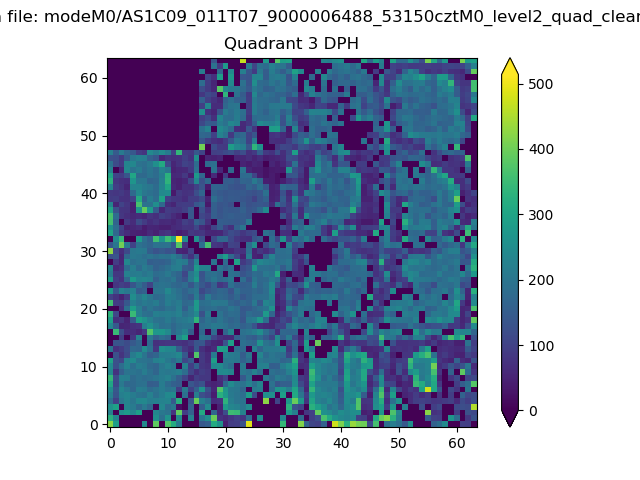 |
 |
Quadrant C |
| Plot type | Count rate plots | Images |
|---|---|---|
| Comparison with Poisson distribution Blue bars denote a histogram of data divided into 1 sec bins. Red curve is a Poisson curve with rate = median count rate of data. |
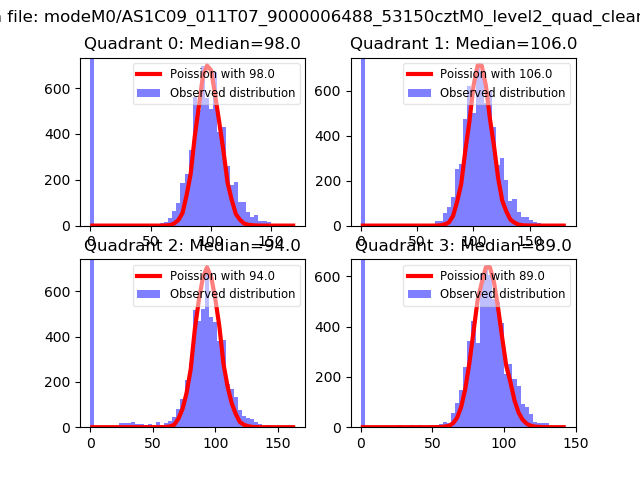 |
 |
| Quadrant-wise count rates Data is divided into 100 sec bins |
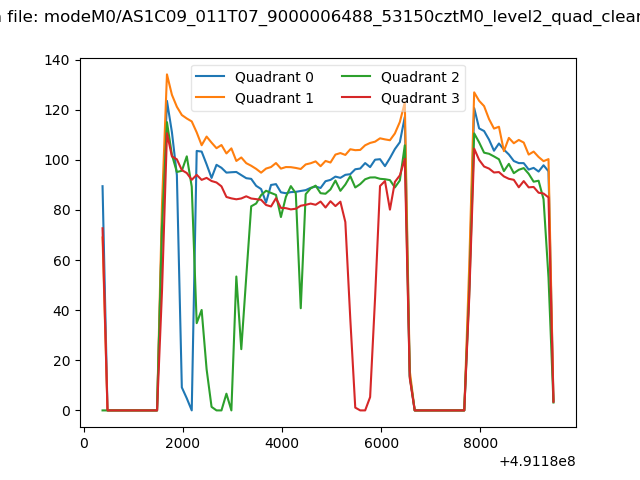 |
|
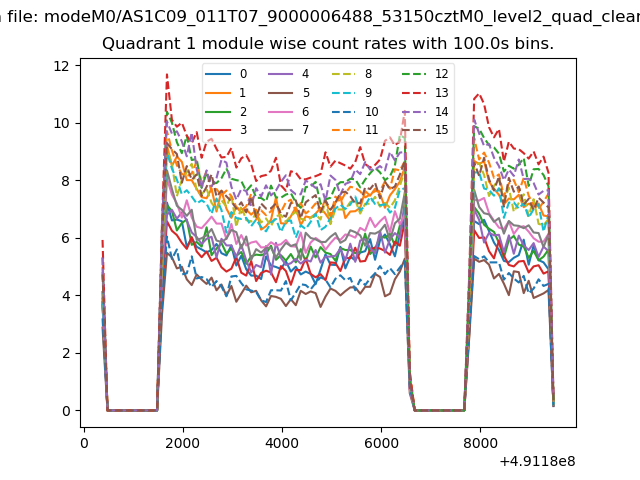
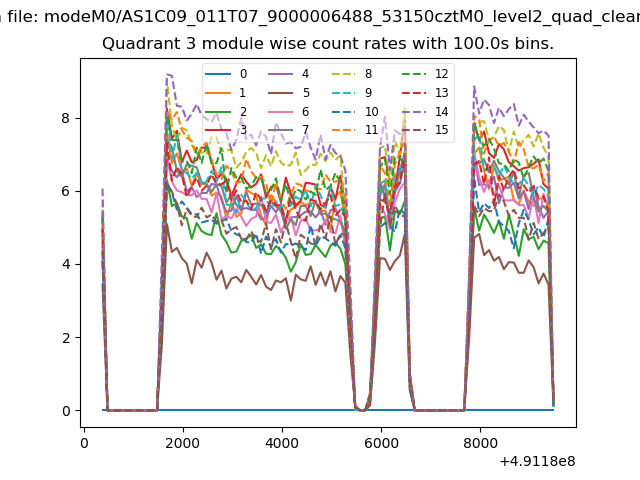
| Module-wise count rates for Quadrant A Data is divided into 100 sec bins |
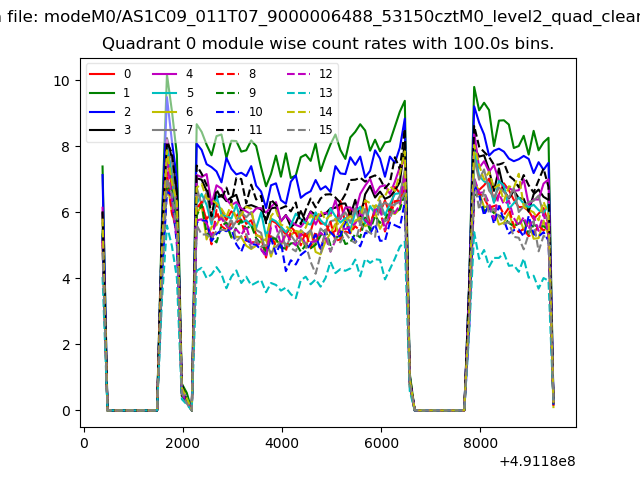 |
 |
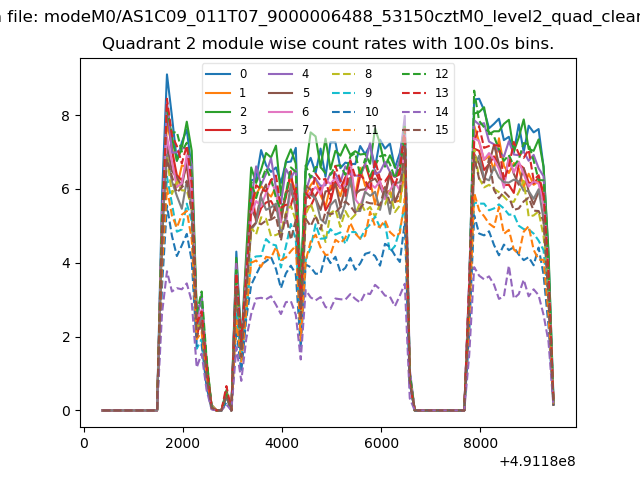
| Module-wise count rates for Quadrant B Data is divided into 100 sec bins |
 |
 |
| Module-wise count rates for Quadrant C Data is divided into 100 sec bins |
 |
 |
| Module-wise count rates for Quadrant D Data is divided into 100 sec bins |
 |
 |
| Parameter | Plot |
|---|---|
| CZT HV Monitor | 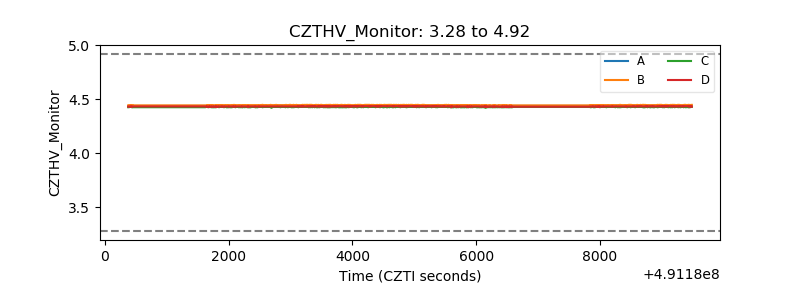 |
| D_VDD | 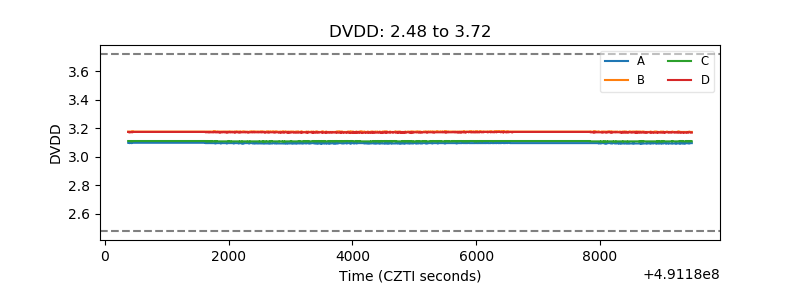 |
| Temperature 1 | 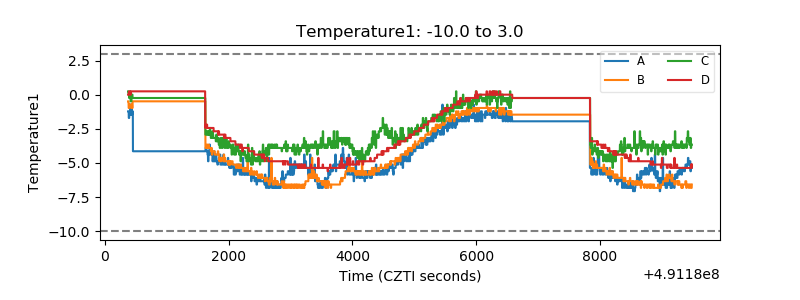 |
| Veto HV Monitor | 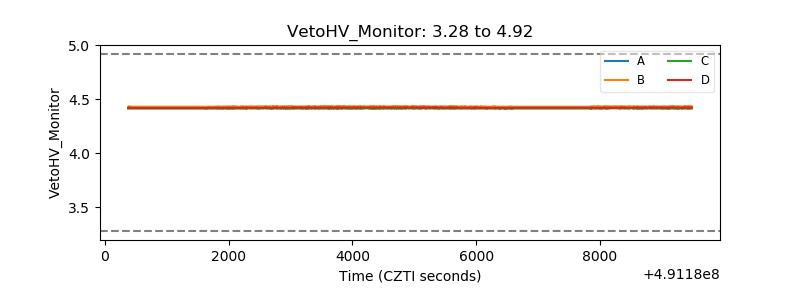 |
| Veto LLD | 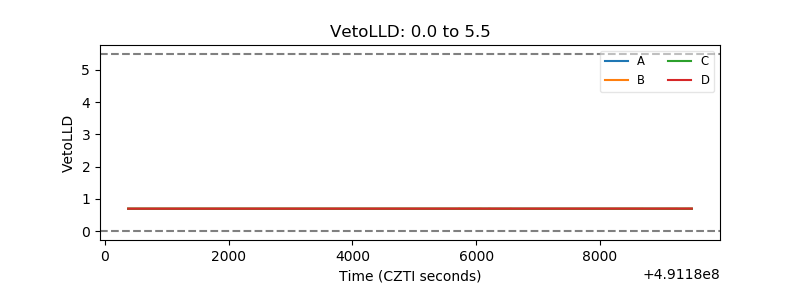 |
| Alpha Counter | 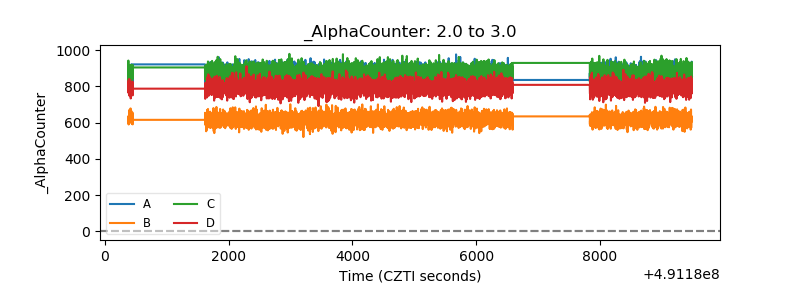 |
| _CPM_Rate | 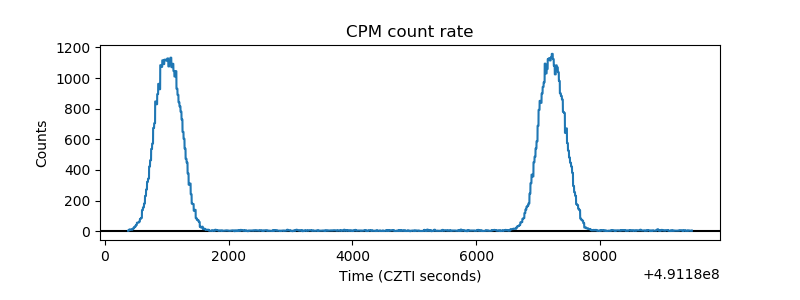 |
| CZT Counter | 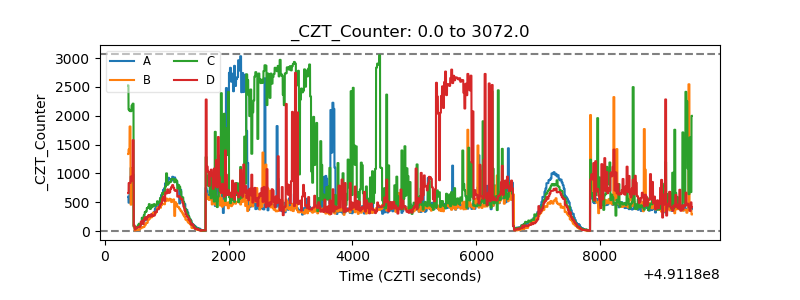 |
| +2.5 Volts monitor |  |
| +5 Volts monitor |  |
| _ROLL_ROT | 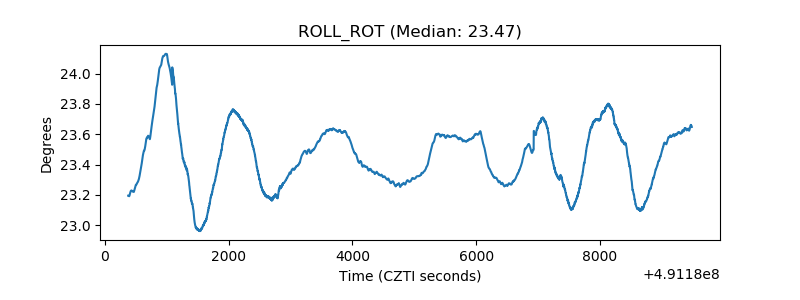 |
| _Roll_DEC | 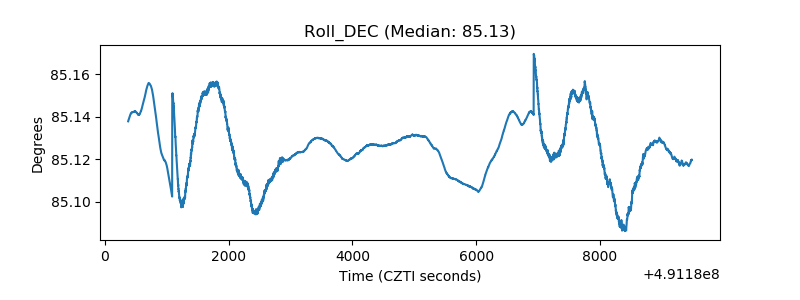 |
| _Roll_RA | 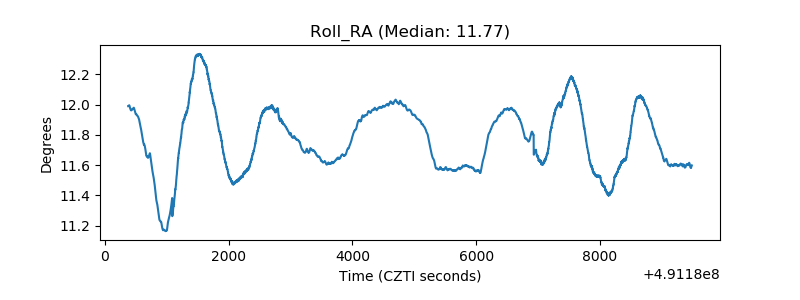 |
| Veto Counter | 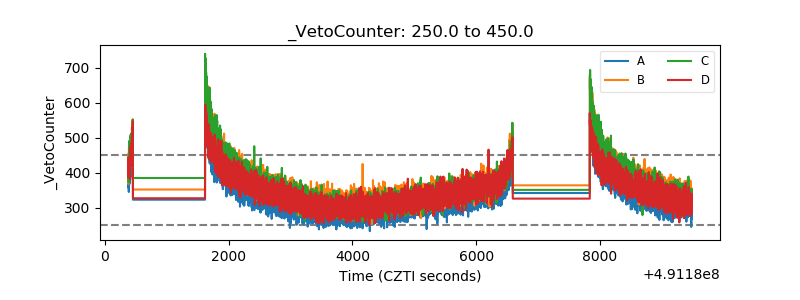 |