| Param | Original file | Final file |
|---|---|---|
| Filename | modeM0/AS1C09_011T07_9000006488_53151cztM0_level2.fits | modeM0/AS1C09_011T07_9000006488_53151cztM0_level2_quad_clean.evt |
| Size (bytes) | 501,007,680 | 97,018,560 |
| Size | 477.8 MB | 92.5 MB |
| Events in quadrant A | 3,558,518 | 647,295 |
| Events in quadrant B | 3,528,997 | 688,095 |
| Events in quadrant C | 6,654,401 | 557,289 |
| Events in quadrant D | 4,288,940 | 583,197 |
| Mode SS | |||
|---|---|---|---|
| Quadrant | BADHDUFLAG | Total packets | Discarded packets |
| A | 0 | 134 | 0 |
| B | 0 | 134 | 0 |
| C | 0 | 134 | 0 |
| D | 0 | 134 | 0 |
| Mode M9 | |||
|---|---|---|---|
| Quadrant | BADHDUFLAG | Total packets | Discarded packets |
| A | 0 | 17 | 0 |
| B | 0 | 18 | 0 |
| C | 0 | 18 | 0 |
| D | 0 | 18 | 0 |
| Mode M0 | |||
|---|---|---|---|
| Quadrant | BADHDUFLAG | Total packets | Discarded packets |
| A | 0 | 15454 | 3 |
| B | 0 | 15531 | 2 |
| C | 0 | 24356 | 2 |
| D | 0 | 17656 | 2 |
| Quadrant | Total seconds | Saturated seconds | Saturation percentage |
|---|---|---|---|
| A | 6626 | 127 | 1.916692% |
| B | 6626 | 234 | 3.531542% |
| C | 6626 | 878 | 13.250830% |
| D | 6626 | 134 | 2.022336% |
Noise dominated data is calculated using 1-second bins in cleaned event files. If a bin has >2000 counts, and if more than 50% of those come from <1% of pixels, then it is considered to be noise-dominated and hence unusable.
| Quadrant | # 1 sec bins | Bins with >0 counts | Bins with >2000 counts | High rate bins dominated by noise | Noise dominated (total time) | Noise dominated (detector-on time) | Marked lightcurve |
|---|---|---|---|---|---|---|---|
| A | 7836 | 6627 | 93 | 93 | 1.19% | 1.40% | 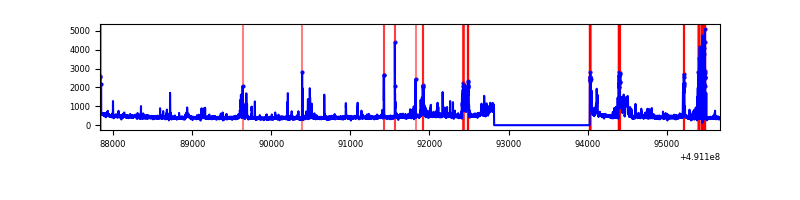 |
| B | 7836 | 6627 | 92 | 92 | 1.17% | 1.39% | 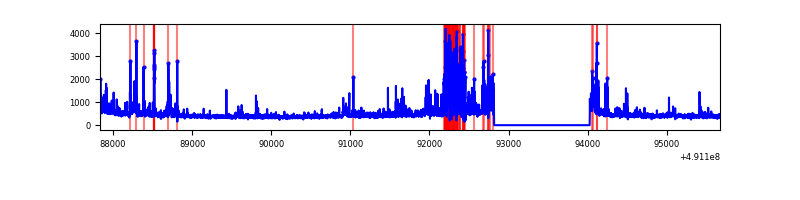 |
| C | 7836 | 6627 | 766 | 766 | 9.78% | 11.56% | 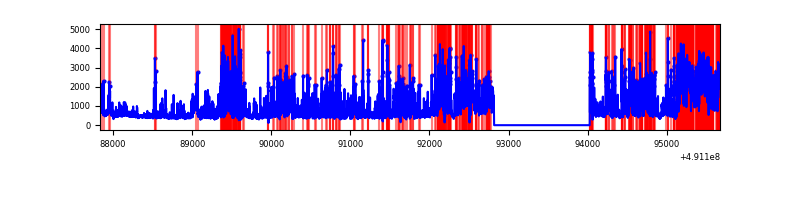 |
| D | 7836 | 6627 | 102 | 102 | 1.30% | 1.54% | 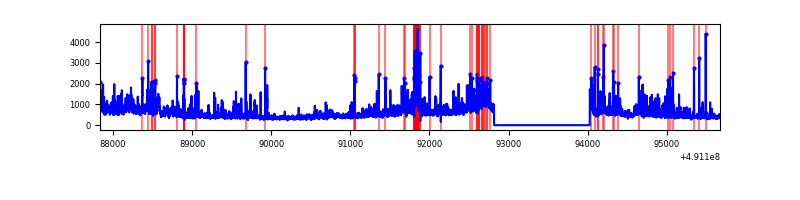 |
Top three noisy pixels from each quadrant. If the there are fewer than three noisy pixels in the level2.evt file, extra rows are filled as -1
| Pixel properties | Quadrant properties | ||||||
|---|---|---|---|---|---|---|---|
| Quadrant | DetID | PixID | Counts | Sigma | Mean | Median | Sigma |
| A | 12 | 115 | 259788 | 1495.34 | 683 | 664 | 173.3 |
| A | 15 | 174 | 248736 | 1431.57 | 683 | 664 | 173.3 |
| A | 6 | 211 | 59638 | 340.33 | 683 | 664 | 173.3 |
| B | 2 | 249 | 377439 | 2657.21 | 676 | 653 | 141.8 |
| B | 4 | 81 | 180826 | 1270.64 | 676 | 653 | 141.8 |
| B | 4 | 171 | 74766 | 522.67 | 676 | 653 | 141.8 |
| C | 15 | 224 | 1538194 | 8721.79 | 635 | 629 | 176.3 |
| C | 13 | 3 | 870810 | 4936.07 | 635 | 629 | 176.3 |
| C | 0 | 240 | 678711 | 3846.4 | 635 | 629 | 176.3 |
| D | 15 | 125 | 466074 | 2463.16 | 654 | 624 | 189.0 |
| D | 2 | 120 | 227965 | 1203.09 | 654 | 624 | 189.0 |
| D | 3 | 12 | 209819 | 1107.06 | 654 | 624 | 189.0 |
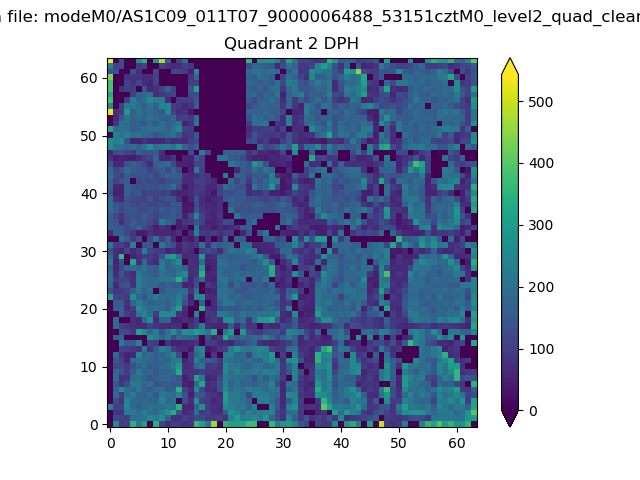
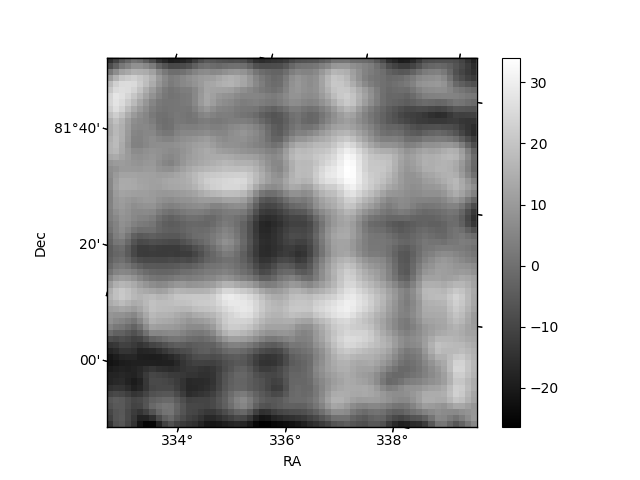
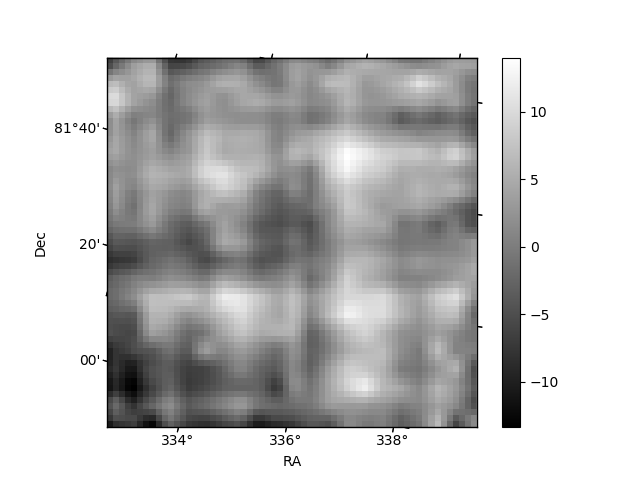
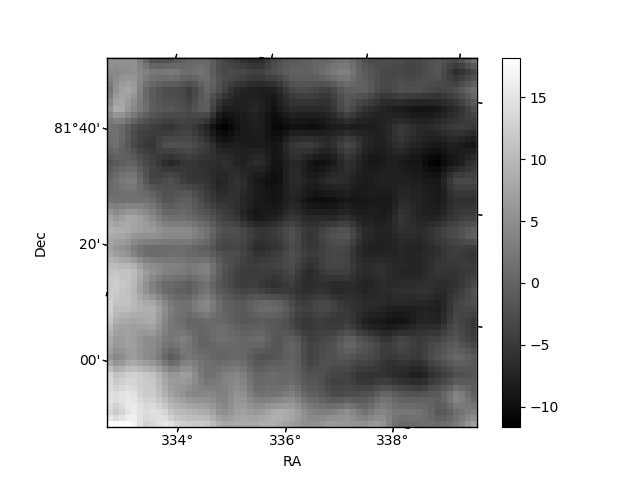
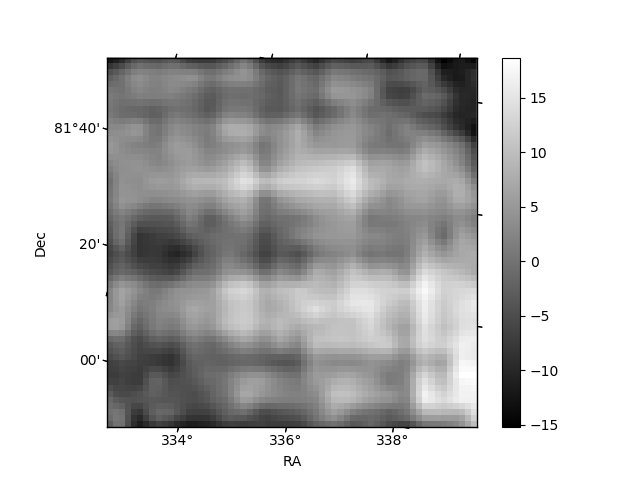
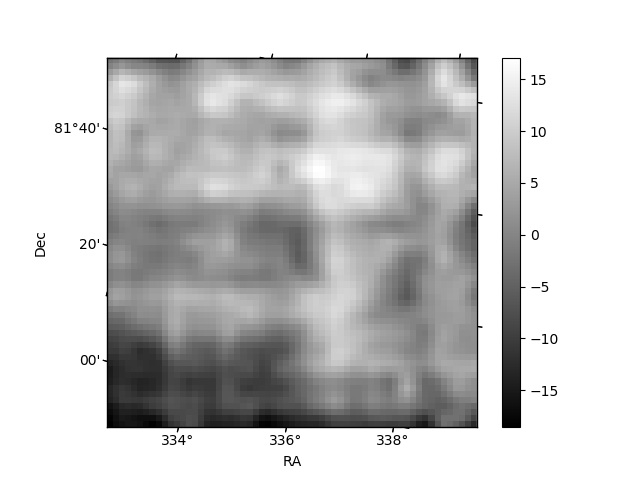
Histogram calculated using DETX and DETY for each event in the final _common_clean file
| Quadrant A | 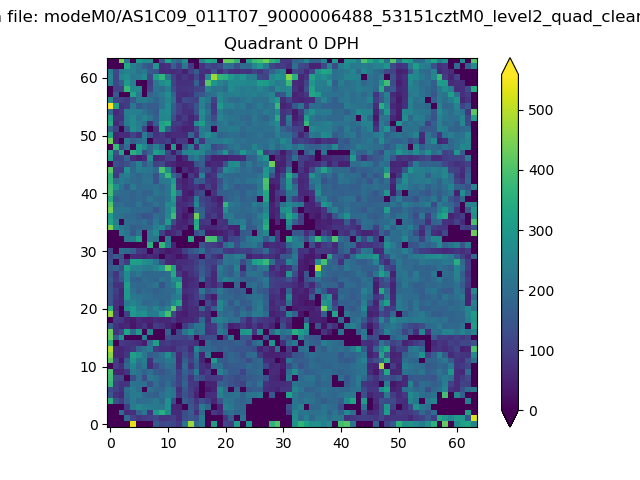 |
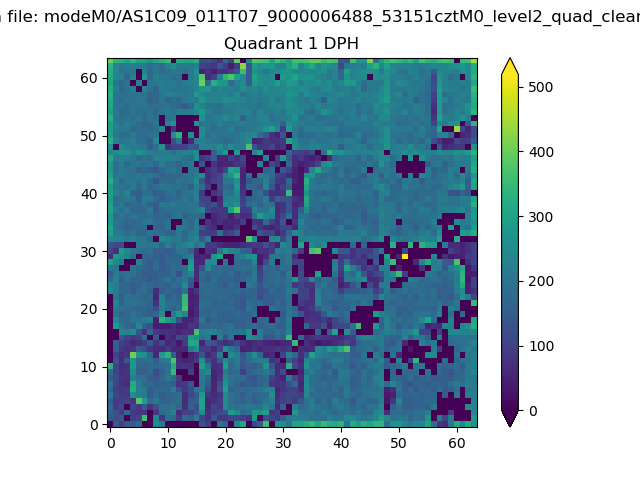 |
Quadrant B |
|---|---|---|---|
| Quadrant D | 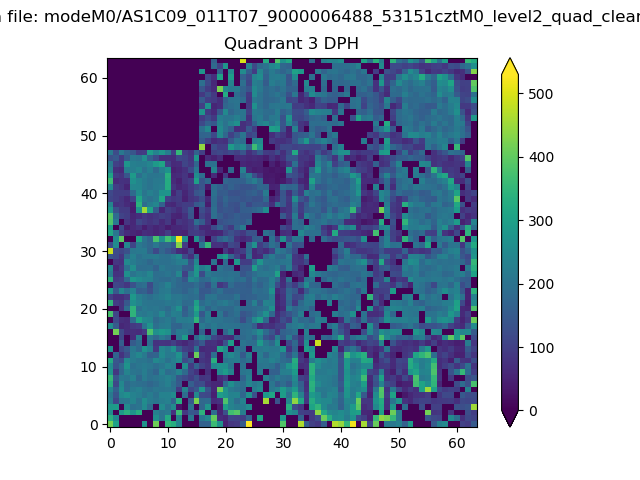 |
 |
Quadrant C |
| Plot type | Count rate plots | Images |
|---|---|---|
| Comparison with Poisson distribution Blue bars denote a histogram of data divided into 1 sec bins. Red curve is a Poisson curve with rate = median count rate of data. |
 |
 |
| Quadrant-wise count rates Data is divided into 100 sec bins |
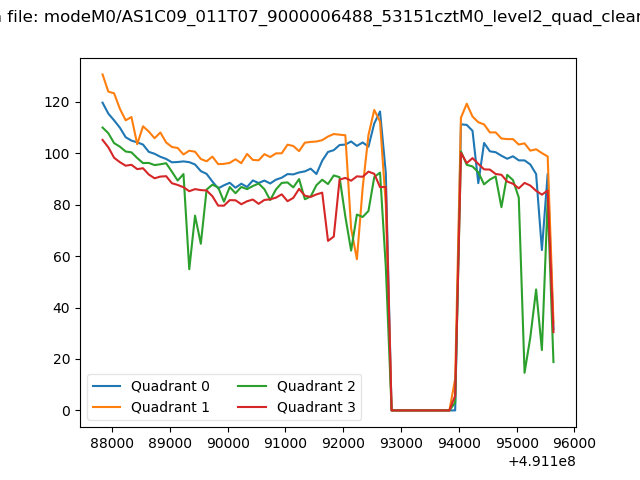 |
|
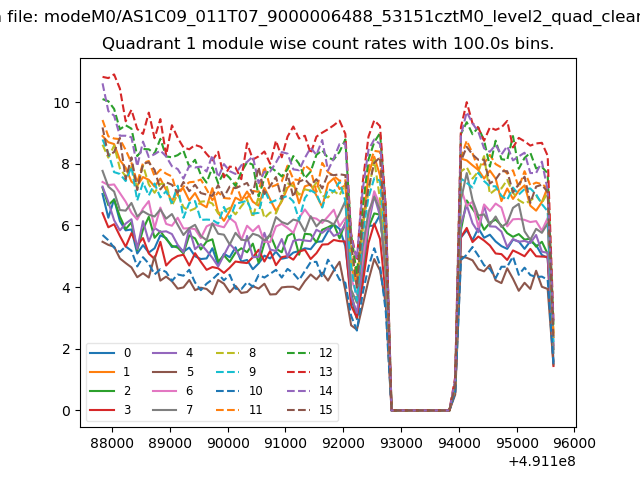
| Module-wise count rates for Quadrant A Data is divided into 100 sec bins |
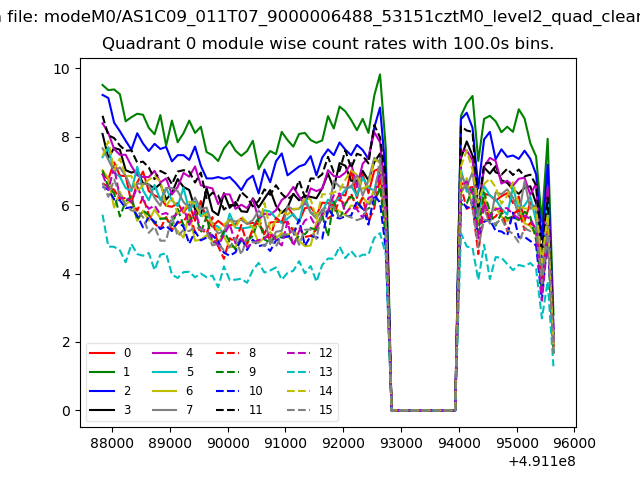 |
 |
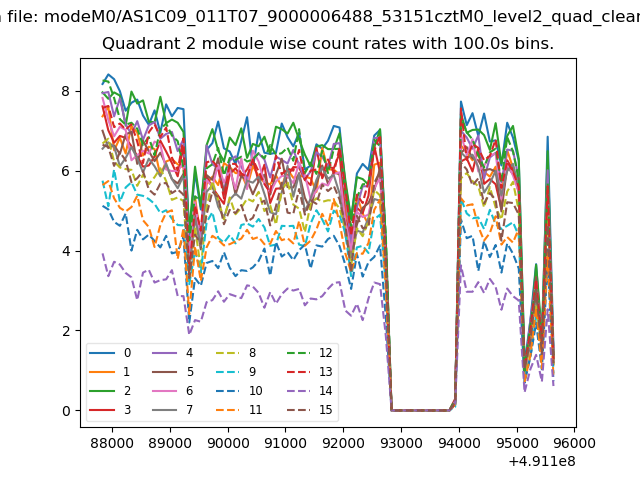
| Module-wise count rates for Quadrant B Data is divided into 100 sec bins |
 |
 |
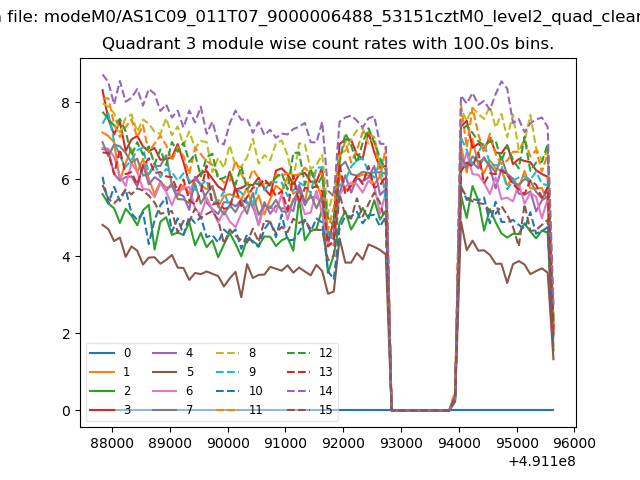
| Module-wise count rates for Quadrant C Data is divided into 100 sec bins |
 |
 |
| Module-wise count rates for Quadrant D Data is divided into 100 sec bins |
 |
 |
| Parameter | Plot |
|---|---|
| CZT HV Monitor | 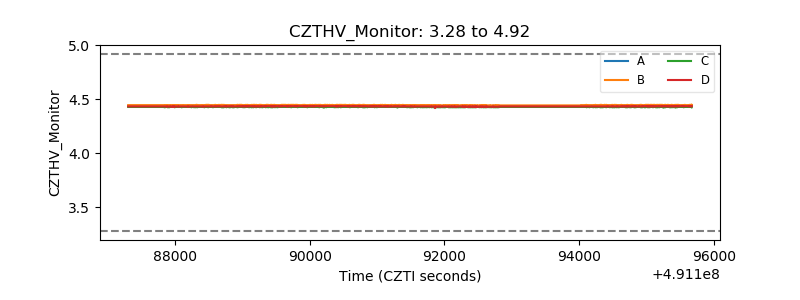 |
| D_VDD | 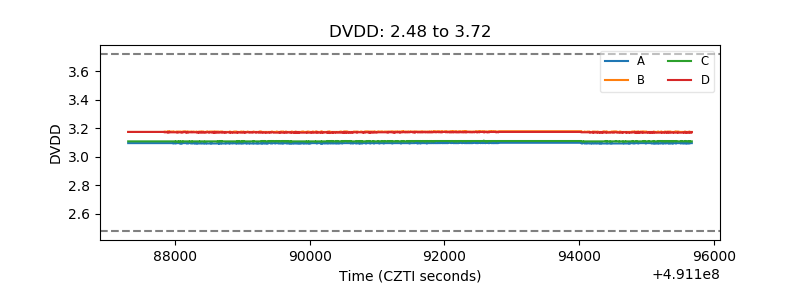 |
| Temperature 1 | 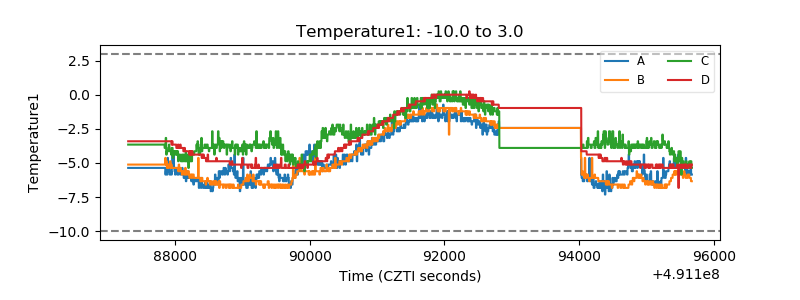 |
| Veto HV Monitor | 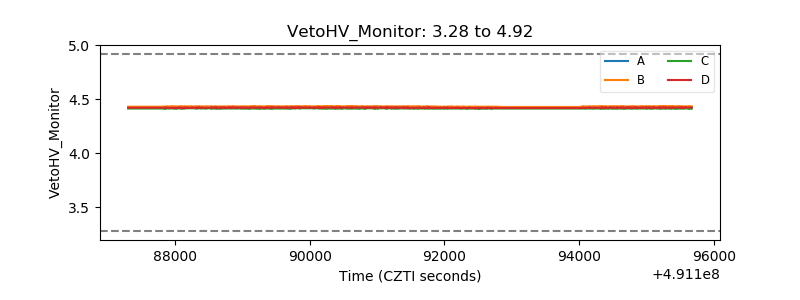 |
| Veto LLD | 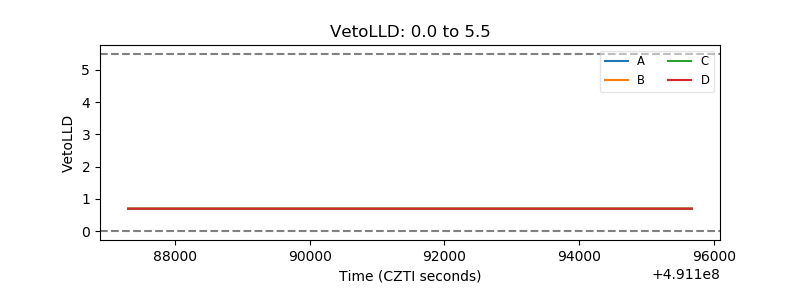 |
| Alpha Counter | 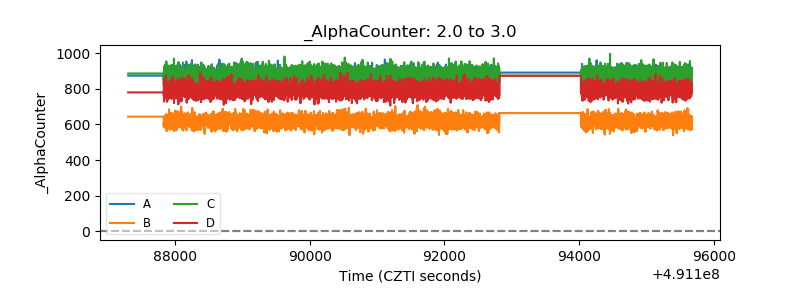 |
| _CPM_Rate | 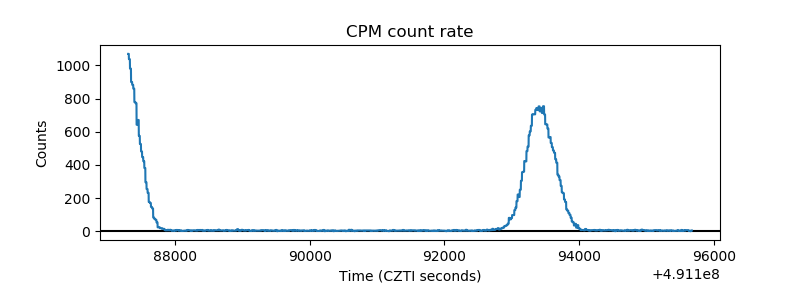 |
| CZT Counter | 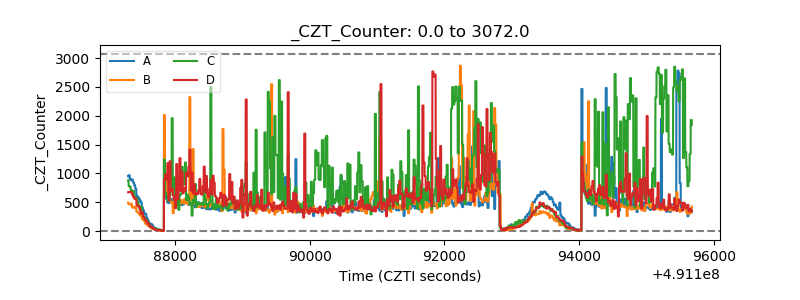 |
| +2.5 Volts monitor | 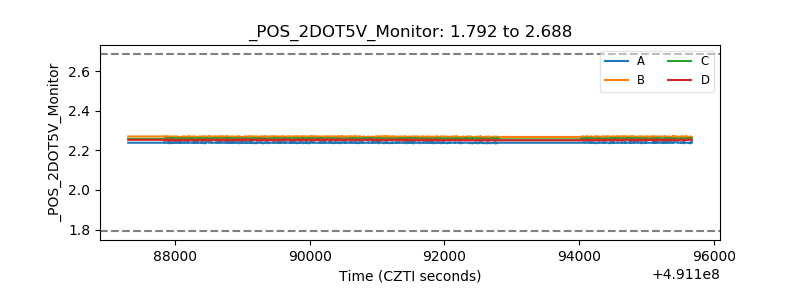 |
| +5 Volts monitor | 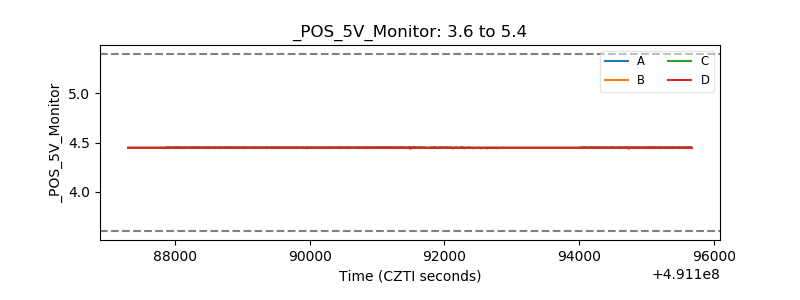 |
| _ROLL_ROT | 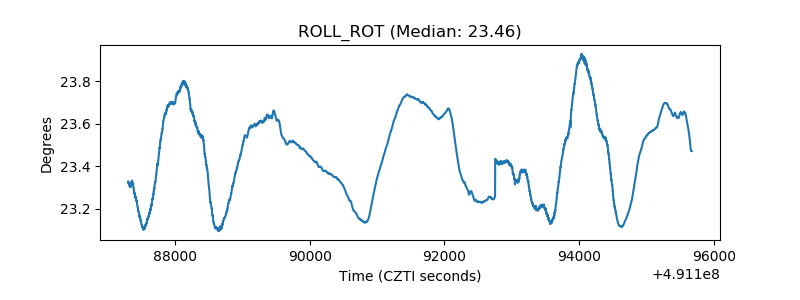 |
| _Roll_DEC | 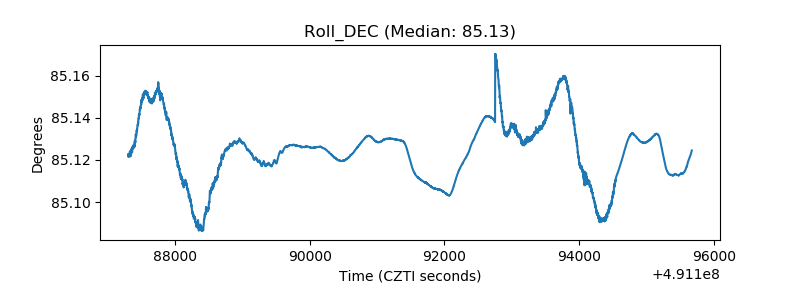 |
| _Roll_RA | 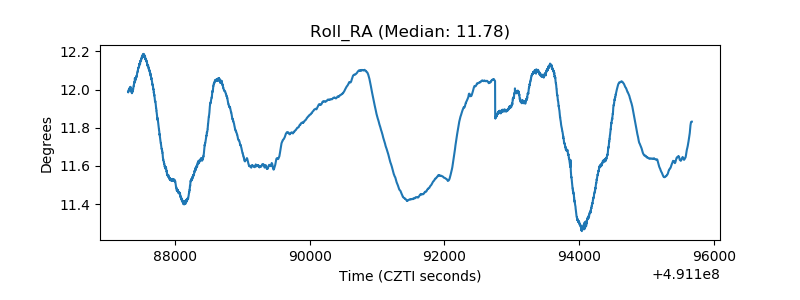 |
| Veto Counter | 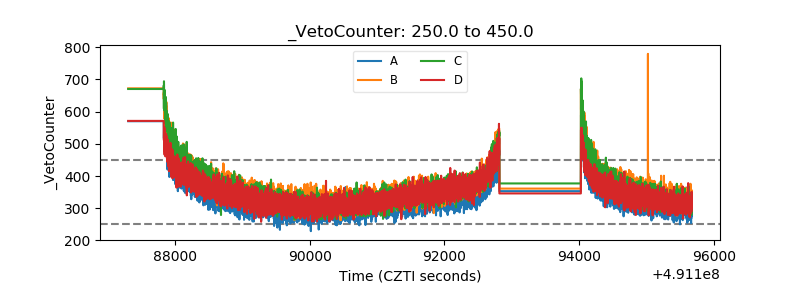 |