| Param | Original file | Final file |
|---|---|---|
| Filename | modeM0/AS1C09_011T07_9000006488_53153cztM0_level2.fits | modeM0/AS1C09_011T07_9000006488_53153cztM0_level2_quad_clean.evt |
| Size (bytes) | 519,860,160 | 89,844,480 |
| Size | 495.8 MB | 85.7 MB |
| Events in quadrant A | 3,334,753 | 602,931 |
| Events in quadrant B | 3,483,254 | 630,487 |
| Events in quadrant C | 7,279,995 | 499,675 |
| Events in quadrant D | 4,640,835 | 534,397 |
| Mode SS | |||
|---|---|---|---|
| Quadrant | BADHDUFLAG | Total packets | Discarded packets |
| A | 0 | 130 | 0 |
| B | 0 | 130 | 0 |
| C | 0 | 130 | 0 |
| D | 0 | 130 | 0 |
| Mode M9 | |||
|---|---|---|---|
| Quadrant | BADHDUFLAG | Total packets | Discarded packets |
| A | 0 | 8 | 0 |
| B | 0 | 8 | 0 |
| C | 0 | 8 | 0 |
| D | 0 | 8 | 0 |
| Mode M0 | |||
|---|---|---|---|
| Quadrant | BADHDUFLAG | Total packets | Discarded packets |
| A | 0 | 14903 | 1 |
| B | 0 | 15300 | 1 |
| C | 0 | 26189 | 6 |
| D | 0 | 18349 | 6 |
| Quadrant | Total seconds | Saturated seconds | Saturation percentage |
|---|---|---|---|
| A | 6497 | 172 | 2.647376% |
| B | 6498 | 304 | 4.678363% |
| C | 6495 | 1158 | 17.829099% |
| D | 6496 | 333 | 5.126232% |
Noise dominated data is calculated using 1-second bins in cleaned event files. If a bin has >2000 counts, and if more than 50% of those come from <1% of pixels, then it is considered to be noise-dominated and hence unusable.
| Quadrant | # 1 sec bins | Bins with >0 counts | Bins with >2000 counts | High rate bins dominated by noise | Noise dominated (total time) | Noise dominated (detector-on time) | Marked lightcurve |
|---|---|---|---|---|---|---|---|
| A | 7250 | 6496 | 77 | 77 | 1.06% | 1.19% | 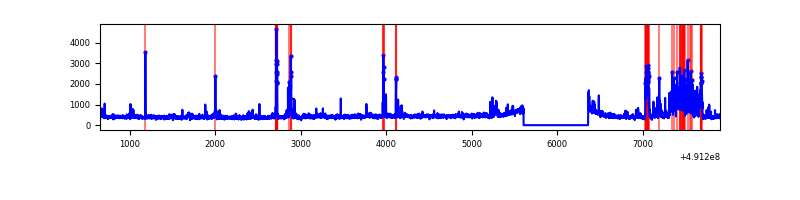 |
| B | 7251 | 6497 | 125 | 125 | 1.72% | 1.92% | 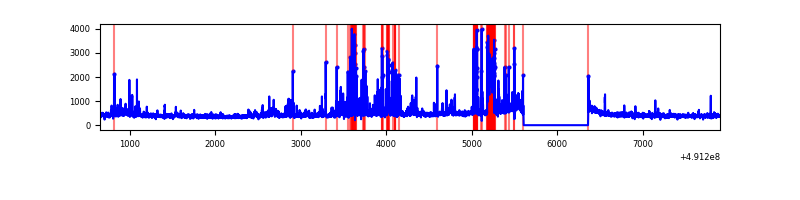 |
| C | 7251 | 6496 | 1091 | 1091 | 15.05% | 16.79% | 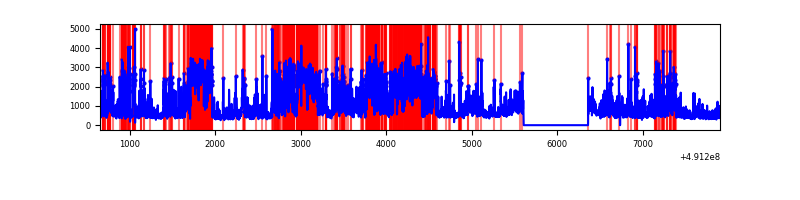 |
| D | 7251 | 6496 | 246 | 246 | 3.39% | 3.79% | 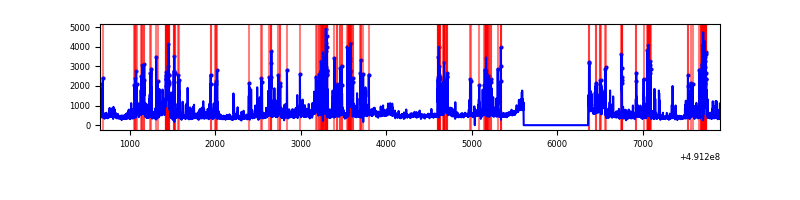 |
Top three noisy pixels from each quadrant. If the there are fewer than three noisy pixels in the level2.evt file, extra rows are filled as -1
| Pixel properties | Quadrant properties | ||||||
|---|---|---|---|---|---|---|---|
| Quadrant | DetID | PixID | Counts | Sigma | Mean | Median | Sigma |
| A | 12 | 3 | 390629 | 2346.15 | 668 | 651 | 166.2 |
| A | 0 | 8 | 108090 | 646.36 | 668 | 651 | 166.2 |
| A | 12 | 194 | 53441 | 317.59 | 668 | 651 | 166.2 |
| B | 2 | 249 | 389962 | 2800.67 | 655 | 630 | 139.0 |
| B | 1 | 255 | 133465 | 955.55 | 655 | 630 | 139.0 |
| B | 0 | 182 | 107138 | 766.17 | 655 | 630 | 139.0 |
| C | 0 | 240 | 2830664 | 16887.56 | 607 | 601 | 167.6 |
| C | 15 | 224 | 838629 | 5000.68 | 607 | 601 | 167.6 |
| C | 13 | 3 | 234383 | 1395.02 | 607 | 601 | 167.6 |
| D | 8 | 176 | 683163 | 3788.59 | 631 | 602 | 180.2 |
| D | 15 | 125 | 277707 | 1538.08 | 631 | 602 | 180.2 |
| D | 13 | 170 | 243121 | 1346.11 | 631 | 602 | 180.2 |
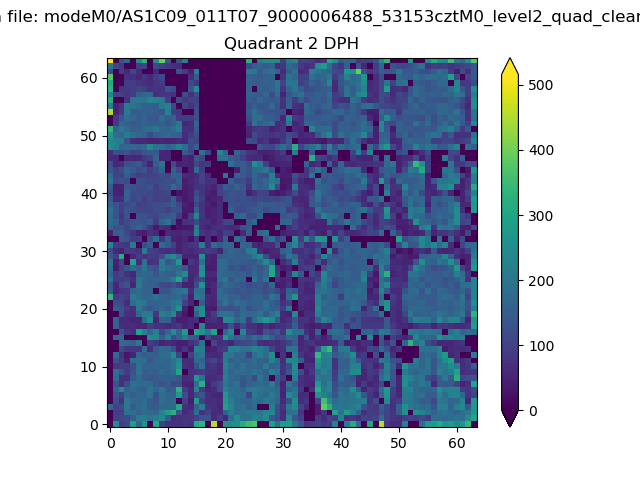
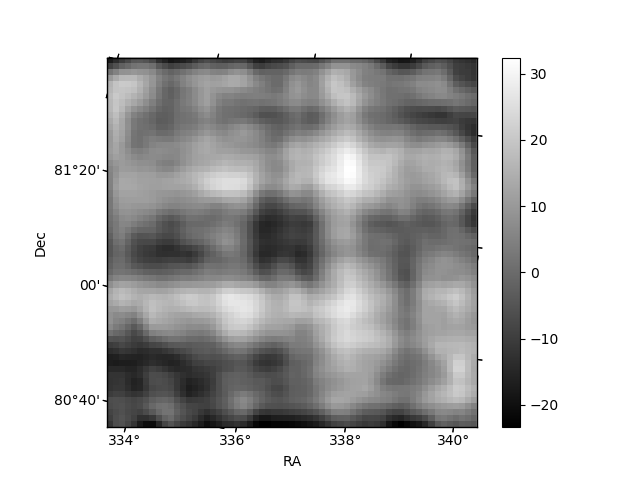
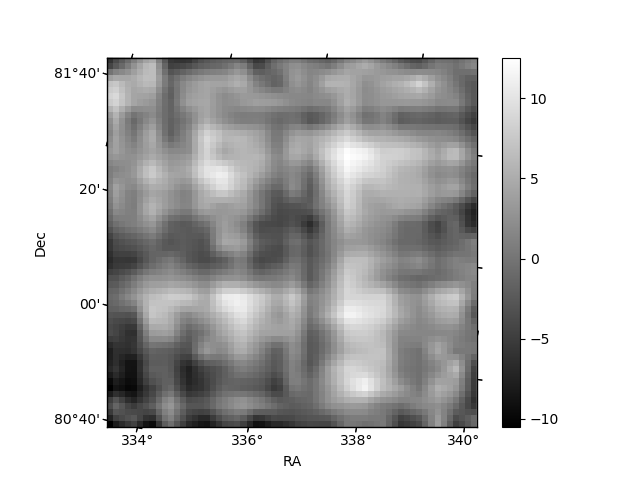
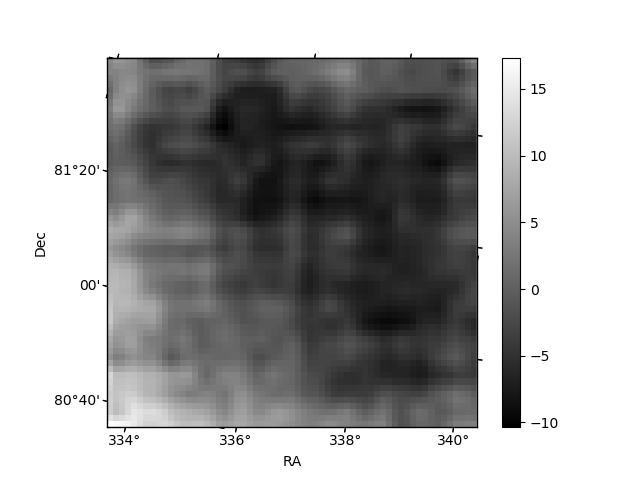
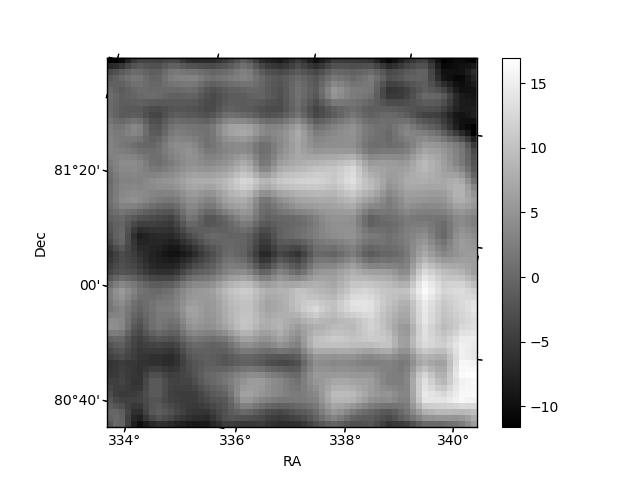
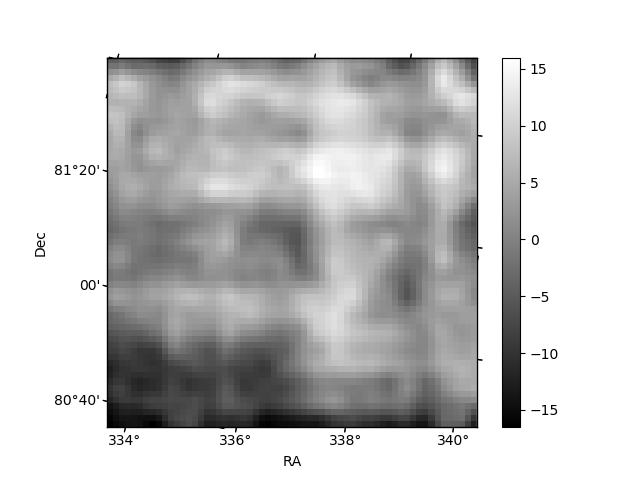
Histogram calculated using DETX and DETY for each event in the final _common_clean file
| Quadrant A | 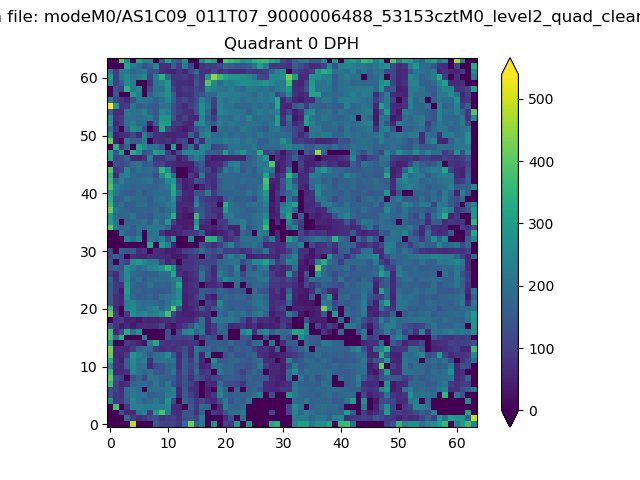 |
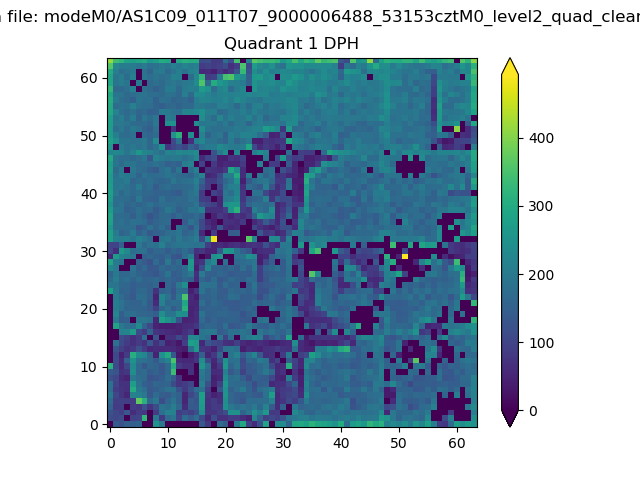 |
Quadrant B |
|---|---|---|---|
| Quadrant D | 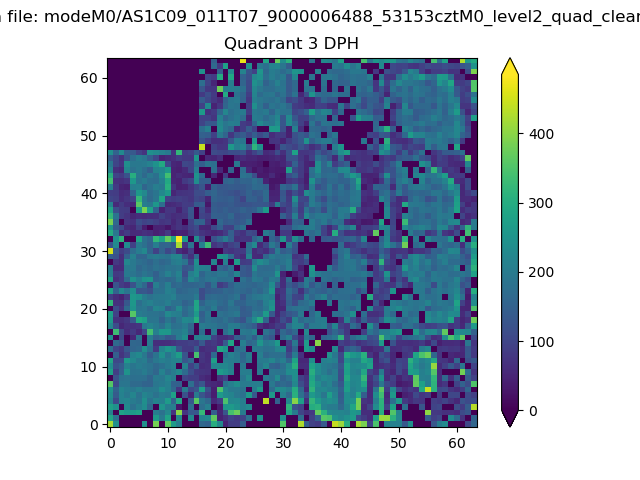 |
 |
Quadrant C |
| Plot type | Count rate plots | Images |
|---|---|---|
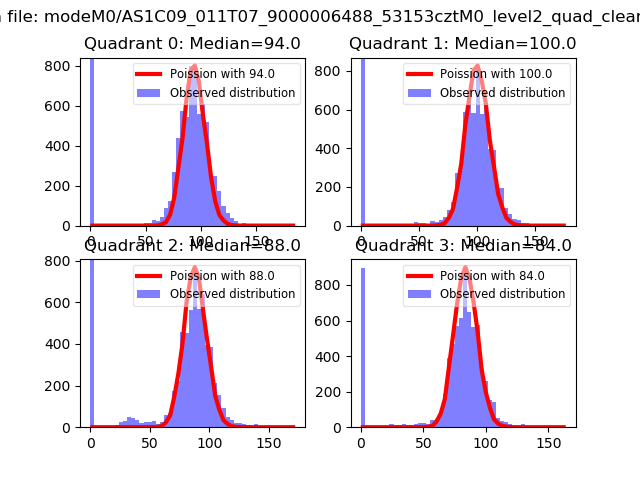
| Comparison with Poisson distribution Blue bars denote a histogram of data divided into 1 sec bins. Red curve is a Poisson curve with rate = median count rate of data. |
 |
 |
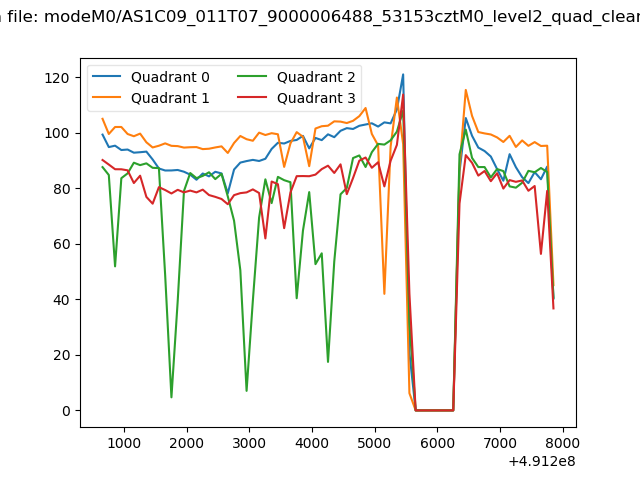
| Quadrant-wise count rates Data is divided into 100 sec bins |
 |
|
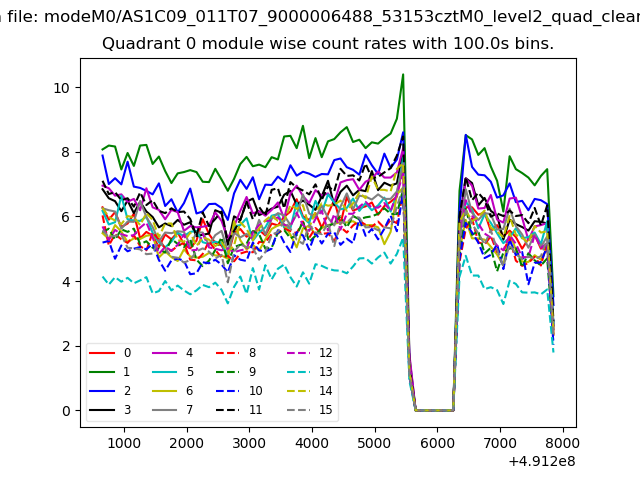
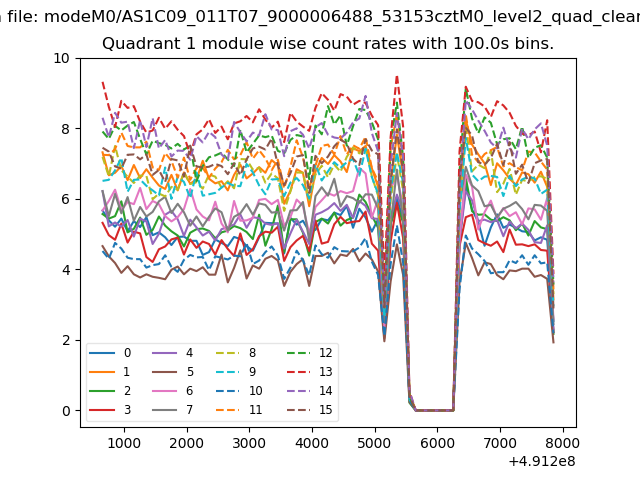
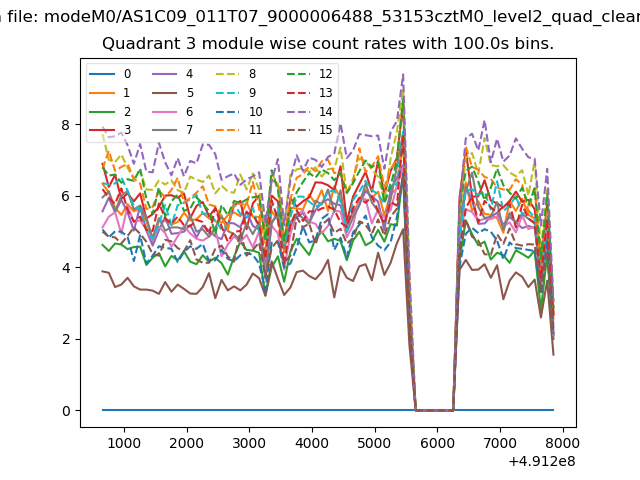
| Module-wise count rates for Quadrant A Data is divided into 100 sec bins |
 |
 |
| Module-wise count rates for Quadrant B Data is divided into 100 sec bins |
 |
 |
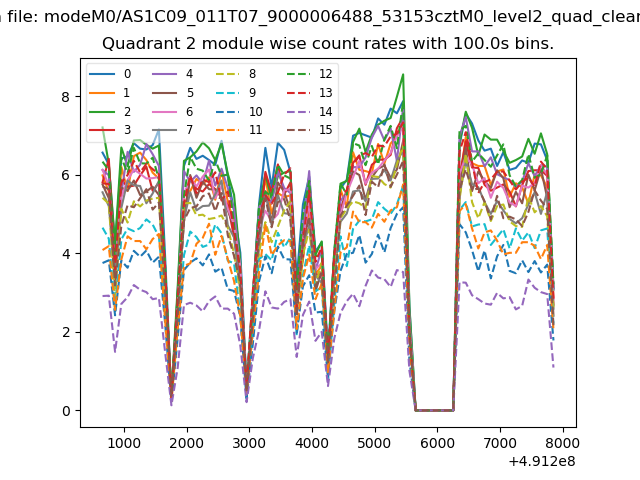
| Module-wise count rates for Quadrant C Data is divided into 100 sec bins |
 |
 |
| Module-wise count rates for Quadrant D Data is divided into 100 sec bins |
 |
 |
| Parameter | Plot |
|---|---|
| CZT HV Monitor |  |
| D_VDD | 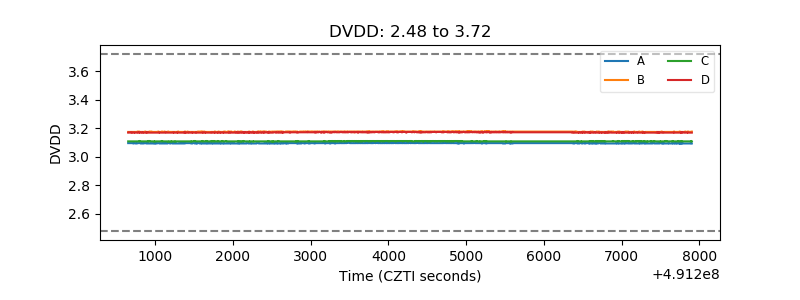 |
| Temperature 1 | 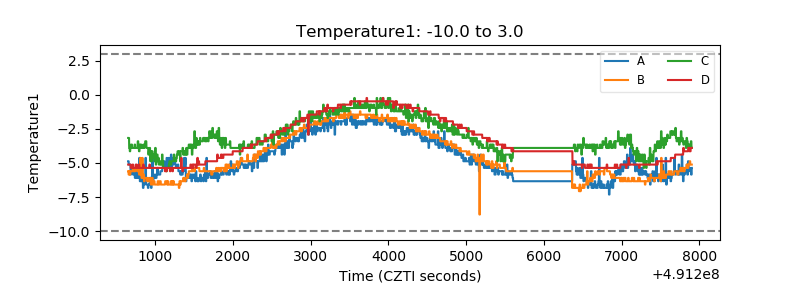 |
| Veto HV Monitor | 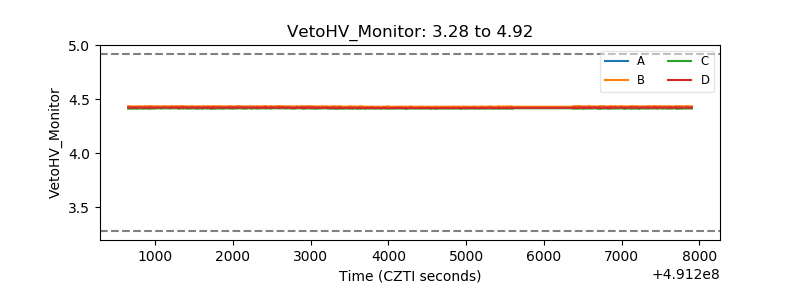 |
| Veto LLD | 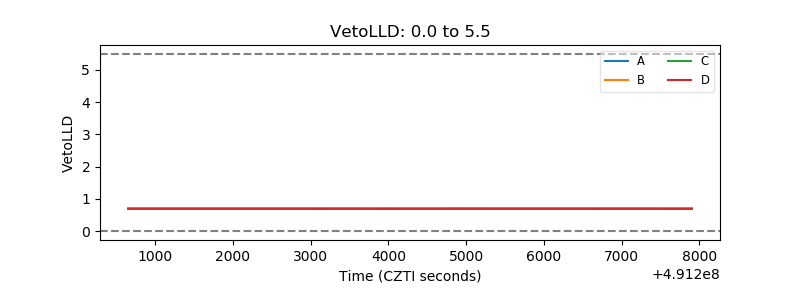 |
| Alpha Counter | 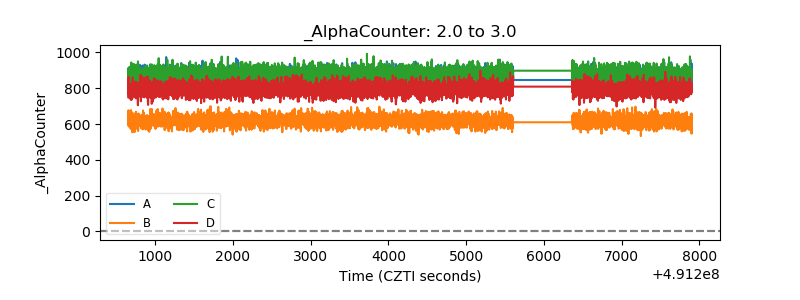 |
| _CPM_Rate | 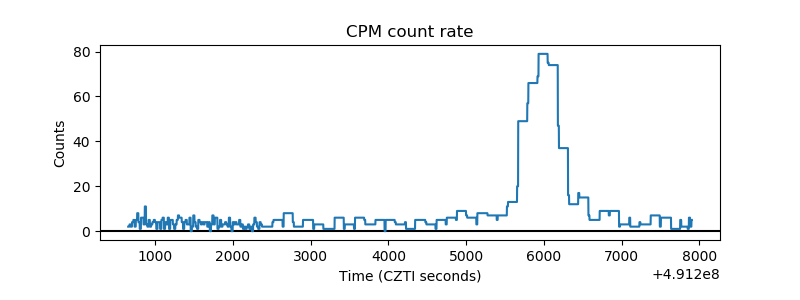 |
| CZT Counter | 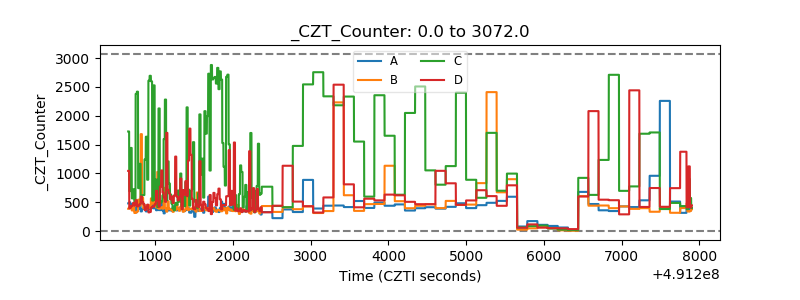 |
| +2.5 Volts monitor |  |
| +5 Volts monitor |  |
| _ROLL_ROT | 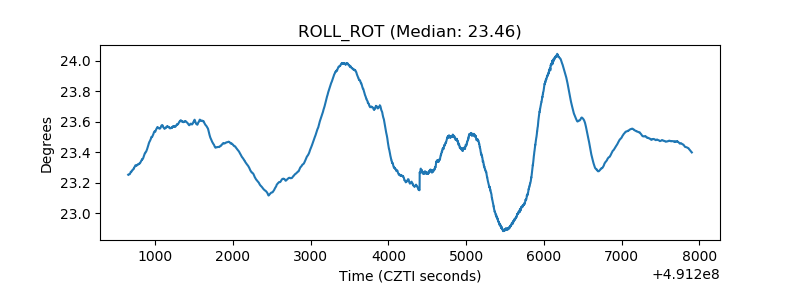 |
| _Roll_DEC | 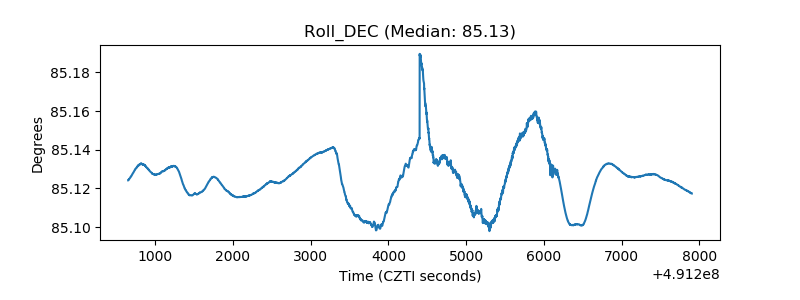 |
| _Roll_RA | 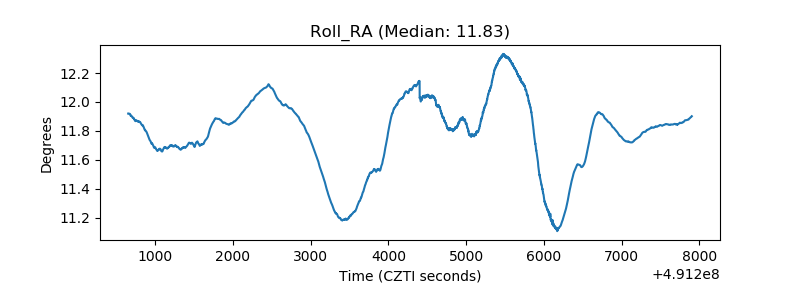 |
| Veto Counter | 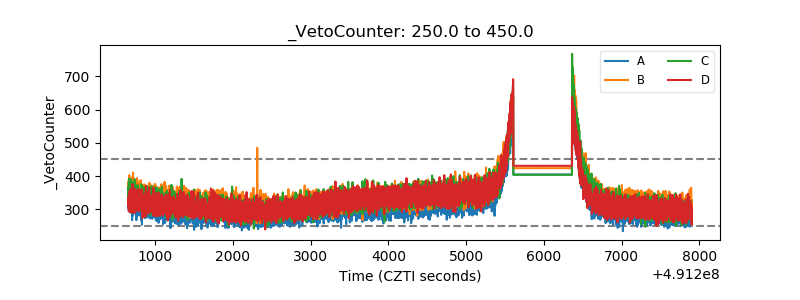 |