| Param | Original file | Final file |
|---|---|---|
| Filename | modeM0/AS1C09_011T07_9000006488_53154cztM0_level2.fits | modeM0/AS1C09_011T07_9000006488_53154cztM0_level2_quad_clean.evt |
| Size (bytes) | 543,343,680 | 103,884,480 |
| Size | 518.2 MB | 99.1 MB |
| Events in quadrant A | 3,904,933 | 677,354 |
| Events in quadrant B | 4,094,681 | 726,042 |
| Events in quadrant C | 6,209,652 | 629,260 |
| Events in quadrant D | 5,332,188 | 600,522 |
| Mode SS | |||
|---|---|---|---|
| Quadrant | BADHDUFLAG | Total packets | Discarded packets |
| A | 0 | 148 | 0 |
| B | 0 | 148 | 0 |
| C | 0 | 148 | 0 |
| D | 0 | 148 | 0 |
| Mode M9 | |||
|---|---|---|---|
| Quadrant | BADHDUFLAG | Total packets | Discarded packets |
| A | 0 | 3 | 0 |
| B | 0 | 3 | 0 |
| C | 0 | 3 | 0 |
| D | 0 | 3 | 0 |
| Mode M0 | |||
|---|---|---|---|
| Quadrant | BADHDUFLAG | Total packets | Discarded packets |
| A | 0 | 17219 | 1 |
| B | 0 | 17715 | 1 |
| C | 0 | 23695 | 1 |
| D | 0 | 21029 | 1 |
| Quadrant | Total seconds | Saturated seconds | Saturation percentage |
|---|---|---|---|
| A | 7364 | 220 | 2.987507% |
| B | 7364 | 221 | 3.001086% |
| C | 7364 | 448 | 6.083650% |
| D | 7364 | 410 | 5.567626% |
Noise dominated data is calculated using 1-second bins in cleaned event files. If a bin has >2000 counts, and if more than 50% of those come from <1% of pixels, then it is considered to be noise-dominated and hence unusable.
| Quadrant | # 1 sec bins | Bins with >0 counts | Bins with >2000 counts | High rate bins dominated by noise | Noise dominated (total time) | Noise dominated (detector-on time) | Marked lightcurve |
|---|---|---|---|---|---|---|---|
| A | 7629 | 7365 | 107 | 107 | 1.40% | 1.45% | 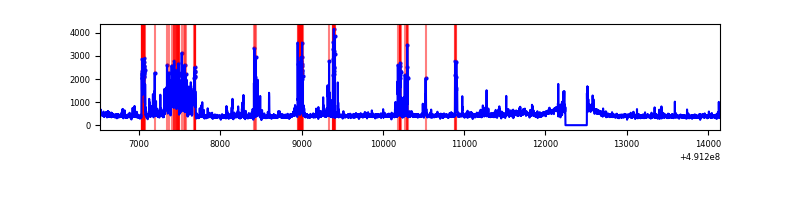 |
| B | 7629 | 7365 | 65 | 65 | 0.85% | 0.88% | 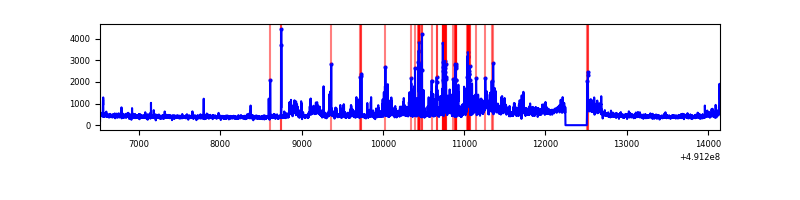 |
| C | 7629 | 7365 | 345 | 345 | 4.52% | 4.68% | 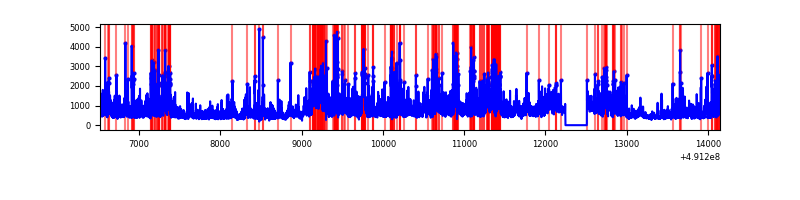 |
| D | 7629 | 7365 | 329 | 329 | 4.31% | 4.47% | 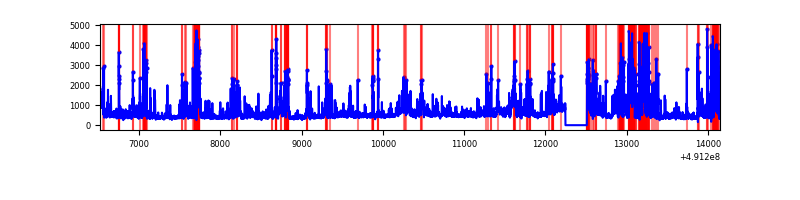 |
Top three noisy pixels from each quadrant. If the there are fewer than three noisy pixels in the level2.evt file, extra rows are filled as -1
| Pixel properties | Quadrant properties | ||||||
|---|---|---|---|---|---|---|---|
| Quadrant | DetID | PixID | Counts | Sigma | Mean | Median | Sigma |
| A | 12 | 3 | 446385 | 2362.15 | 759 | 742 | 188.7 |
| A | 0 | 8 | 300285 | 1587.74 | 759 | 742 | 188.7 |
| A | 12 | 194 | 61357 | 321.29 | 759 | 742 | 188.7 |
| B | 10 | 254 | 402648 | 2518.69 | 748 | 722 | 159.6 |
| B | 2 | 249 | 180474 | 1126.42 | 748 | 722 | 159.6 |
| B | 4 | 81 | 149249 | 930.75 | 748 | 722 | 159.6 |
| C | 15 | 224 | 1201934 | 6055.42 | 720 | 712 | 198.4 |
| C | 7 | 80 | 550533 | 2771.67 | 720 | 712 | 198.4 |
| C | 0 | 240 | 462301 | 2326.89 | 720 | 712 | 198.4 |
| D | 8 | 176 | 1298171 | 6426.32 | 718 | 686 | 201.9 |
| D | 10 | 172 | 263098 | 1299.7 | 718 | 686 | 201.9 |
| D | 2 | 120 | 227462 | 1123.2 | 718 | 686 | 201.9 |
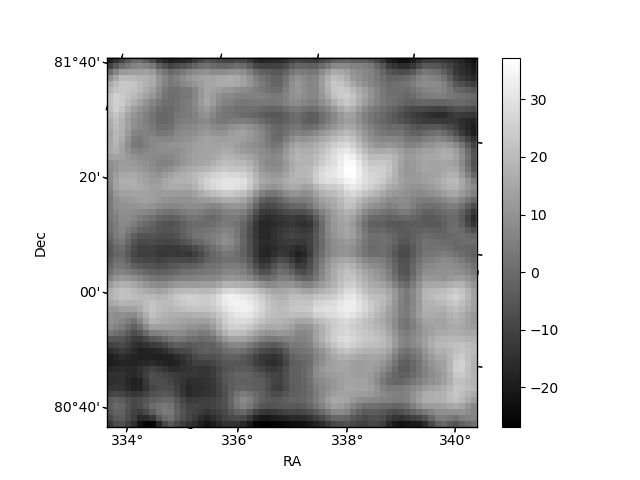
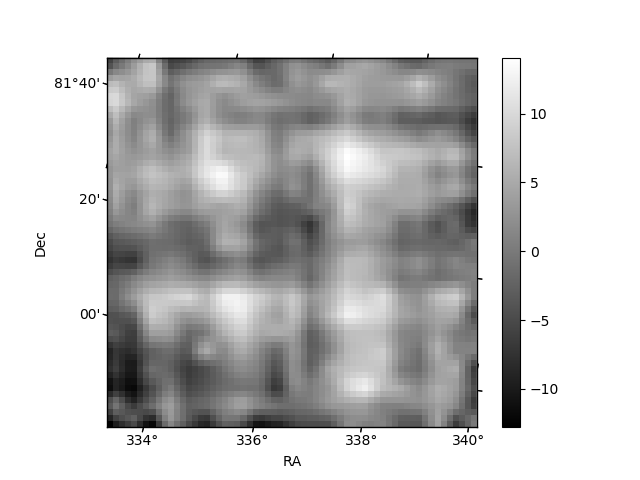
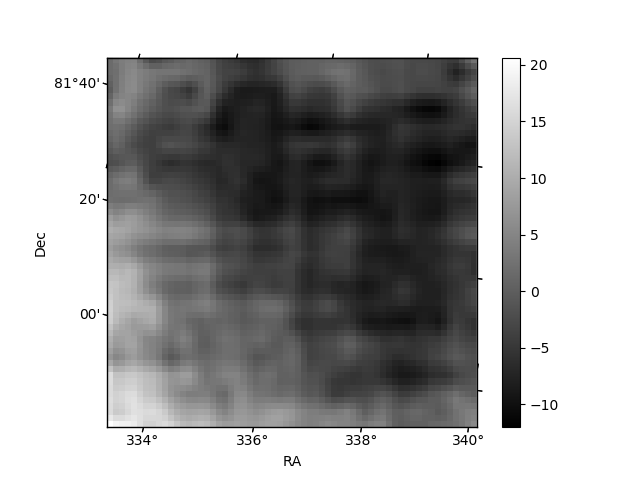
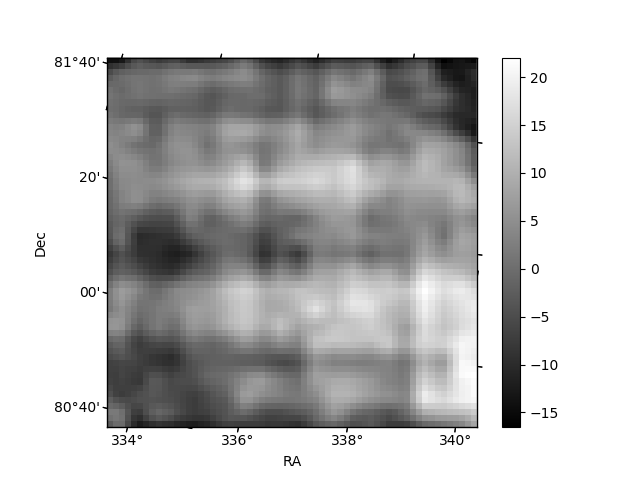
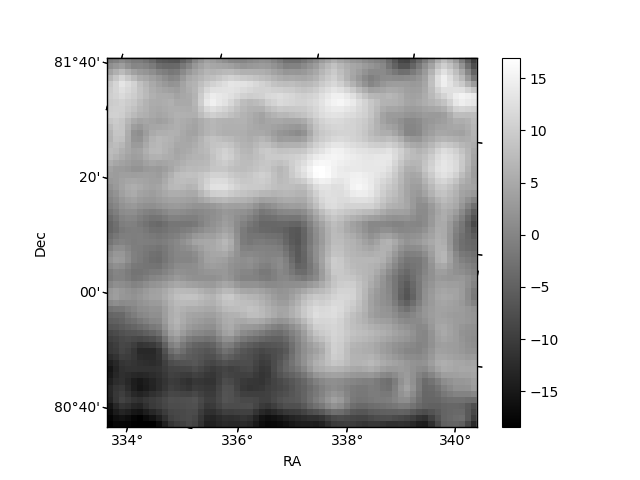
Histogram calculated using DETX and DETY for each event in the final _common_clean file
| Quadrant A | 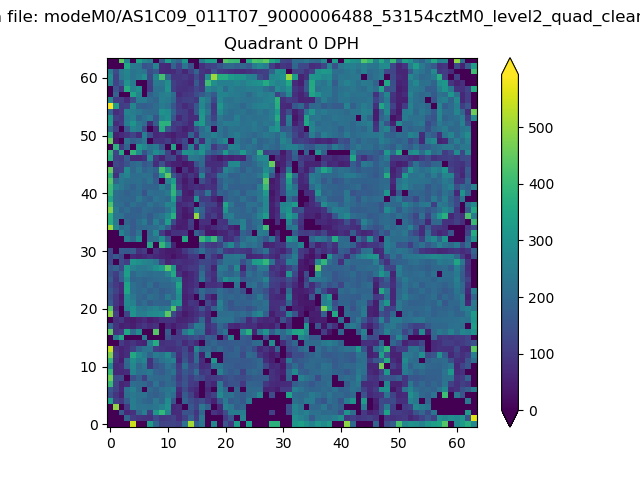 |
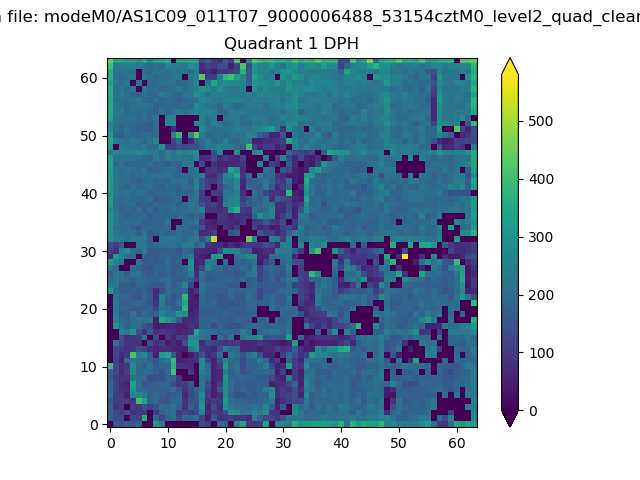 |
Quadrant B |
|---|---|---|---|
| Quadrant D | 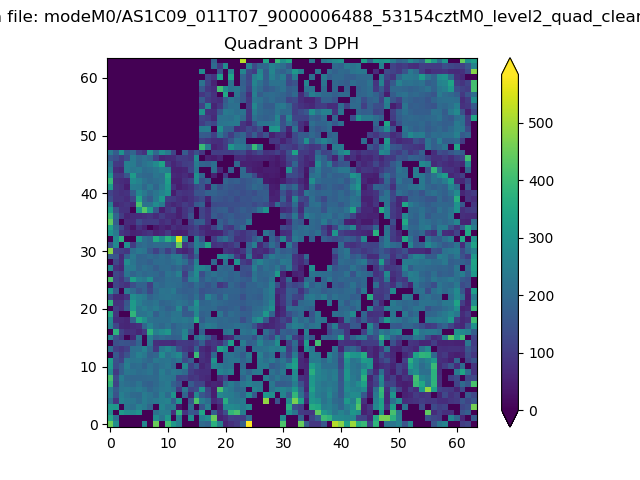 |
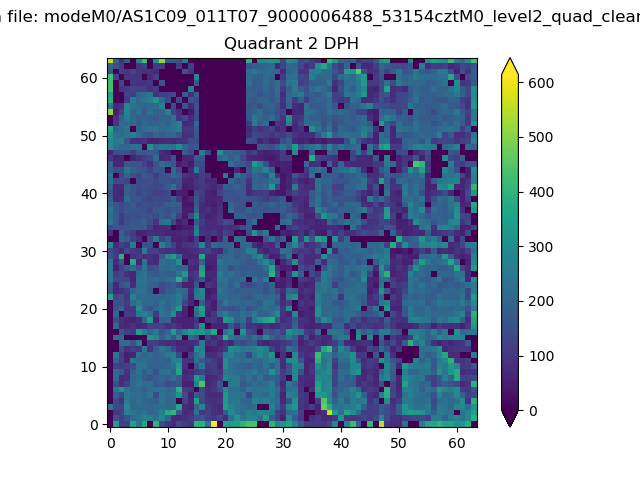 |
Quadrant C |
| Plot type | Count rate plots | Images |
|---|---|---|
| Comparison with Poisson distribution Blue bars denote a histogram of data divided into 1 sec bins. Red curve is a Poisson curve with rate = median count rate of data. |
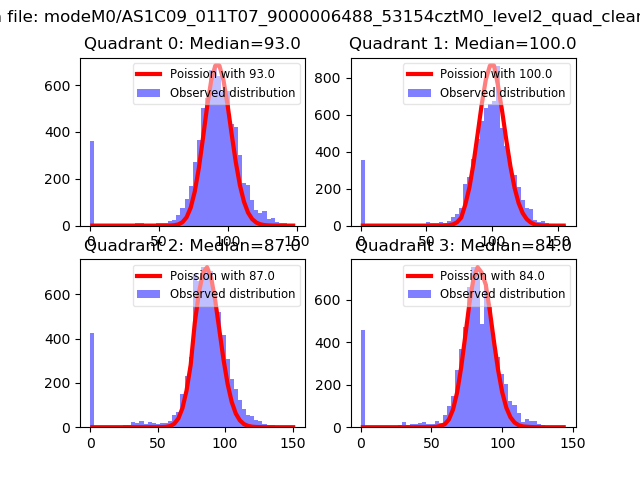 |
 |
| Quadrant-wise count rates Data is divided into 100 sec bins |
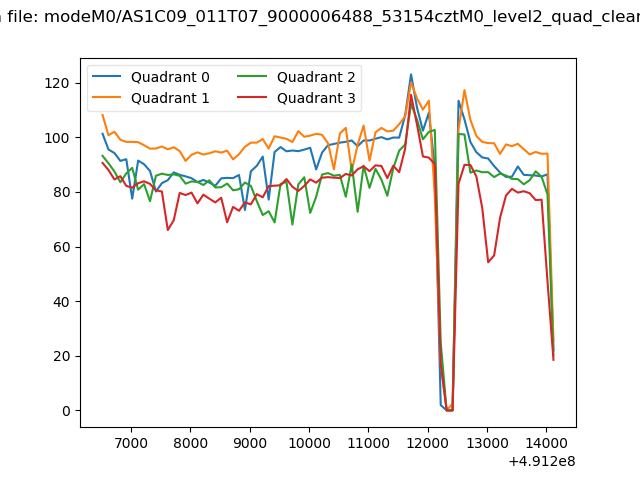 |
|
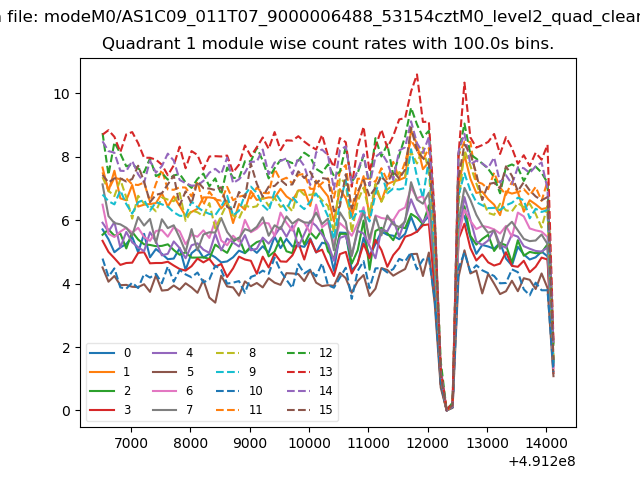
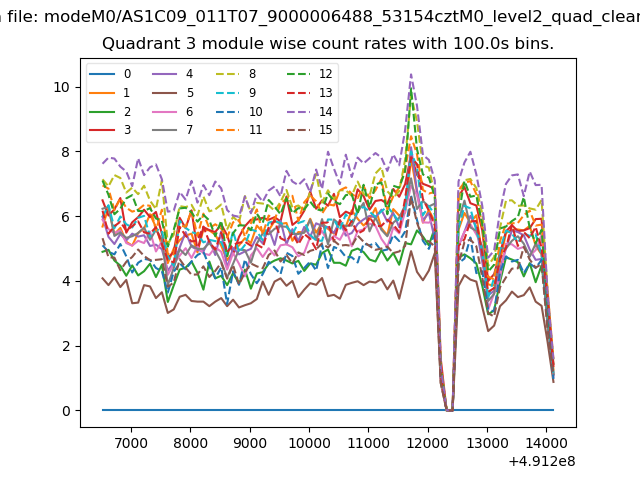
| Module-wise count rates for Quadrant A Data is divided into 100 sec bins |
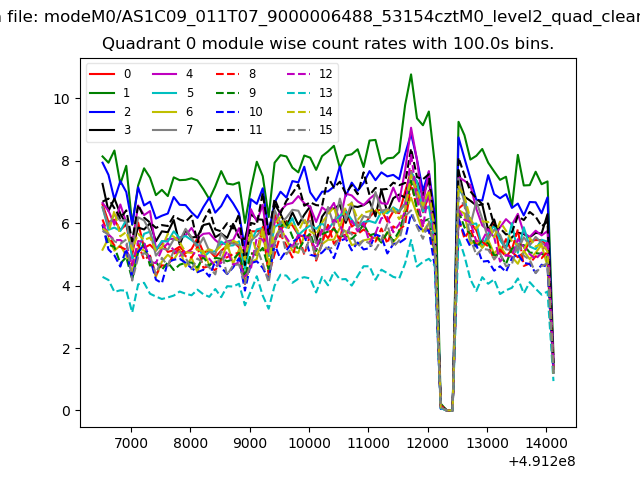 |
 |
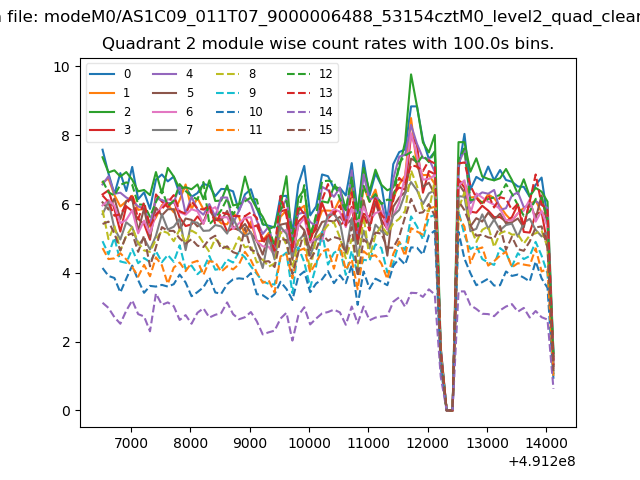
| Module-wise count rates for Quadrant B Data is divided into 100 sec bins |
 |
 |
| Module-wise count rates for Quadrant C Data is divided into 100 sec bins |
 |
 |
| Module-wise count rates for Quadrant D Data is divided into 100 sec bins |
 |
 |
| Parameter | Plot |
|---|---|
| CZT HV Monitor | 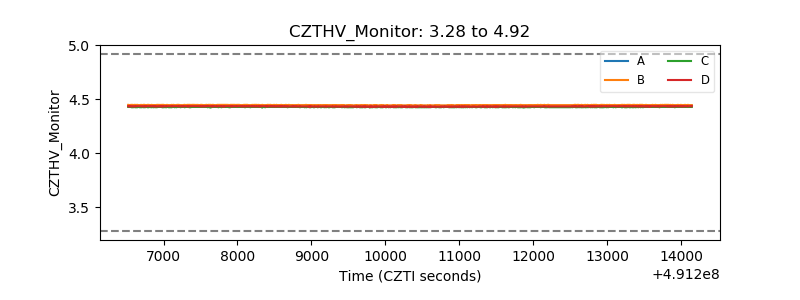 |
| D_VDD | 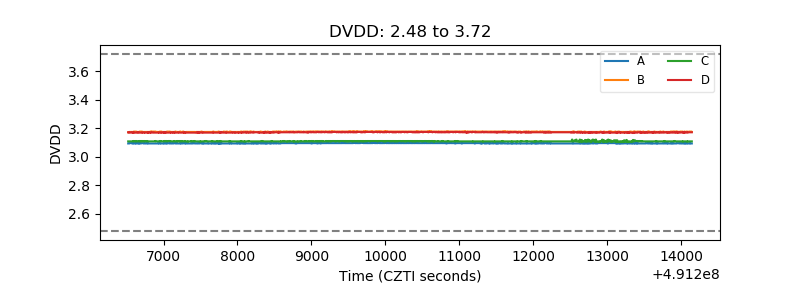 |
| Temperature 1 | 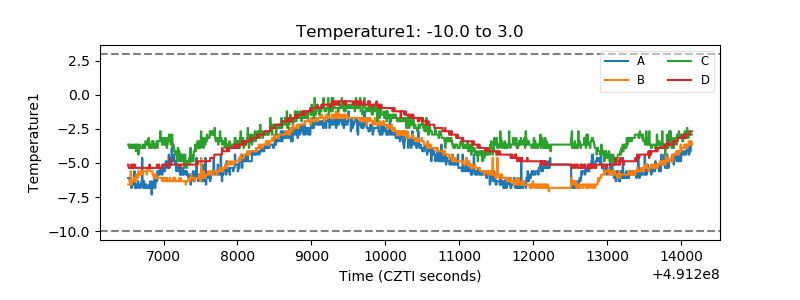 |
| Veto HV Monitor | 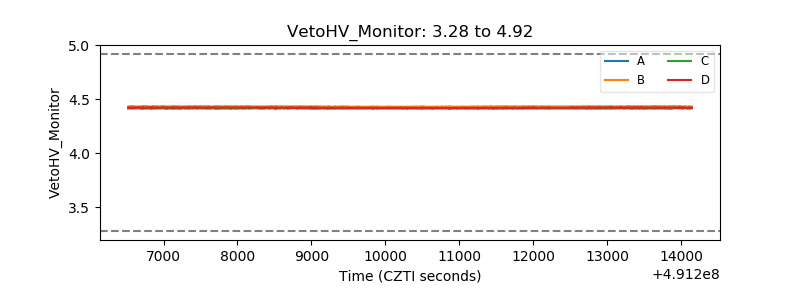 |
| Veto LLD | 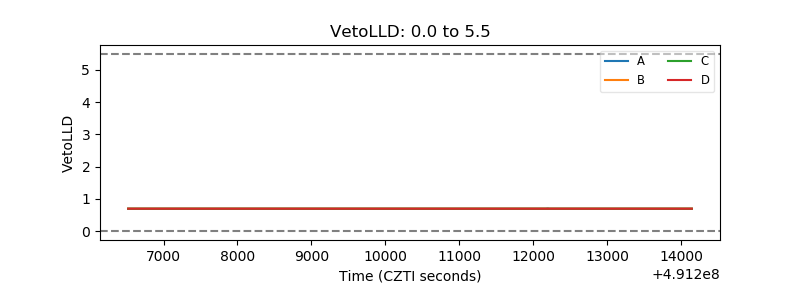 |
| Alpha Counter | 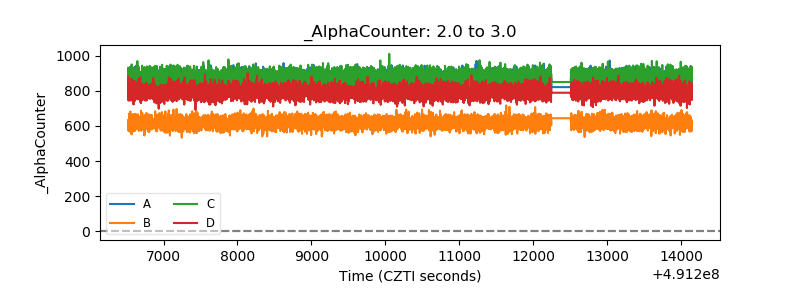 |
| _CPM_Rate | 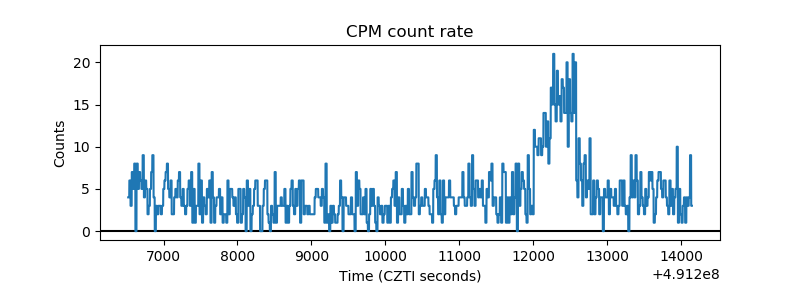 |
| CZT Counter | 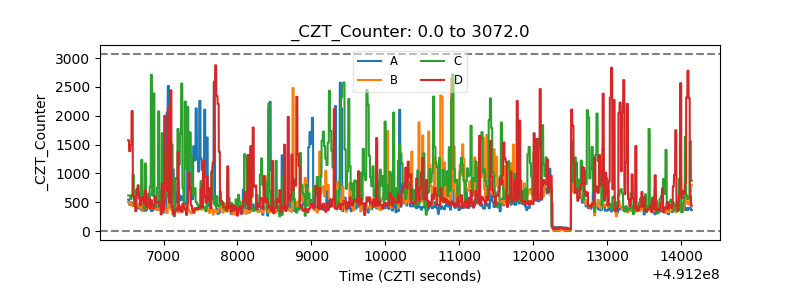 |
| +2.5 Volts monitor |  |
| +5 Volts monitor | 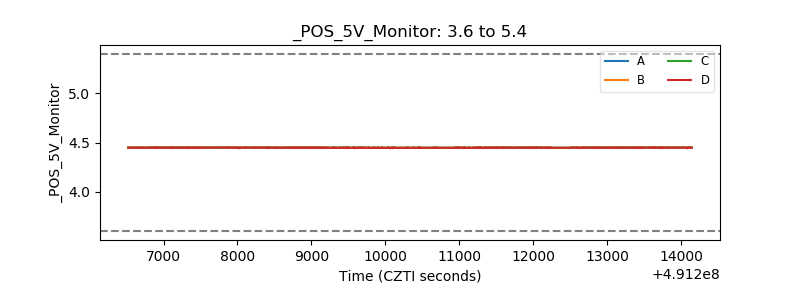 |
| _ROLL_ROT | 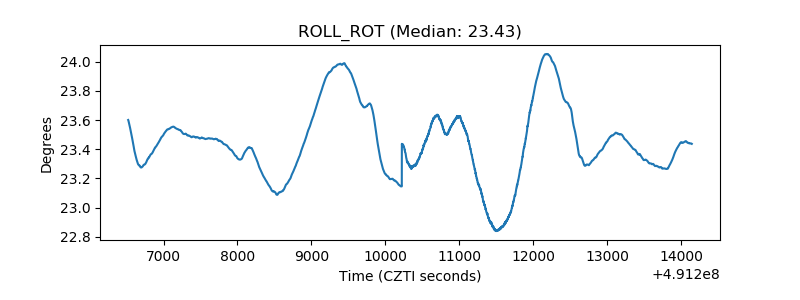 |
| _Roll_DEC | 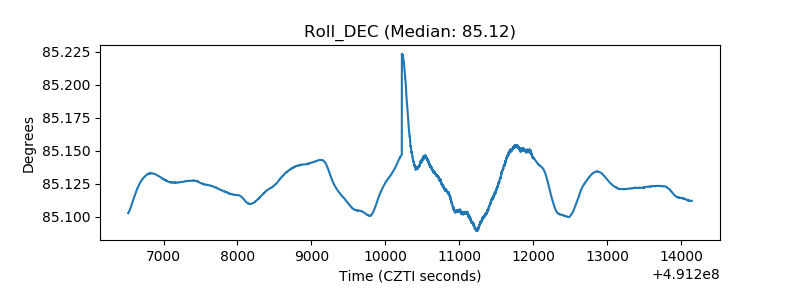 |
| _Roll_RA | 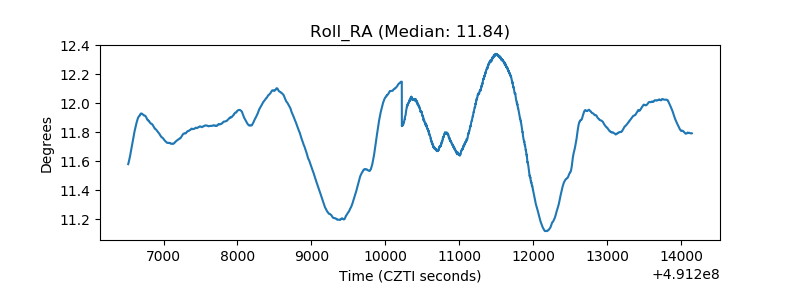 |
| Veto Counter | 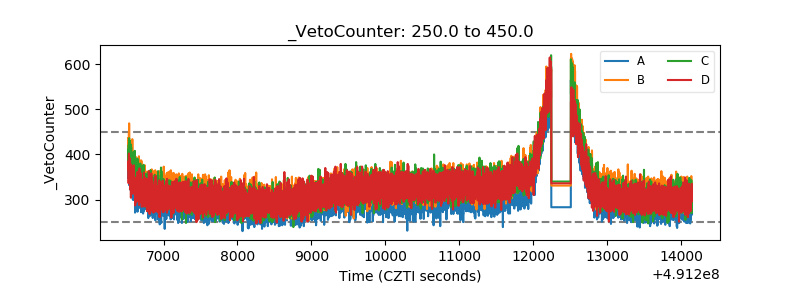 |