| Param | Original file | Final file |
|---|---|---|
| Filename | modeM0/AS1C09_011T07_9000006488_53156cztM0_level2.fits | modeM0/AS1C09_011T07_9000006488_53156cztM0_level2_quad_clean.evt |
| Size (bytes) | 767,122,560 | 94,325,760 |
| Size | 731.6 MB | 90.0 MB |
| Events in quadrant A | 5,134,089 | 649,081 |
| Events in quadrant B | 7,154,265 | 651,428 |
| Events in quadrant C | 11,272,208 | 440,195 |
| Events in quadrant D | 4,269,244 | 605,329 |
| Mode SS | |||
|---|---|---|---|
| Quadrant | BADHDUFLAG | Total packets | Discarded packets |
| A | 0 | 146 | 0 |
| B | 0 | 146 | 0 |
| C | 0 | 146 | 0 |
| D | 0 | 146 | 0 |
| Mode M0 | |||
|---|---|---|---|
| Quadrant | BADHDUFLAG | Total packets | Discarded packets |
| A | 0 | 20430 | 0 |
| B | 0 | 26433 | 0 |
| C | 0 | 38604 | 0 |
| D | 0 | 17952 | 0 |
| Quadrant | Total seconds | Saturated seconds | Saturation percentage |
|---|---|---|---|
| A | 7321 | 395 | 5.395438% |
| B | 7322 | 978 | 13.357006% |
| C | 7322 | 2559 | 34.949467% |
| D | 7322 | 108 | 1.475007% |
Noise dominated data is calculated using 1-second bins in cleaned event files. If a bin has >2000 counts, and if more than 50% of those come from <1% of pixels, then it is considered to be noise-dominated and hence unusable.
| Quadrant | # 1 sec bins | Bins with >0 counts | Bins with >2000 counts | High rate bins dominated by noise | Noise dominated (total time) | Noise dominated (detector-on time) | Marked lightcurve |
|---|---|---|---|---|---|---|---|
| A | 7321 | 7321 | 357 | 357 | 4.88% | 4.88% | 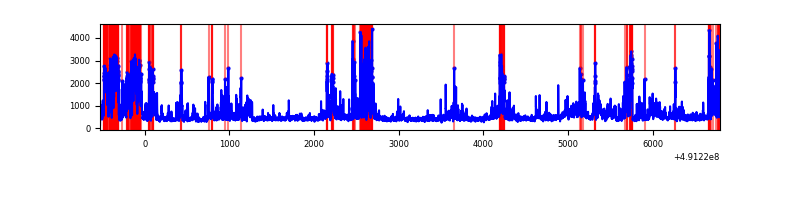 |
| B | 7322 | 7322 | 719 | 719 | 9.82% | 9.82% | 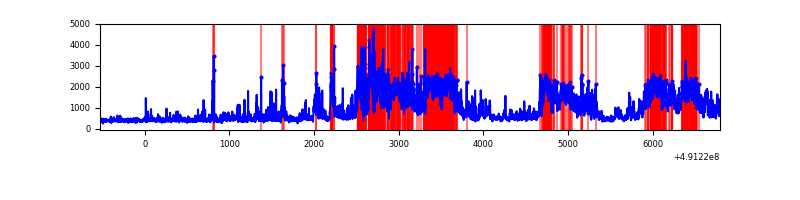 |
| C | 7322 | 7322 | 2305 | 2305 | 31.48% | 31.48% | 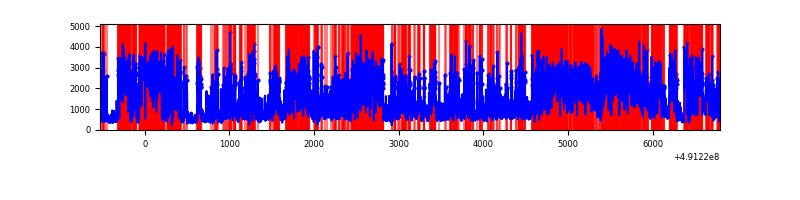 |
| D | 7322 | 7322 | 115 | 115 | 1.57% | 1.57% | 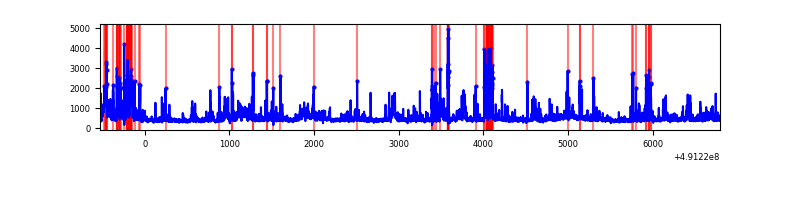 |
Top three noisy pixels from each quadrant. If the there are fewer than three noisy pixels in the level2.evt file, extra rows are filled as -1
| Pixel properties | Quadrant properties | ||||||
|---|---|---|---|---|---|---|---|
| Quadrant | DetID | PixID | Counts | Sigma | Mean | Median | Sigma |
| A | 12 | 3 | 1022905 | 5540.03 | 737 | 717 | 184.5 |
| A | 0 | 8 | 482659 | 2612.02 | 737 | 717 | 184.5 |
| A | 3 | 62 | 157152 | 847.84 | 737 | 717 | 184.5 |
| B | 10 | 254 | 3471045 | 22506.83 | 716 | 693 | 154.2 |
| B | 2 | 249 | 401359 | 2598.5 | 716 | 693 | 154.2 |
| B | 4 | 81 | 132748 | 856.43 | 716 | 693 | 154.2 |
| C | 1 | 241 | 3927731 | 22920.3 | 617 | 611 | 171.3 |
| C | 15 | 157 | 1793947 | 10466.65 | 617 | 611 | 171.3 |
| C | 15 | 224 | 1620609 | 9454.98 | 617 | 611 | 171.3 |
| D | 8 | 176 | 315233 | 1546.28 | 717 | 684 | 203.4 |
| D | 12 | 3 | 208847 | 1023.3 | 717 | 684 | 203.4 |
| D | 10 | 172 | 164210 | 803.87 | 717 | 684 | 203.4 |
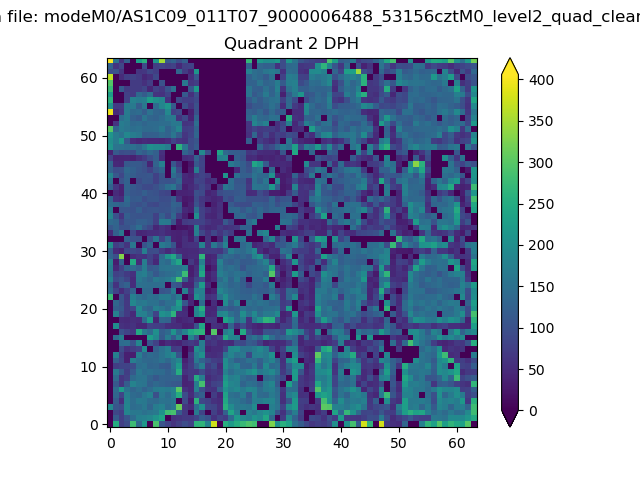
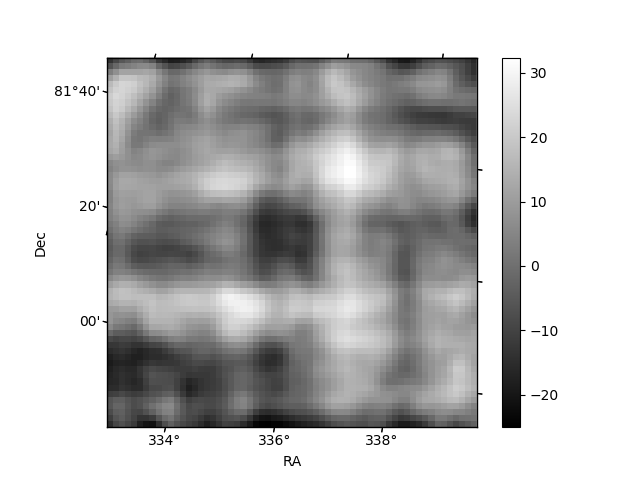
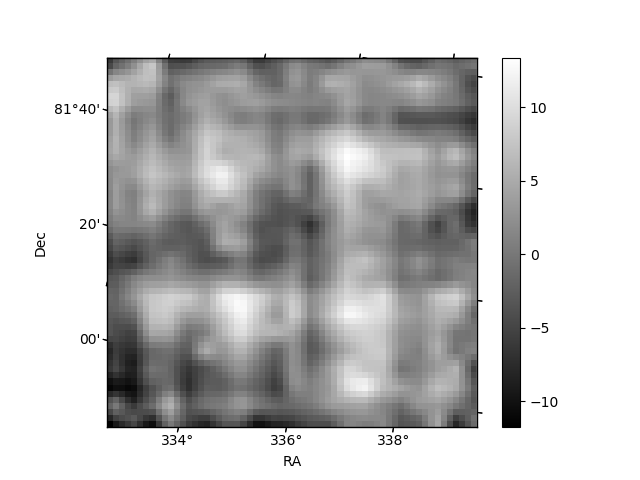
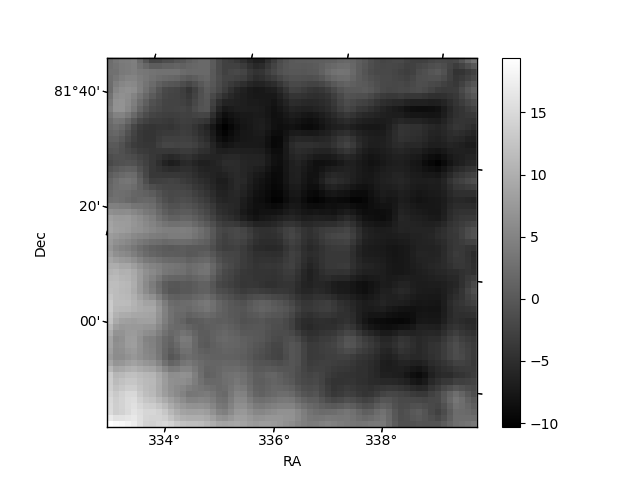
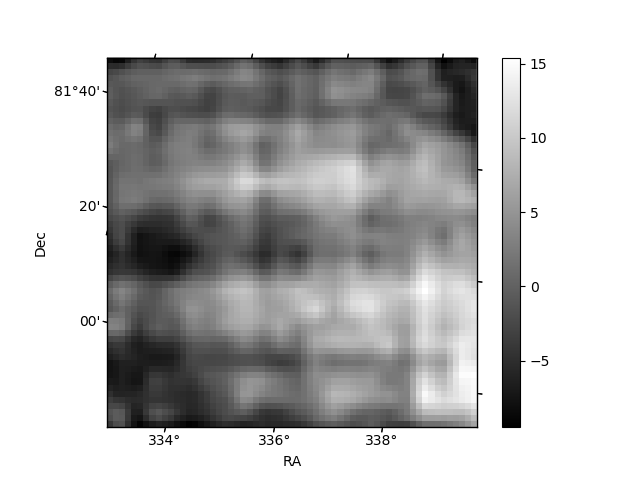
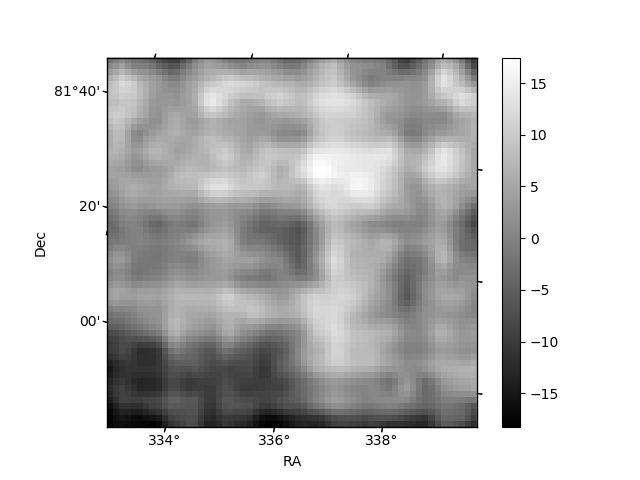
Histogram calculated using DETX and DETY for each event in the final _common_clean file
| Quadrant A | 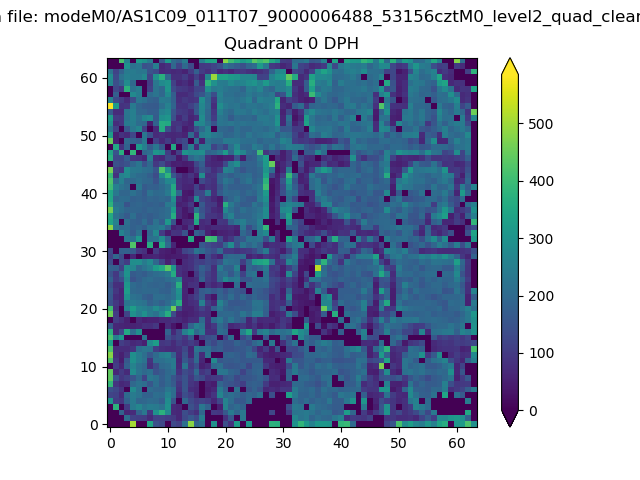 |
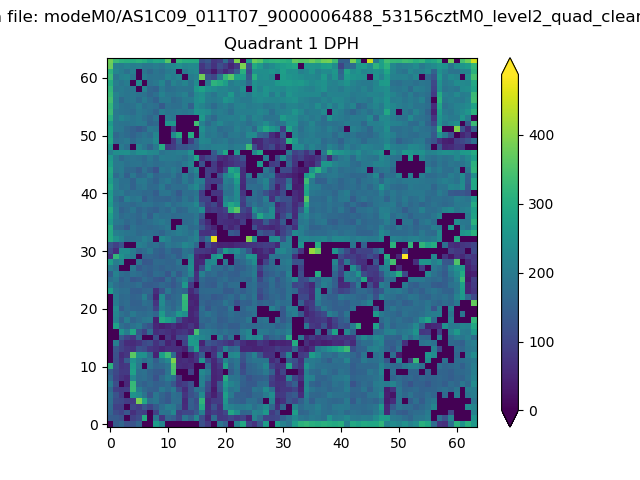 |
Quadrant B |
|---|---|---|---|
| Quadrant D | 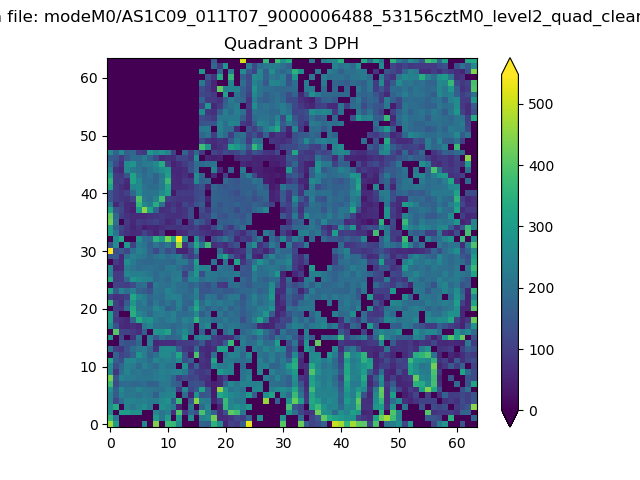 |
 |
Quadrant C |
| Plot type | Count rate plots | Images |
|---|---|---|
| Comparison with Poisson distribution Blue bars denote a histogram of data divided into 1 sec bins. Red curve is a Poisson curve with rate = median count rate of data. |
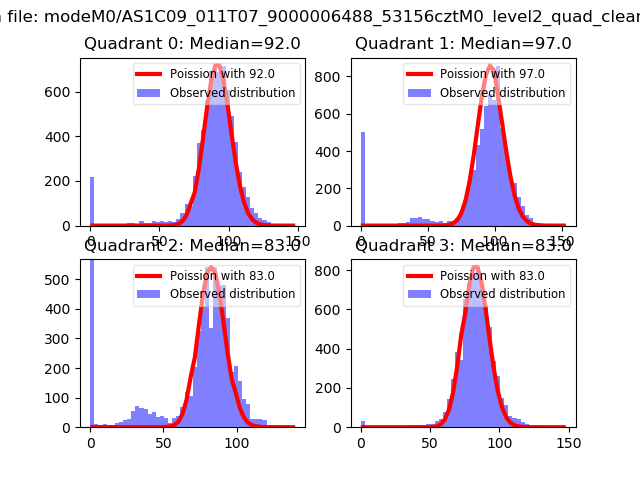 |
 |
| Quadrant-wise count rates Data is divided into 100 sec bins |
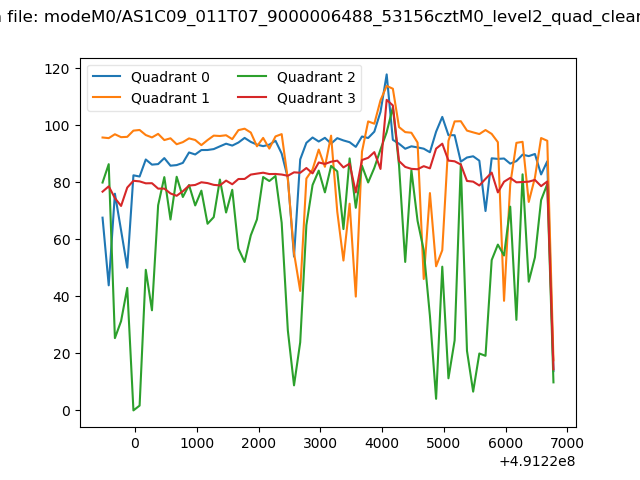 |
|
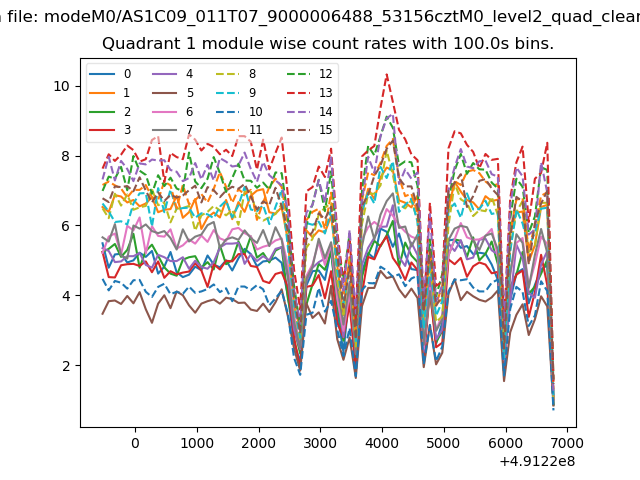
| Module-wise count rates for Quadrant A Data is divided into 100 sec bins |
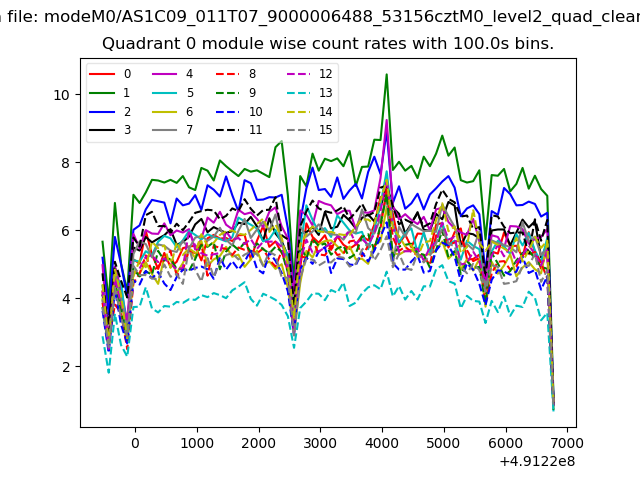 |
 |
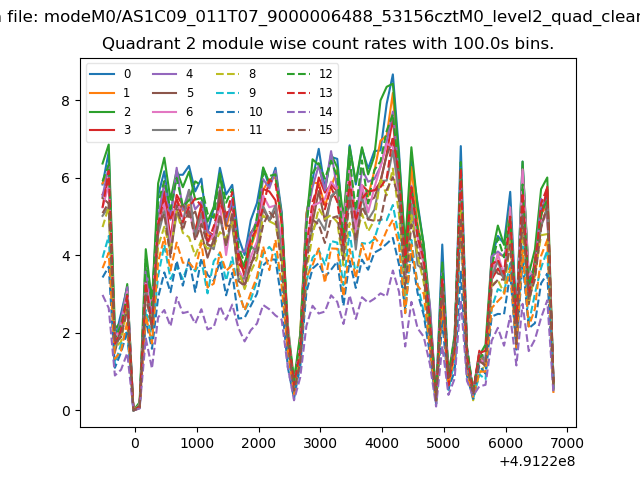
| Module-wise count rates for Quadrant B Data is divided into 100 sec bins |
 |
 |
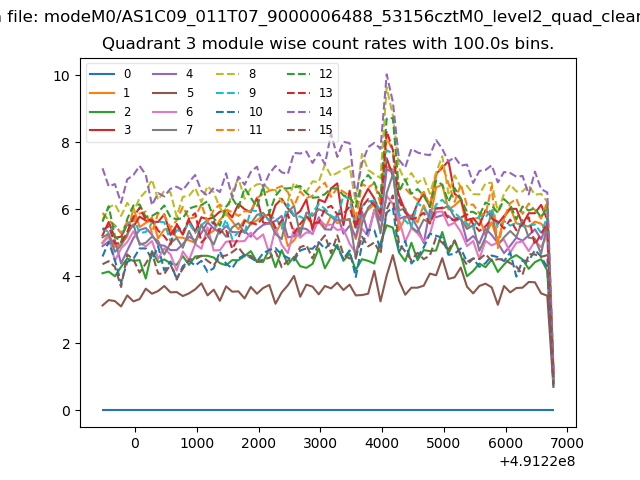
| Module-wise count rates for Quadrant C Data is divided into 100 sec bins |
 |
 |
| Module-wise count rates for Quadrant D Data is divided into 100 sec bins |
 |
 |
| Parameter | Plot |
|---|---|
| CZT HV Monitor | 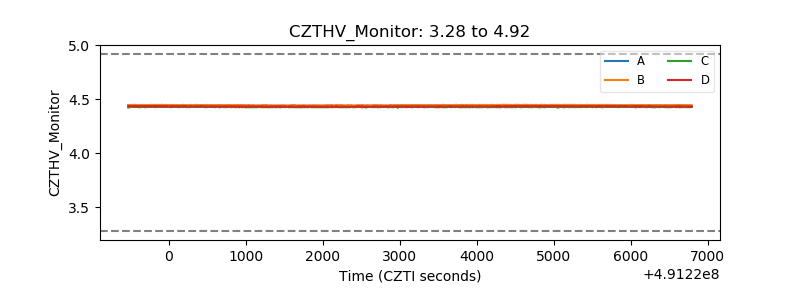 |
| D_VDD | 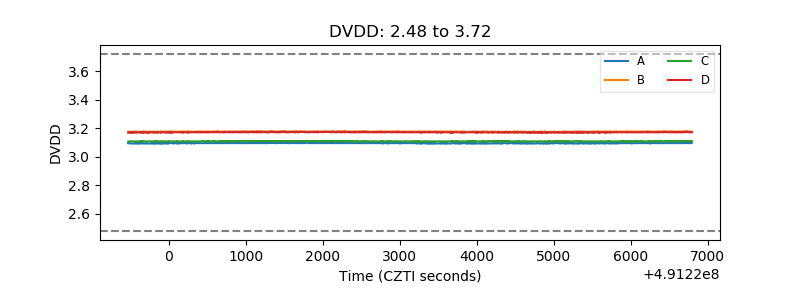 |
| Temperature 1 | 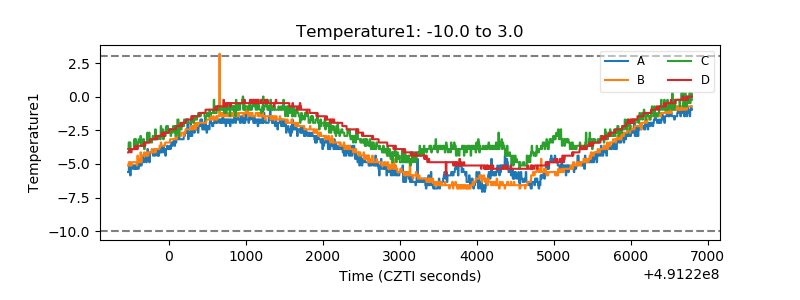 |
| Veto HV Monitor | 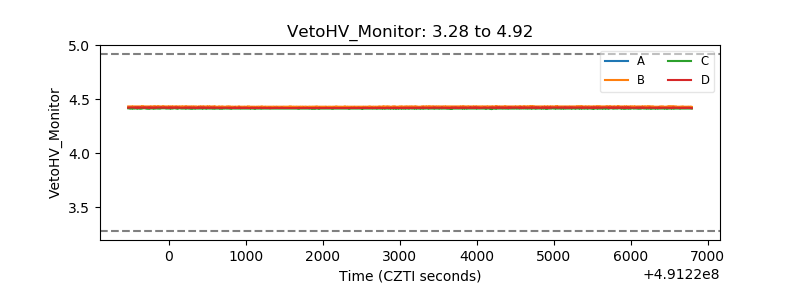 |
| Veto LLD | 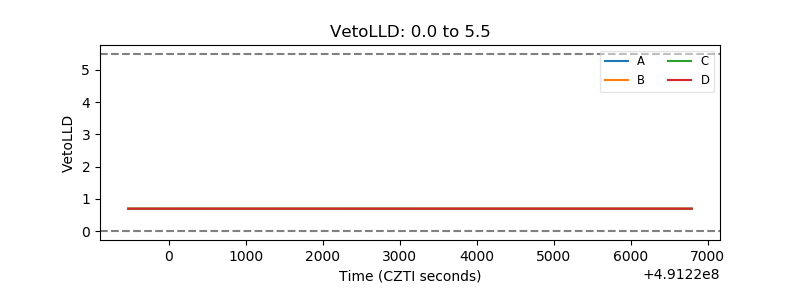 |
| Alpha Counter | 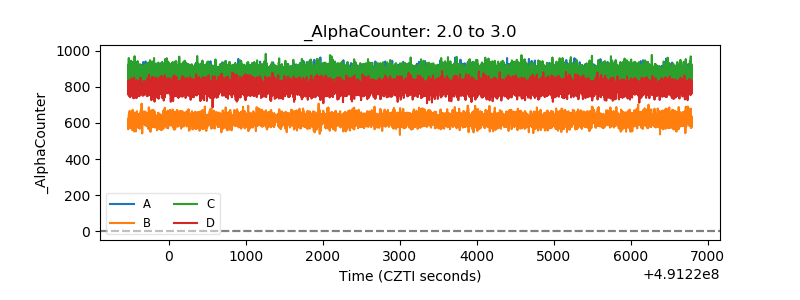 |
| _CPM_Rate | 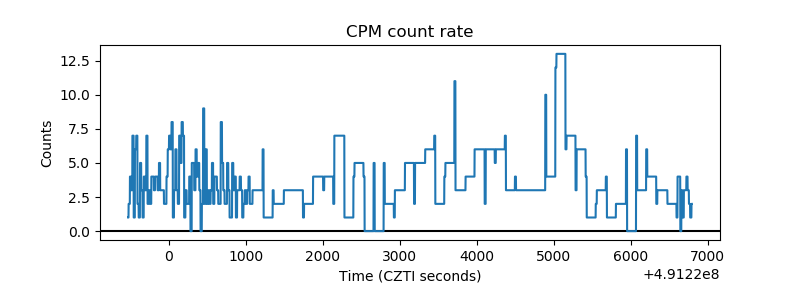 |
| CZT Counter | 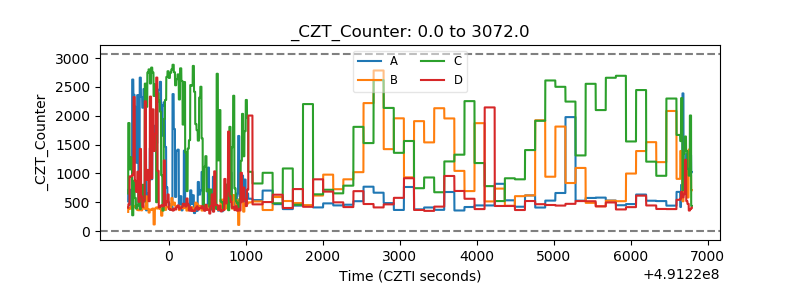 |
| +2.5 Volts monitor | 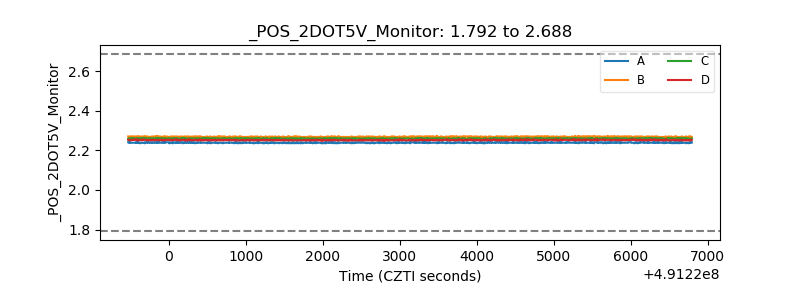 |
| +5 Volts monitor |  |
| _ROLL_ROT | 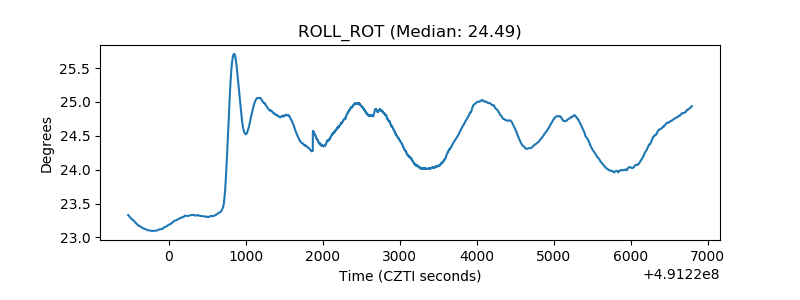 |
| _Roll_DEC | 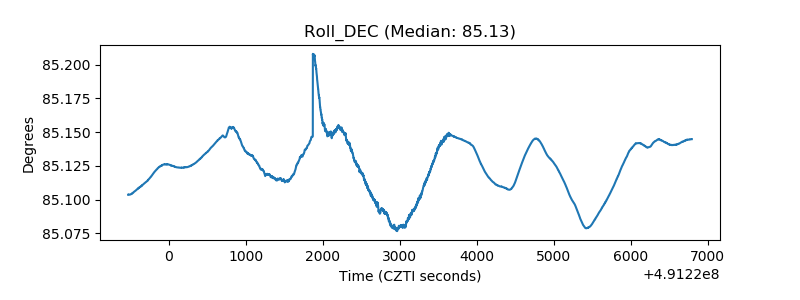 |
| _Roll_RA | 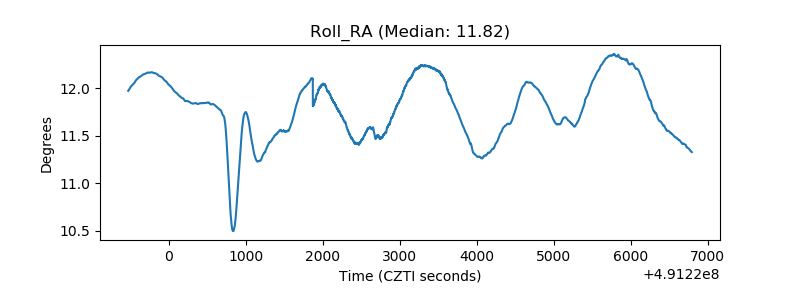 |
| Veto Counter | 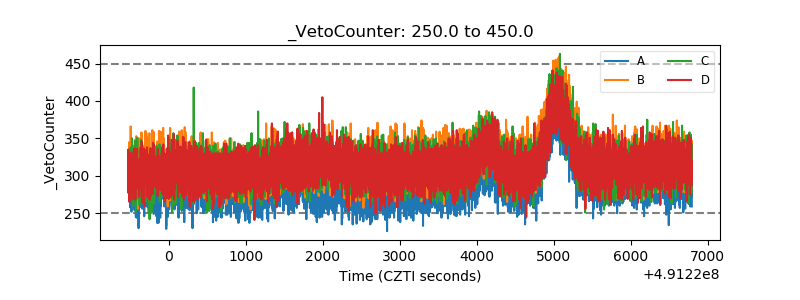 |