| Param | Original file | Final file |
|---|---|---|
| Filename | modeM0/AS1C09_011T07_9000006488_53159cztM0_level2.fits | modeM0/AS1C09_011T07_9000006488_53159cztM0_level2_quad_clean.evt |
| Size (bytes) | 1,443,804,480 | 175,901,760 |
| Size | 1.3 GB | 167.8 MB |
| Events in quadrant A | 9,654,546 | 1,187,485 |
| Events in quadrant B | 12,443,743 | 1,284,251 |
| Events in quadrant C | 22,391,486 | 741,935 |
| Events in quadrant D | 7,876,156 | 1,146,530 |
| Mode SS | |||
|---|---|---|---|
| Quadrant | BADHDUFLAG | Total packets | Discarded packets |
| A | 0 | 282 | 0 |
| B | 0 | 282 | 0 |
| C | 0 | 282 | 0 |
| D | 0 | 282 | 0 |
| Mode M9 | |||
|---|---|---|---|
| Quadrant | BADHDUFLAG | Total packets | Discarded packets |
| A | 0 | 4 | 0 |
| B | 0 | 4 | 0 |
| C | 0 | 4 | 0 |
| D | 0 | 4 | 0 |
| Mode M0 | |||
|---|---|---|---|
| Quadrant | BADHDUFLAG | Total packets | Discarded packets |
| A | 0 | 38641 | 2 |
| B | 0 | 46698 | 2 |
| C | 0 | 76204 | 2 |
| D | 0 | 33383 | 2 |
| Quadrant | Total seconds | Saturated seconds | Saturation percentage |
|---|---|---|---|
| A | 13968 | 1165 | 8.340493% |
| B | 13968 | 1271 | 9.099370% |
| C | 13968 | 5906 | 42.282360% |
| D | 13969 | 326 | 2.333739% |
Noise dominated data is calculated using 1-second bins in cleaned event files. If a bin has >2000 counts, and if more than 50% of those come from <1% of pixels, then it is considered to be noise-dominated and hence unusable.
| Quadrant | # 1 sec bins | Bins with >0 counts | Bins with >2000 counts | High rate bins dominated by noise | Noise dominated (total time) | Noise dominated (detector-on time) | Marked lightcurve |
|---|---|---|---|---|---|---|---|
| A | 14343 | 13970 | 854 | 854 | 5.95% | 6.11% | 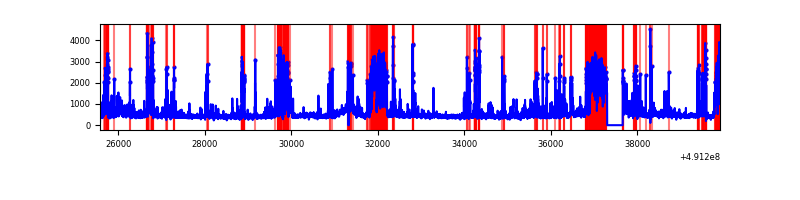 |
| B | 14343 | 13970 | 877 | 877 | 6.11% | 6.28% | 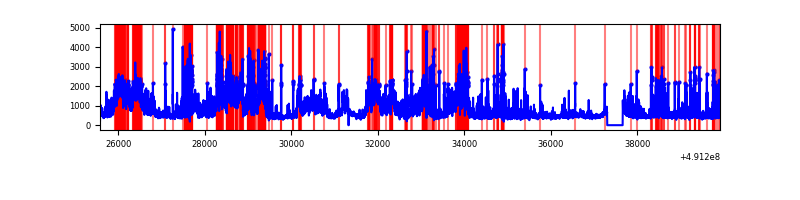 |
| C | 14343 | 13970 | 5099 | 5099 | 35.55% | 36.50% | 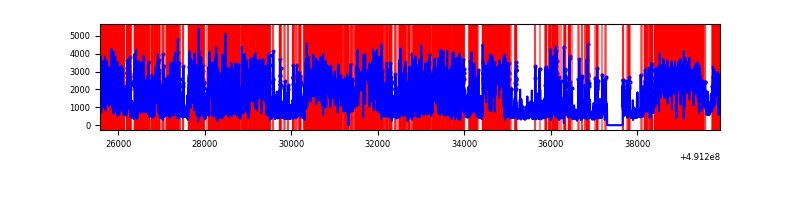 |
| D | 14344 | 13971 | 230 | 230 | 1.60% | 1.65% | 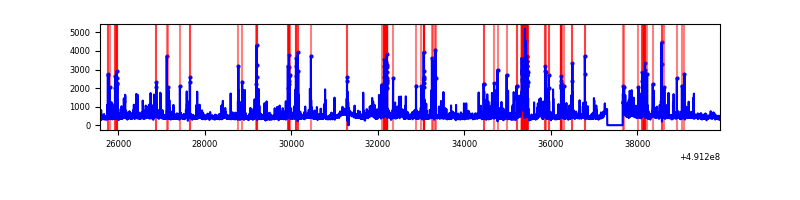 |
Top three noisy pixels from each quadrant. If the there are fewer than three noisy pixels in the level2.evt file, extra rows are filled as -1
| Pixel properties | Quadrant properties | ||||||
|---|---|---|---|---|---|---|---|
| Quadrant | DetID | PixID | Counts | Sigma | Mean | Median | Sigma |
| A | 12 | 3 | 2148150 | 6051.65 | 1421 | 1381 | 354.7 |
| A | 0 | 8 | 753499 | 2120.19 | 1421 | 1381 | 354.7 |
| A | 12 | 194 | 280174 | 785.91 | 1421 | 1381 | 354.7 |
| B | 10 | 254 | 4541989 | 15240.62 | 1409 | 1359 | 297.9 |
| B | 2 | 249 | 738385 | 2473.83 | 1409 | 1359 | 297.9 |
| B | 4 | 81 | 484007 | 1620.01 | 1409 | 1359 | 297.9 |
| C | 1 | 241 | 7940398 | 25058.21 | 1152 | 1138 | 316.8 |
| C | 15 | 224 | 2669285 | 8421.31 | 1152 | 1138 | 316.8 |
| C | 15 | 158 | 2056956 | 6488.65 | 1152 | 1138 | 316.8 |
| D | 2 | 153 | 642078 | 1602.53 | 1413 | 1350 | 399.8 |
| D | 12 | 3 | 349367 | 870.43 | 1413 | 1350 | 399.8 |
| D | 2 | 120 | 293400 | 730.45 | 1413 | 1350 | 399.8 |
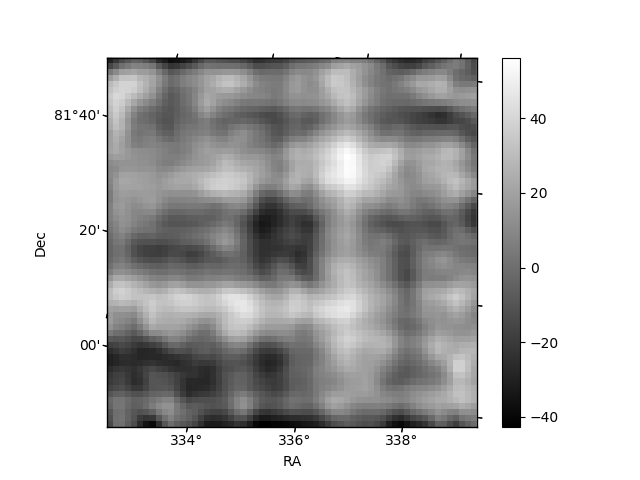
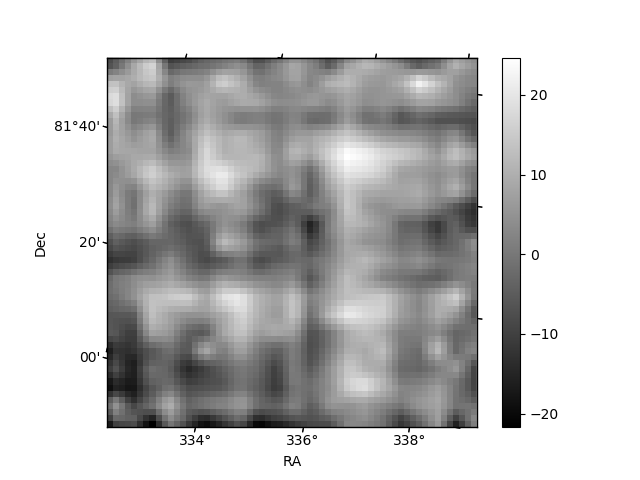
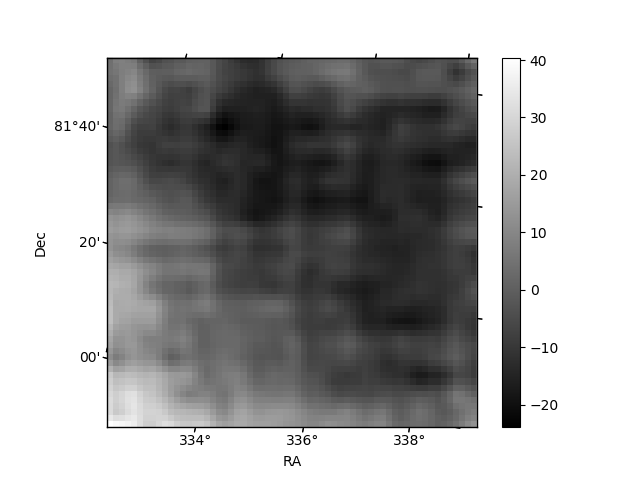
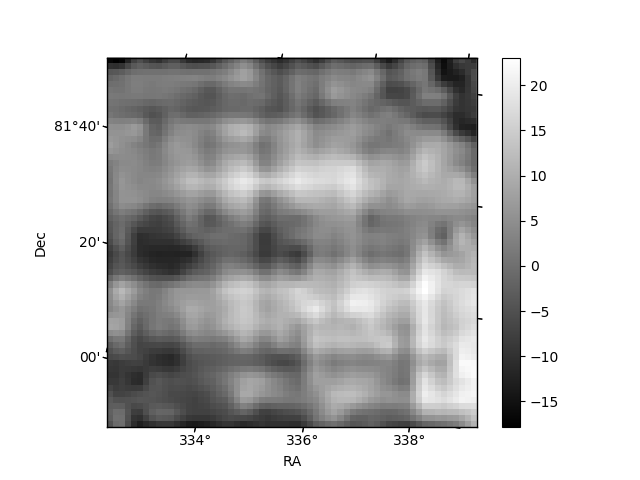
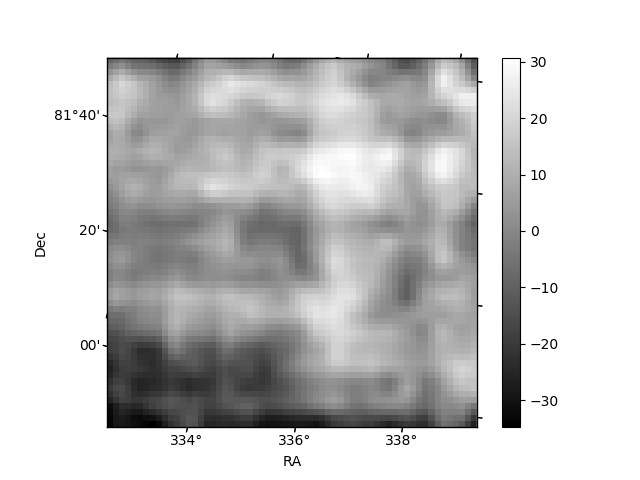
Histogram calculated using DETX and DETY for each event in the final _common_clean file
| Quadrant A | 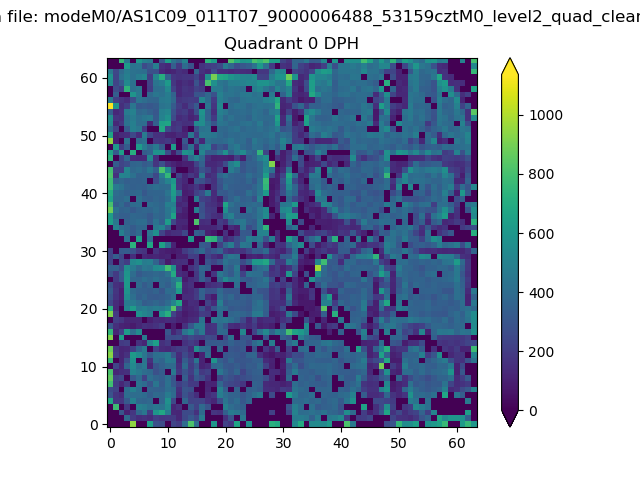 |
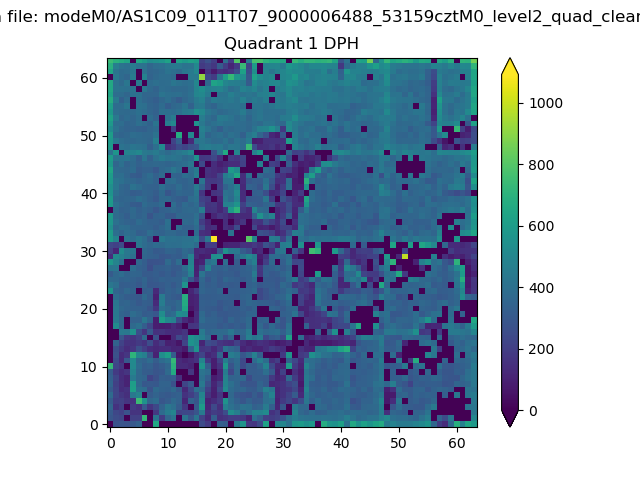 |
Quadrant B |
|---|---|---|---|
| Quadrant D | 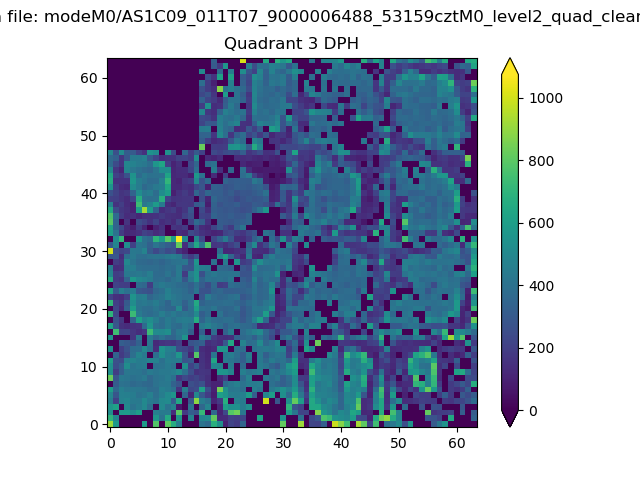 |
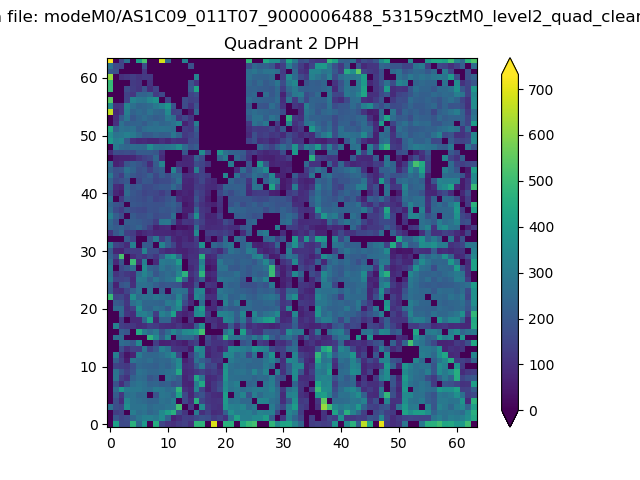 |
Quadrant C |
| Plot type | Count rate plots | Images |
|---|---|---|
| Comparison with Poisson distribution Blue bars denote a histogram of data divided into 1 sec bins. Red curve is a Poisson curve with rate = median count rate of data. |
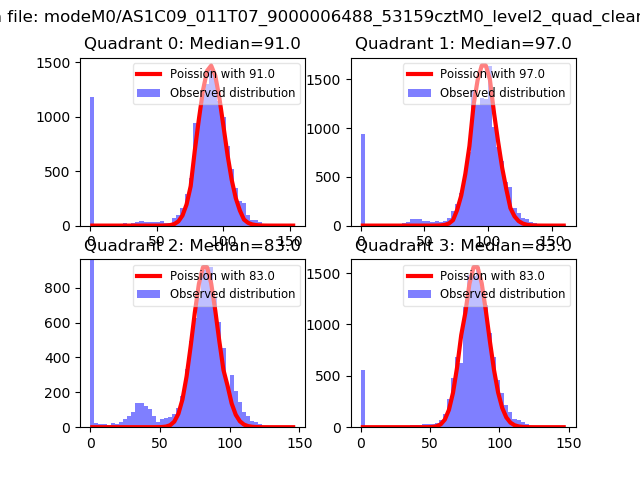 |
 |
| Quadrant-wise count rates Data is divided into 100 sec bins |
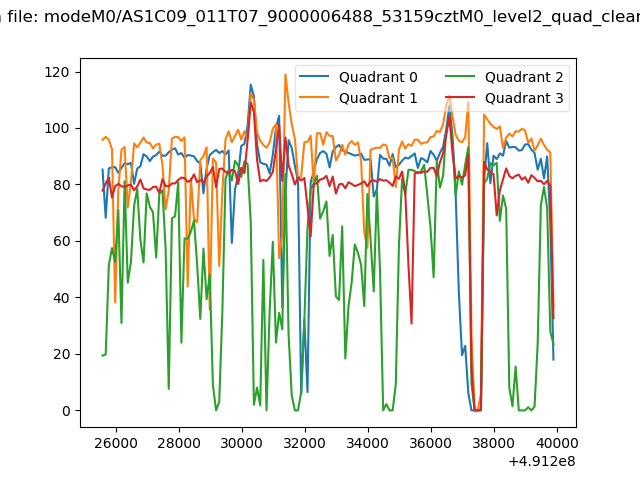 |
|
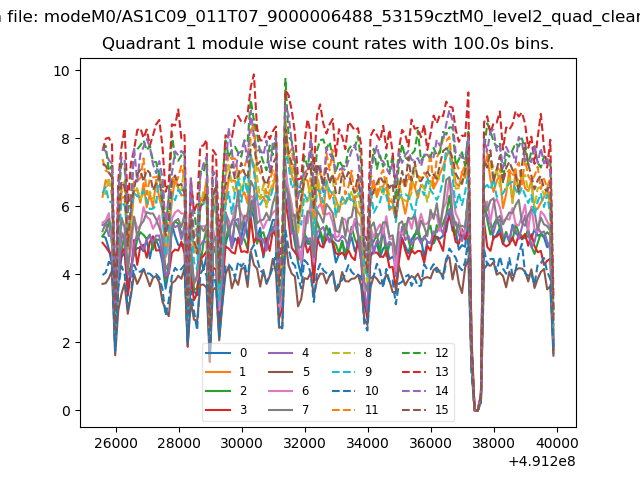
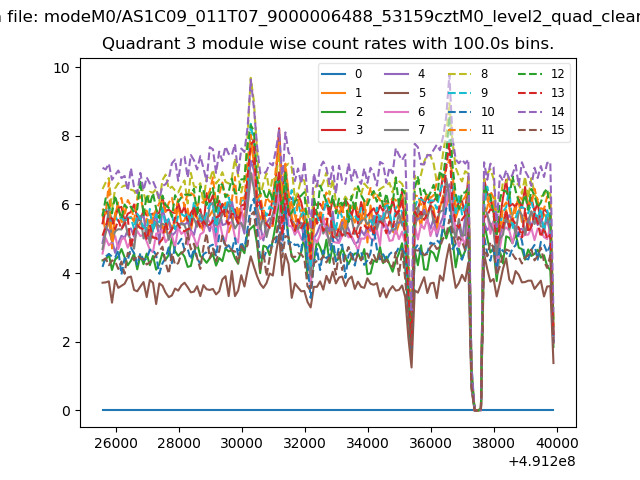
| Module-wise count rates for Quadrant A Data is divided into 100 sec bins |
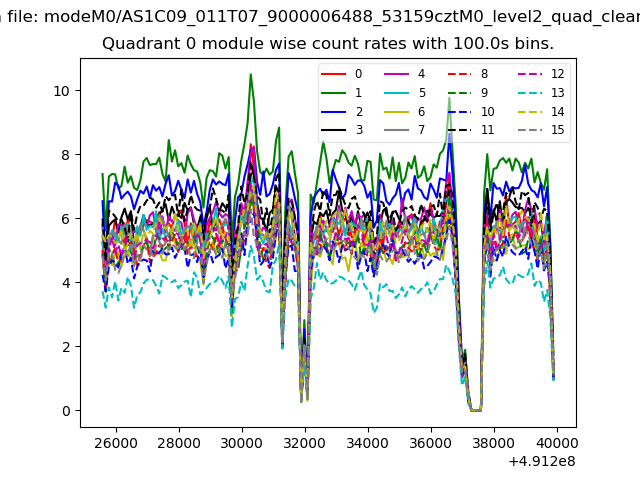 |
 |
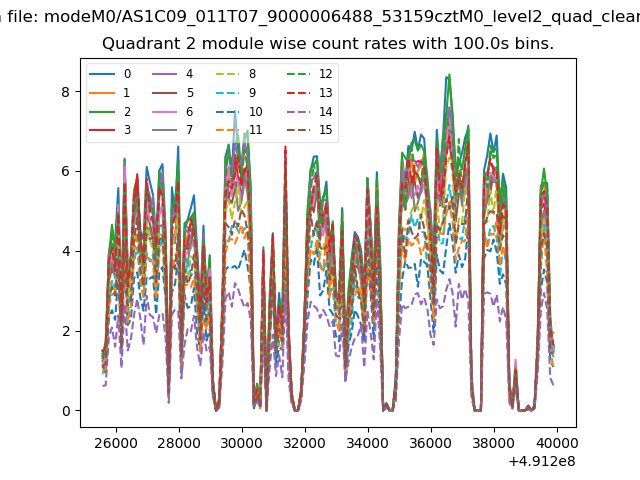
| Module-wise count rates for Quadrant B Data is divided into 100 sec bins |
 |
 |
| Module-wise count rates for Quadrant C Data is divided into 100 sec bins |
 |
 |
| Module-wise count rates for Quadrant D Data is divided into 100 sec bins |
 |
 |
| Parameter | Plot |
|---|---|
| CZT HV Monitor | 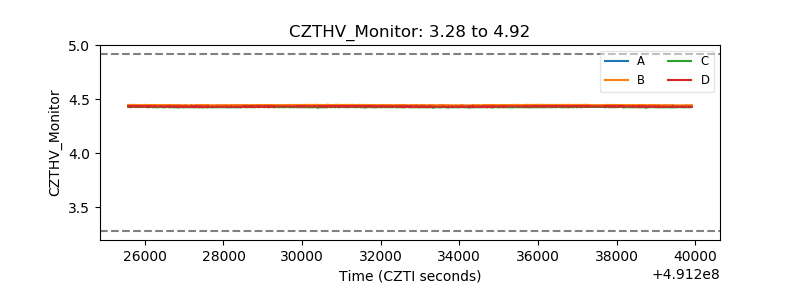 |
| D_VDD | 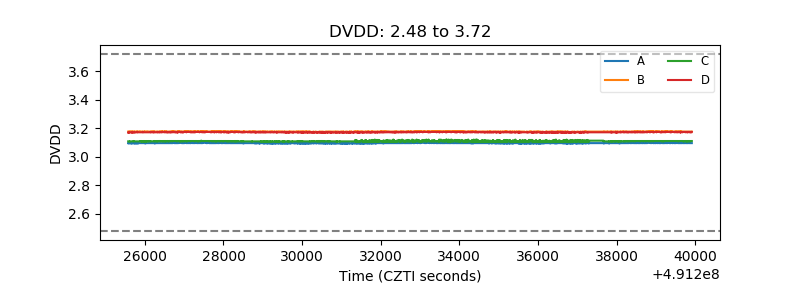 |
| Temperature 1 | 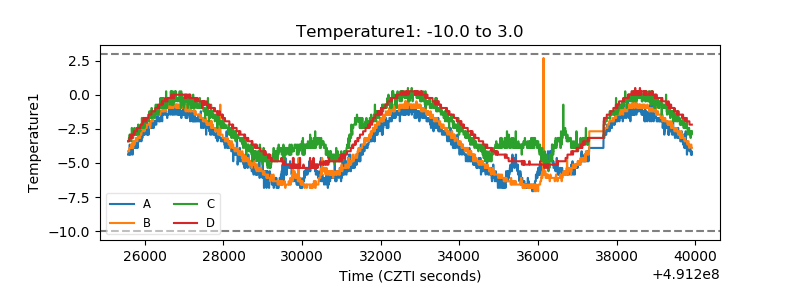 |
| Veto HV Monitor | 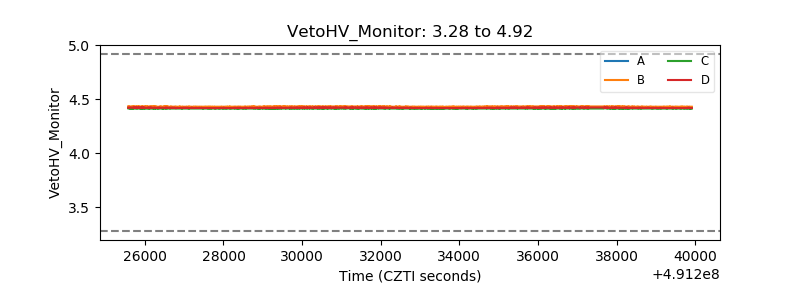 |
| Veto LLD | 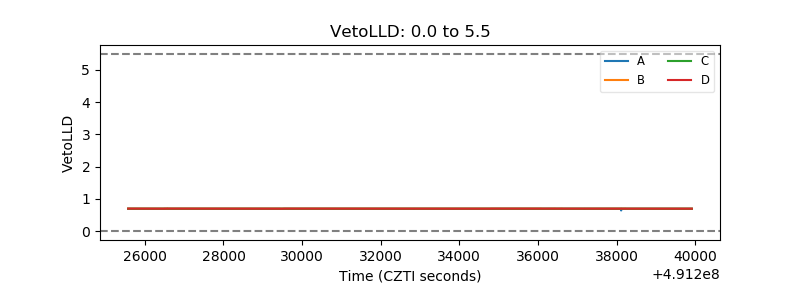 |
| Alpha Counter | 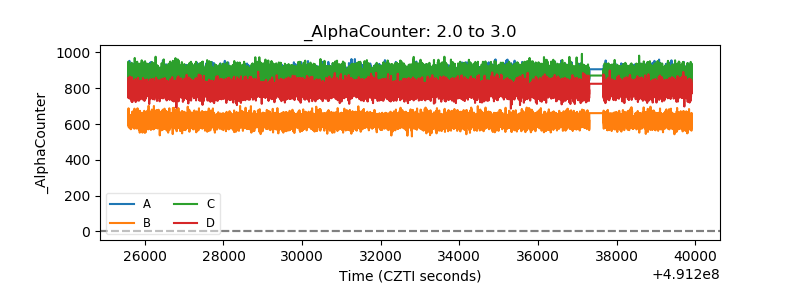 |
| _CPM_Rate | 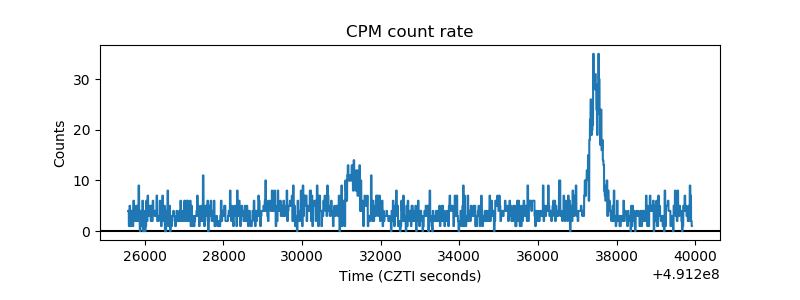 |
| CZT Counter | 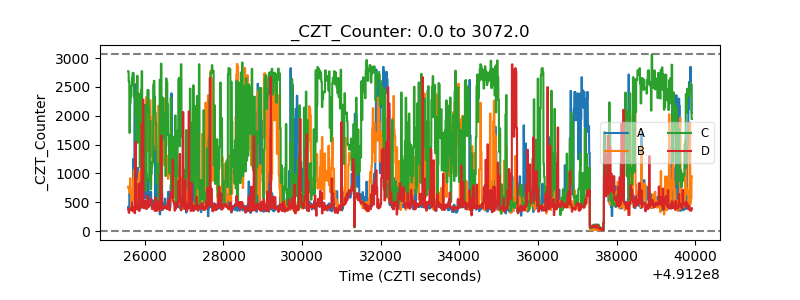 |
| +2.5 Volts monitor | 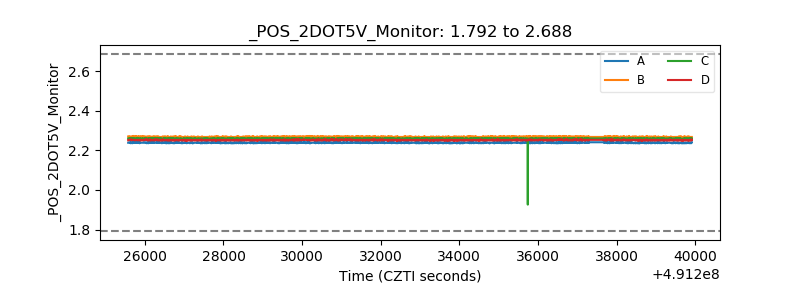 |
| +5 Volts monitor |  |
| _ROLL_ROT | 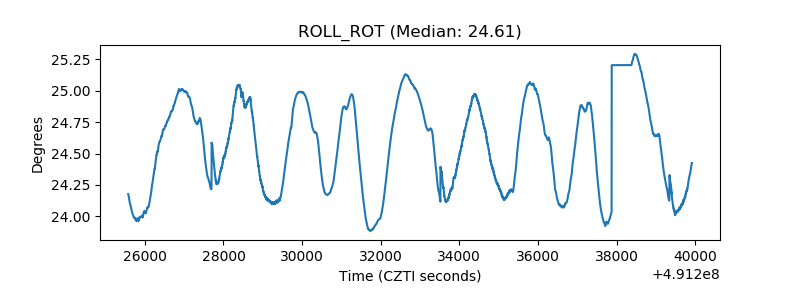 |
| _Roll_DEC | 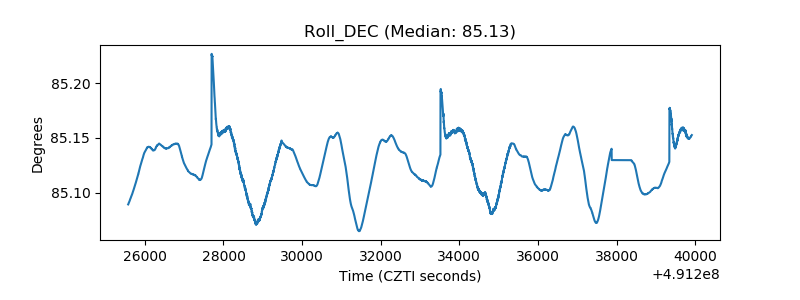 |
| _Roll_RA | 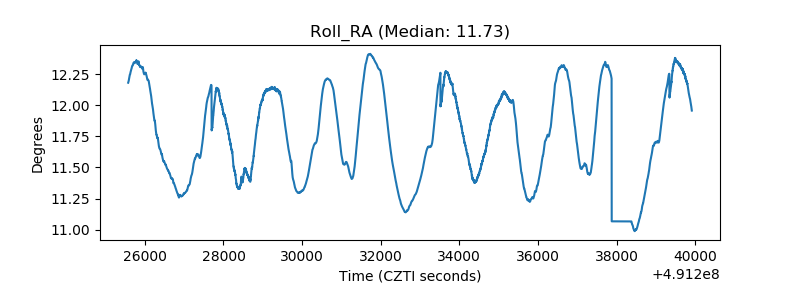 |
| Veto Counter | 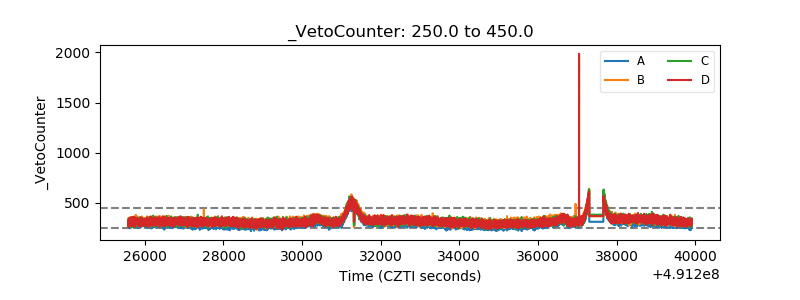 |