| Param | Original file | Final file |
|---|---|---|
| Filename | modeM0/AS1C09_011T06_9000006490cztM0_level2.fits | modeM0/AS1C09_011T06_9000006490cztM0_level2_quad_clean.evt |
| Size (bytes) | 3,031,272,000 | 1,508,060,160 |
| Size | 2.8 GB | 1.4 GB |
| Events in quadrant A | 19,320,592 | 5,593,389 |
| Events in quadrant B | 17,698,092 | 5,642,527 |
| Events in quadrant C | 16,006,642 | 4,265,460 |
| Events in quadrant D | 10,612,354 | 2,177,916 |
| Mode M9 | |||
|---|---|---|---|
| Quadrant | BADHDUFLAG | Total packets | Discarded packets |
| A | 0 | 523 | 0 |
| B | 0 | 523 | 0 |
| C | 0 | 523 | 0 |
| D | 0 | 523 | 0 |
| Mode SS | |||
|---|---|---|---|
| Quadrant | BADHDUFLAG | Total packets | Discarded packets |
| A | 0 | 8280 | 0 |
| B | 0 | 8280 | 0 |
| C | 0 | 8278 | 0 |
| D | 0 | 8280 | 0 |
| Mode M0 | |||
|---|---|---|---|
| Quadrant | BADHDUFLAG | Total packets | Discarded packets |
| A | 0 | 1102941 | 0 |
| B | 0 | 1278507 | 0 |
| C | 0 | 1894815 | 0 |
| D | 0 | 2513288 | 0 |
| Quadrant | Total seconds | Saturated seconds | Saturation percentage |
|---|---|---|---|
| A | 408364 | 23086 | 5.653290% |
| B | 408368 | 50668 | 12.407436% |
| C | 408348 | 117569 | 28.791374% |
| D | 408331 | 221676 | 54.288310% |
Noise dominated data is calculated using 1-second bins in cleaned event files. If a bin has >2000 counts, and if more than 50% of those come from <1% of pixels, then it is considered to be noise-dominated and hence unusable.
| Quadrant | # 1 sec bins | Bins with >0 counts | Bins with >2000 counts | High rate bins dominated by noise | Noise dominated (total time) | Noise dominated (detector-on time) | Marked lightcurve |
|---|---|---|---|---|---|---|---|
| A | 464705 | 408111 | 0 | 0 | 0.00% | 0.00% | 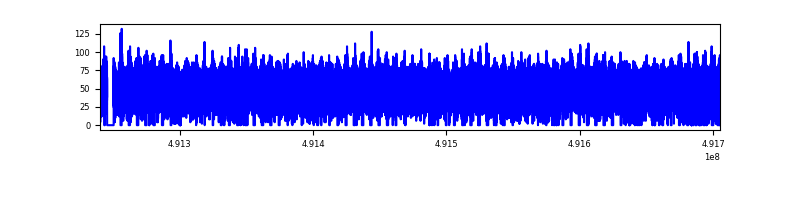 |
| B | 464705 | 407393 | 0 | 0 | 0.00% | 0.00% | 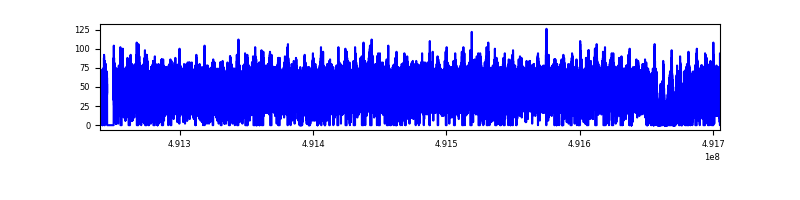 |
| C | 464704 | 402469 | 0 | 0 | 0.00% | 0.00% | 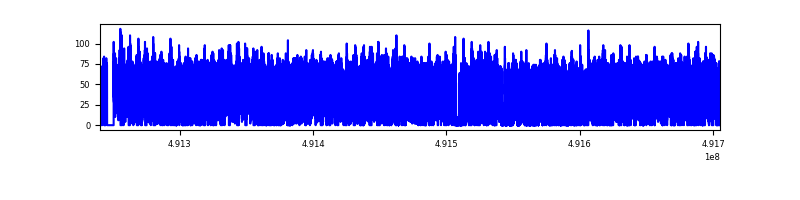 |
| D | 464705 | 389157 | 0 | 0 | 0.00% | 0.00% | 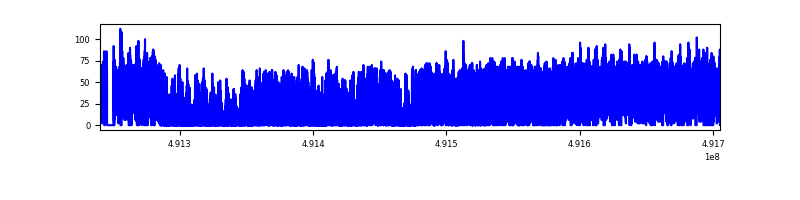 |
Top three noisy pixels from each quadrant. If the there are fewer than three noisy pixels in the level2.evt file, extra rows are filled as -1
| Pixel properties | Quadrant properties | ||||||
|---|---|---|---|---|---|---|---|
| Quadrant | DetID | PixID | Counts | Sigma | Mean | Median | Sigma |
| A | 14 | 188 | 22251 | 10.32 | 5108 | 4744 | 1696.9 |
| A | 9 | 255 | 20591 | 9.34 | 5108 | 4744 | 1696.9 |
| A | 14 | 204 | 17762 | 7.67 | 5108 | 4744 | 1696.9 |
| B | 2 | 9 | 20329 | 14.65 | 4698 | 4462 | 1083.3 |
| B | 2 | 8 | 18449 | 12.91 | 4698 | 4462 | 1083.3 |
| B | 9 | 173 | 14551 | 9.31 | 4698 | 4462 | 1083.3 |
| C | 15 | 175 | 13059 | 6.17 | 4288 | 3906 | 1484.2 |
| C | 7 | 221 | 12882 | 6.05 | 4288 | 3906 | 1484.2 |
| C | 2 | 31 | 12732 | 5.95 | 4288 | 3906 | 1484.2 |
| D | 6 | 218 | 14251 | 11.17 | 3043 | 2703 | 1034.2 |
| D | 15 | 11 | 10244 | 7.29 | 3043 | 2703 | 1034.2 |
| D | 8 | 12 | 9842 | 6.9 | 3043 | 2703 | 1034.2 |
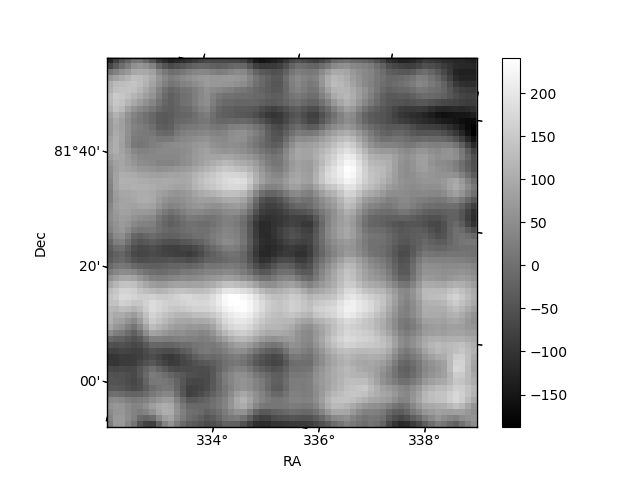
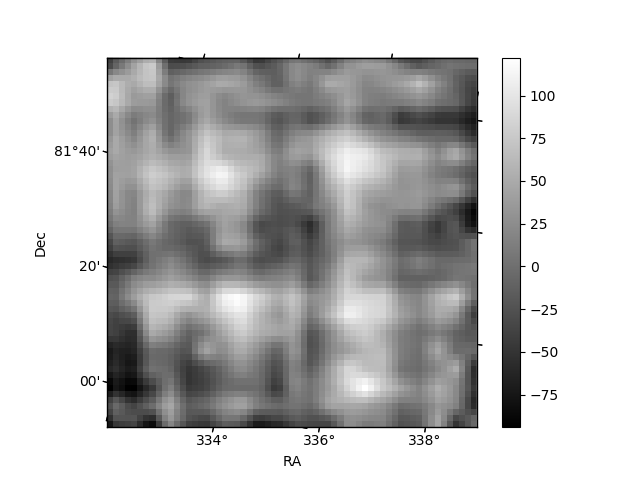
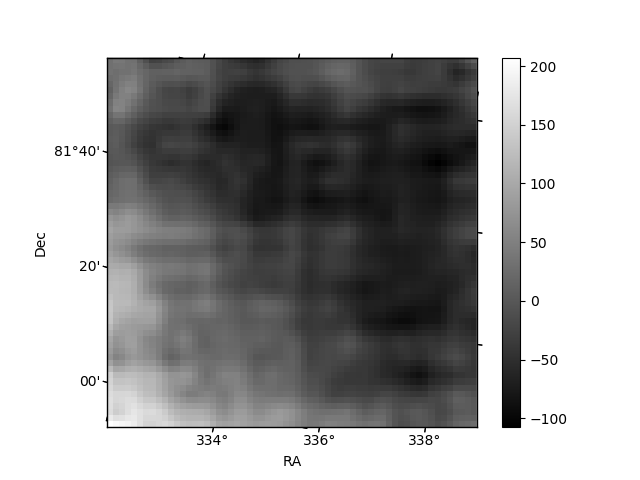
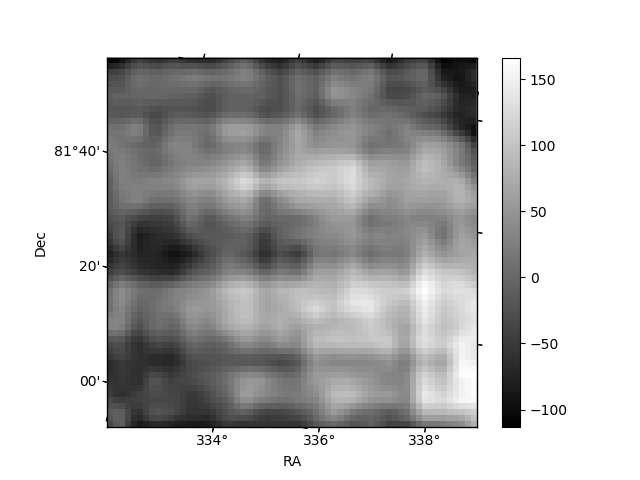
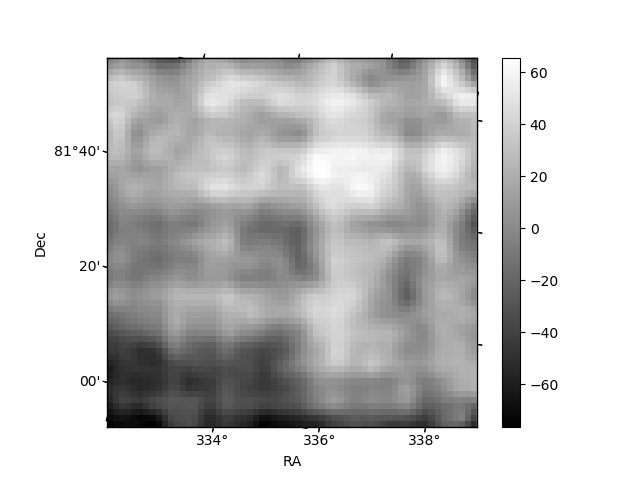
Histogram calculated using DETX and DETY for each event in the final _common_clean file
| Quadrant A | 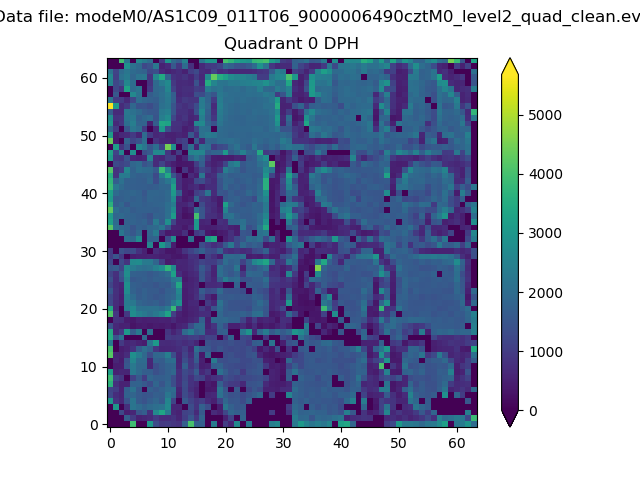 |
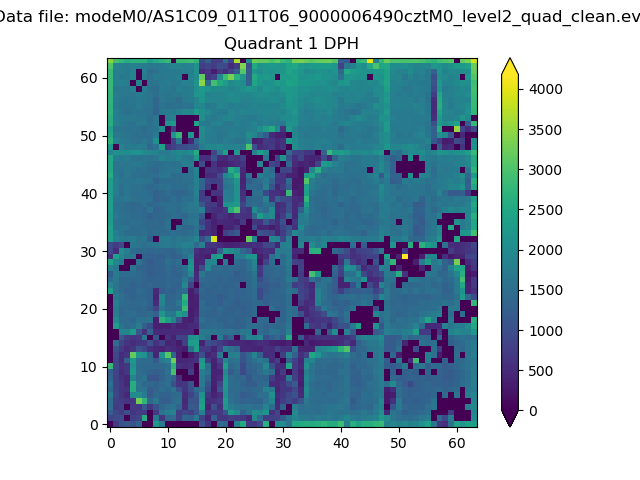 |
Quadrant B |
|---|---|---|---|
| Quadrant D | 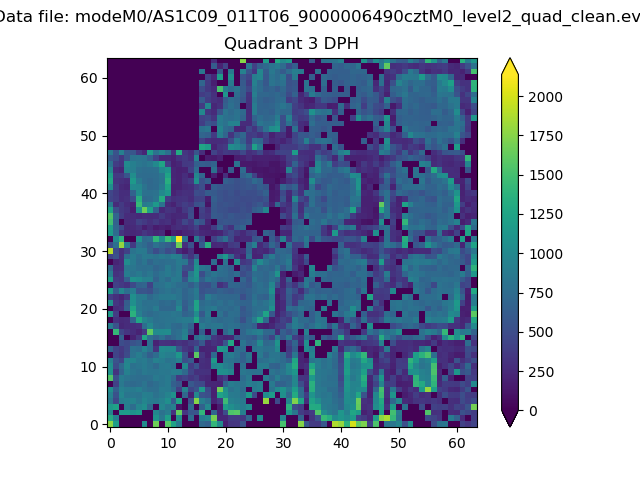 |
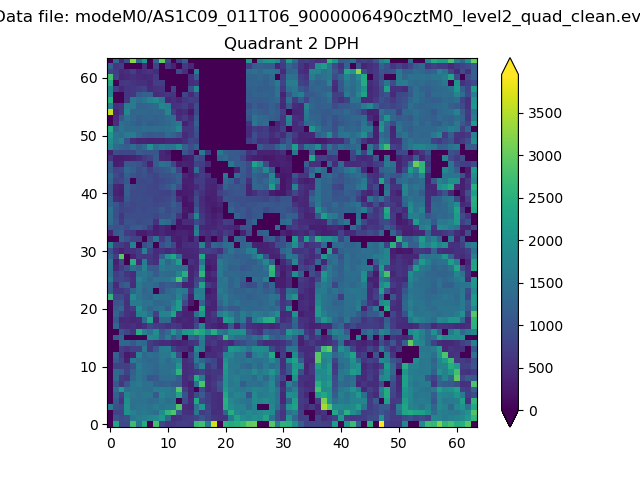 |
Quadrant C |
| Plot type | Count rate plots | Images |
|---|---|---|
| Comparison with Poisson distribution Blue bars denote a histogram of data divided into 1 sec bins. Red curve is a Poisson curve with rate = median count rate of data. |
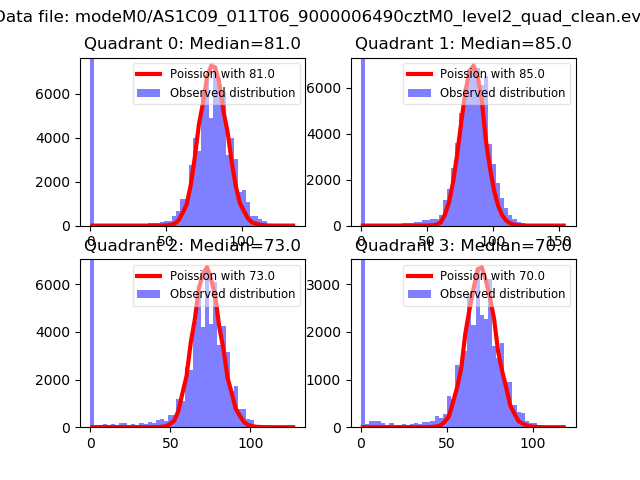 |
 |
| Quadrant-wise count rates Data is divided into 100 sec bins |
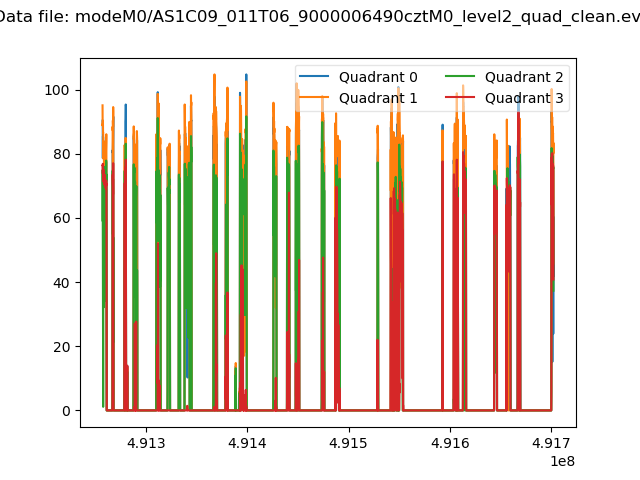 |
|
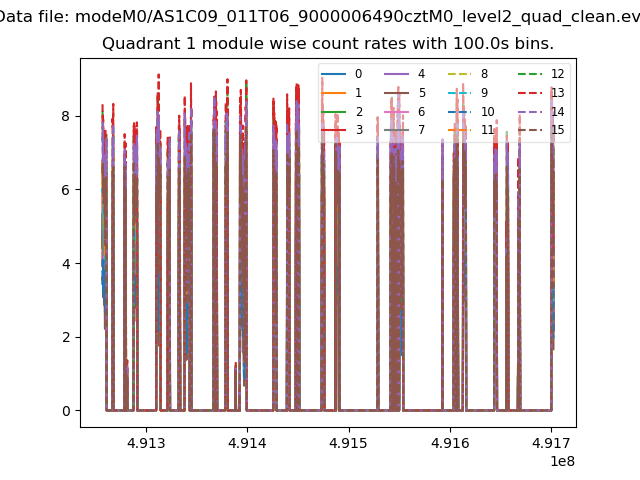
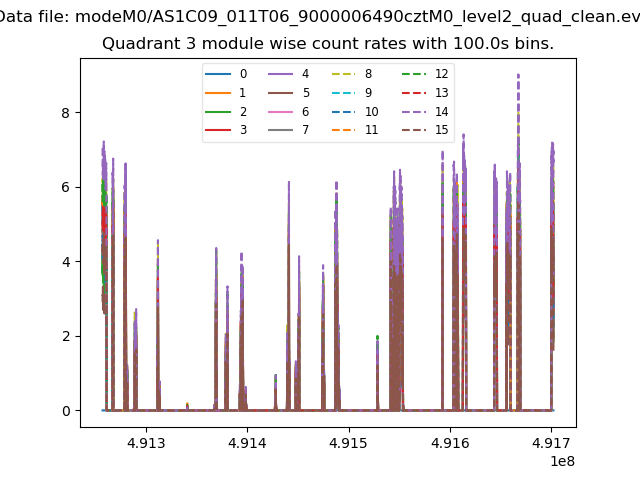
| Module-wise count rates for Quadrant A Data is divided into 100 sec bins |
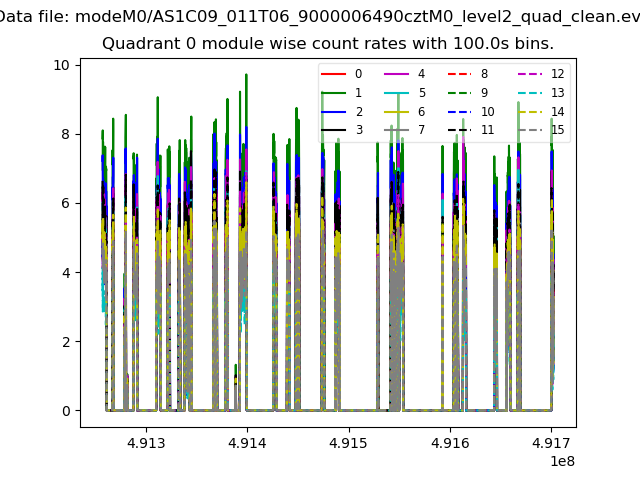 |
 |
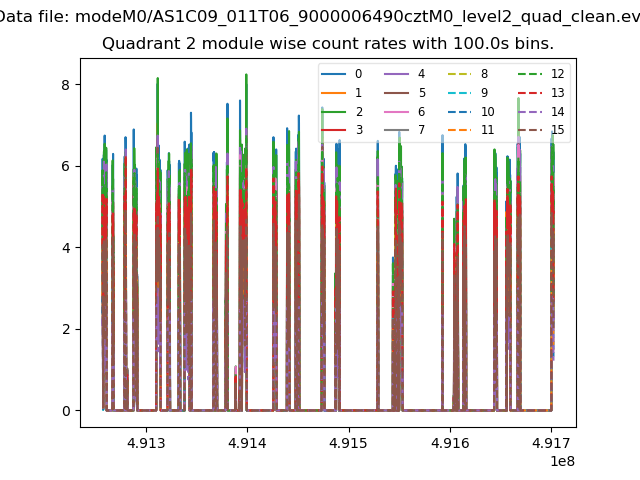
| Module-wise count rates for Quadrant B Data is divided into 100 sec bins |
 |
 |
| Module-wise count rates for Quadrant C Data is divided into 100 sec bins |
 |
 |
| Module-wise count rates for Quadrant D Data is divided into 100 sec bins |
 |
 |
| Parameter | Plot |
|---|---|
| CZT HV Monitor | 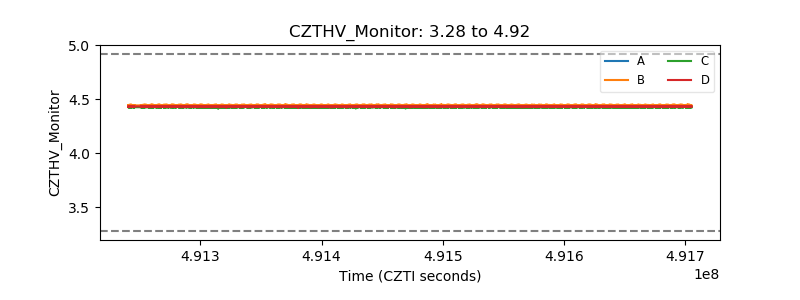 |
| D_VDD | 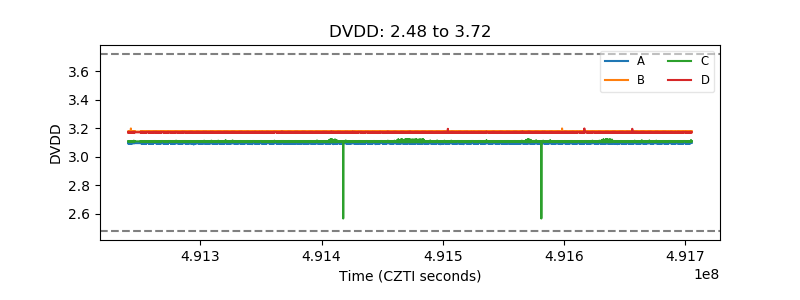 |
| Temperature 1 | 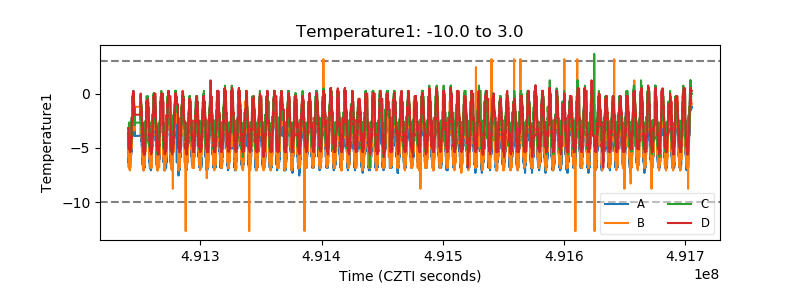 |
| Veto HV Monitor | 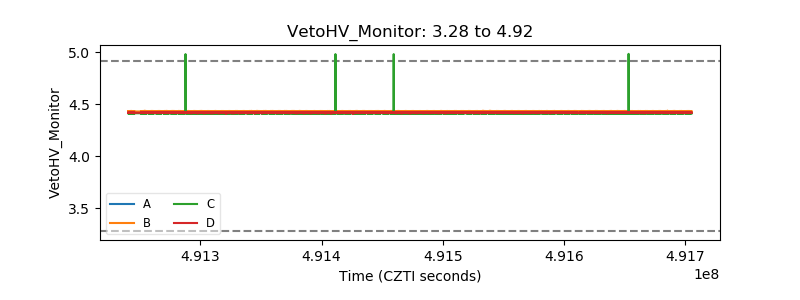 |
| Veto LLD | 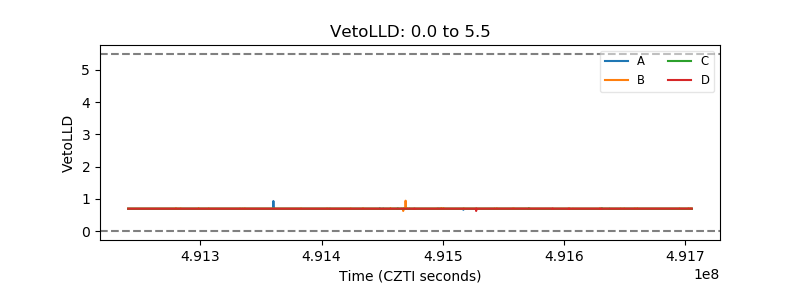 |
| Alpha Counter | 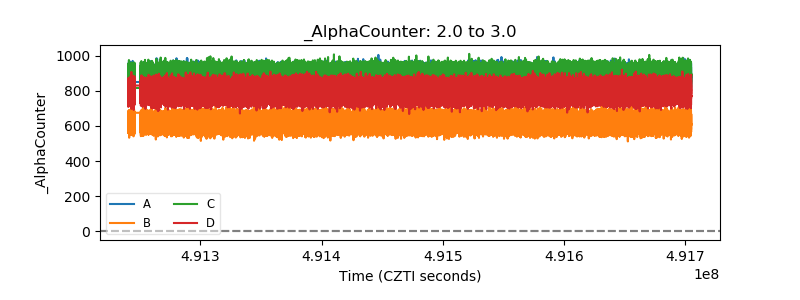 |
| _CPM_Rate | 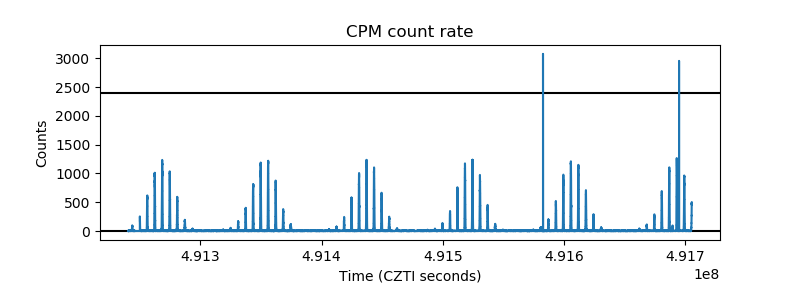 |
| CZT Counter | 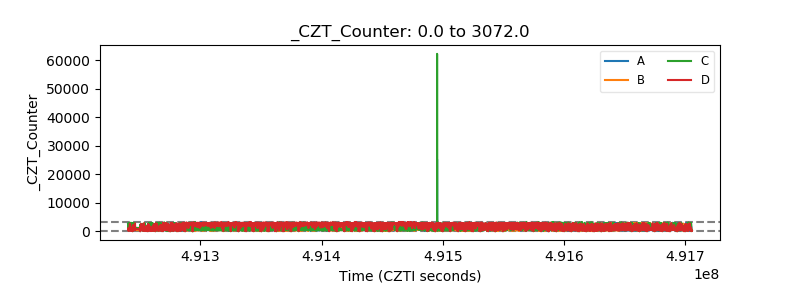 |
| +2.5 Volts monitor | 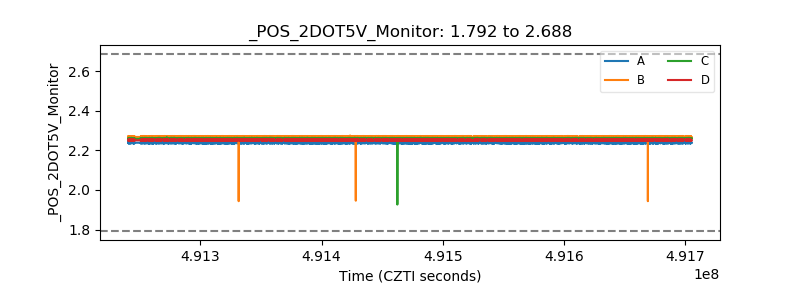 |
| +5 Volts monitor | 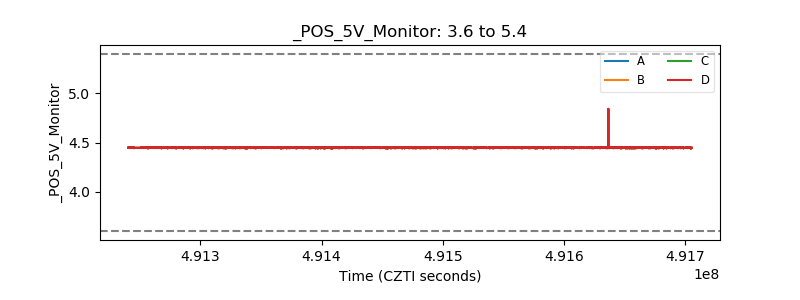 |
| _ROLL_ROT | 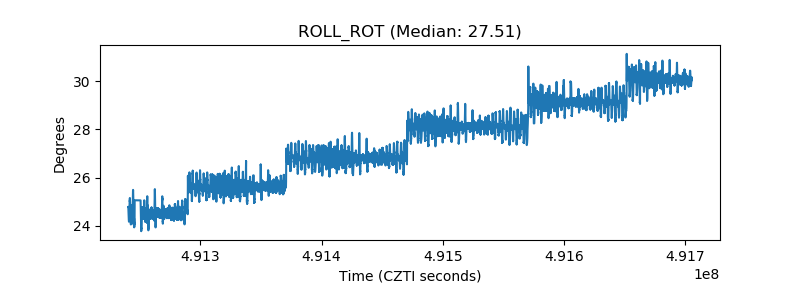 |
| _Roll_DEC | 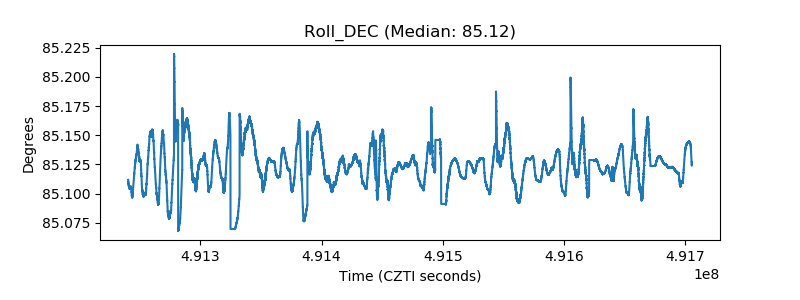 |
| _Roll_RA | 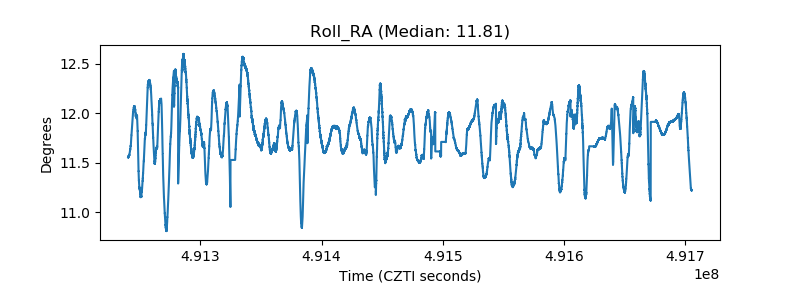 |
| Veto Counter | 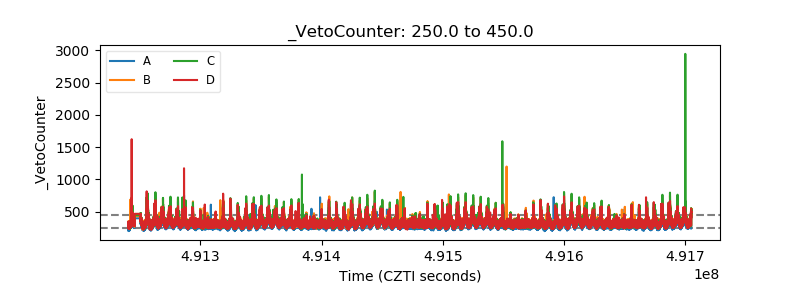 |