| Param | Original file | Final file |
|---|---|---|
| Filename | modeM0/AS1C09_011T06_9000006490_53163cztM0_level2.fits | modeM0/AS1C09_011T06_9000006490_53163cztM0_level2_quad_clean.evt |
| Size (bytes) | 594,305,280 | 92,799,360 |
| Size | 566.8 MB | 88.5 MB |
| Events in quadrant A | 3,715,564 | 637,754 |
| Events in quadrant B | 5,138,315 | 655,925 |
| Events in quadrant C | 8,217,657 | 506,883 |
| Events in quadrant D | 4,423,081 | 555,190 |
| Mode M9 | |||
|---|---|---|---|
| Quadrant | BADHDUFLAG | Total packets | Discarded packets |
| A | 0 | 11 | 0 |
| B | 0 | 11 | 0 |
| C | 0 | 11 | 0 |
| D | 0 | 11 | 0 |
| Mode SS | |||
|---|---|---|---|
| Quadrant | BADHDUFLAG | Total packets | Discarded packets |
| A | 0 | 132 | 0 |
| B | 0 | 132 | 0 |
| C | 0 | 132 | 0 |
| D | 0 | 132 | 0 |
| Mode M0 | |||
|---|---|---|---|
| Quadrant | BADHDUFLAG | Total packets | Discarded packets |
| A | 0 | 15974 | 2 |
| B | 0 | 19842 | 6 |
| C | 0 | 28918 | 2 |
| D | 0 | 18115 | 2 |
| Quadrant | Total seconds | Saturated seconds | Saturation percentage |
|---|---|---|---|
| A | 6508 | 178 | 2.735095% |
| B | 6507 | 441 | 6.777317% |
| C | 6507 | 1411 | 21.684340% |
| D | 6508 | 454 | 6.976030% |
Noise dominated data is calculated using 1-second bins in cleaned event files. If a bin has >2000 counts, and if more than 50% of those come from <1% of pixels, then it is considered to be noise-dominated and hence unusable.
| Quadrant | # 1 sec bins | Bins with >0 counts | Bins with >2000 counts | High rate bins dominated by noise | Noise dominated (total time) | Noise dominated (detector-on time) | Marked lightcurve |
|---|---|---|---|---|---|---|---|
| A | 7608 | 6509 | 137 | 137 | 1.80% | 2.10% | 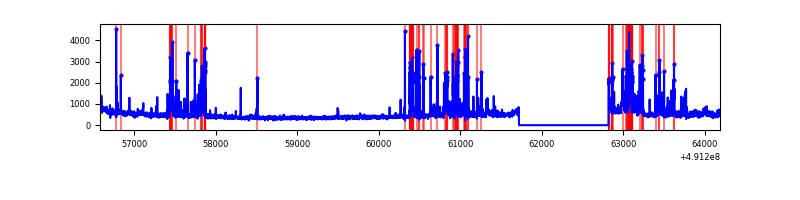 |
| B | 7607 | 6508 | 285 | 285 | 3.75% | 4.38% | 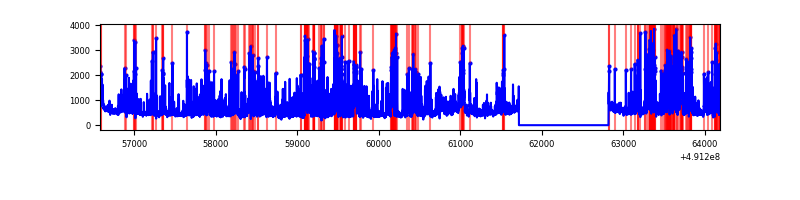 |
| C | 7607 | 6508 | 1399 | 1399 | 18.39% | 21.50% | 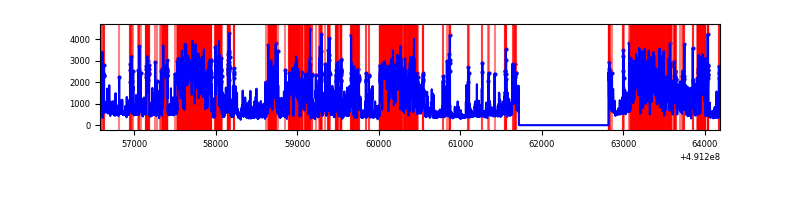 |
| D | 7608 | 6509 | 358 | 358 | 4.71% | 5.50% | 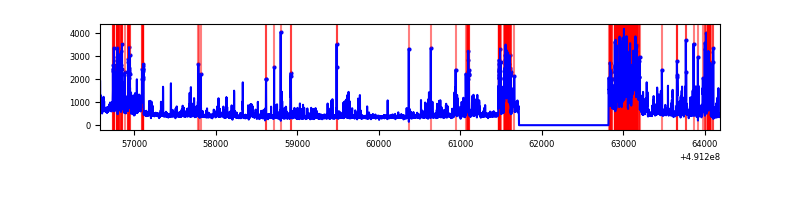 |
Top three noisy pixels from each quadrant. If the there are fewer than three noisy pixels in the level2.evt file, extra rows are filled as -1
| Pixel properties | Quadrant properties | ||||||
|---|---|---|---|---|---|---|---|
| Quadrant | DetID | PixID | Counts | Sigma | Mean | Median | Sigma |
| A | 15 | 174 | 428808 | 2530.49 | 674 | 660 | 169.2 |
| A | 4 | 249 | 307484 | 1813.43 | 674 | 660 | 169.2 |
| A | 3 | 14 | 128845 | 757.61 | 674 | 660 | 169.2 |
| B | 10 | 191 | 1367438 | 9689.77 | 663 | 641 | 141.1 |
| B | 1 | 239 | 410888 | 2908.4 | 663 | 641 | 141.1 |
| B | 4 | 81 | 361692 | 2559.63 | 663 | 641 | 141.1 |
| C | 0 | 240 | 1833239 | 10765.45 | 617 | 612 | 170.2 |
| C | 10 | 22 | 1370512 | 8047.24 | 617 | 612 | 170.2 |
| C | 1 | 241 | 1063346 | 6242.85 | 617 | 612 | 170.2 |
| D | 10 | 172 | 784272 | 4264.52 | 645 | 617 | 183.8 |
| D | 12 | 3 | 209982 | 1139.33 | 645 | 617 | 183.8 |
| D | 13 | 170 | 168273 | 912.36 | 645 | 617 | 183.8 |
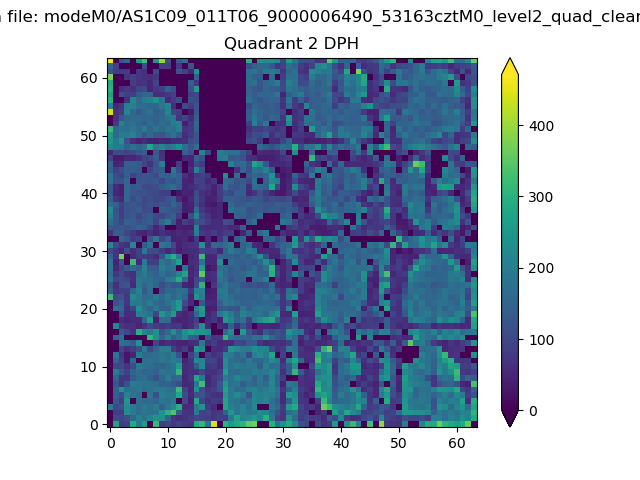
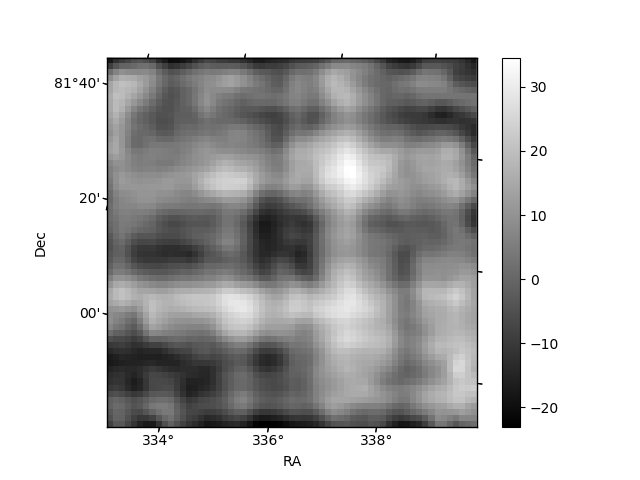
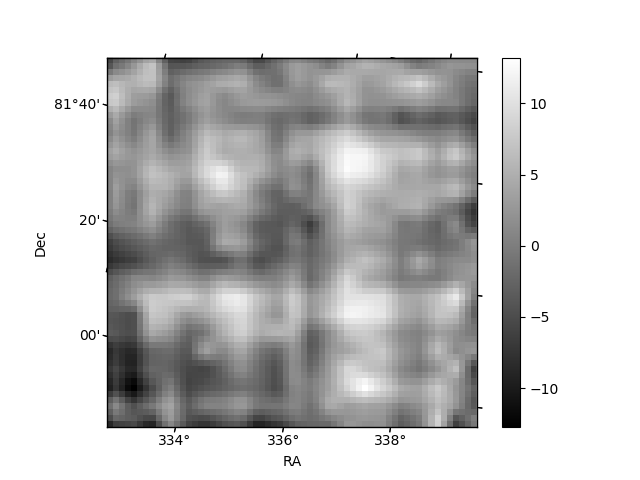
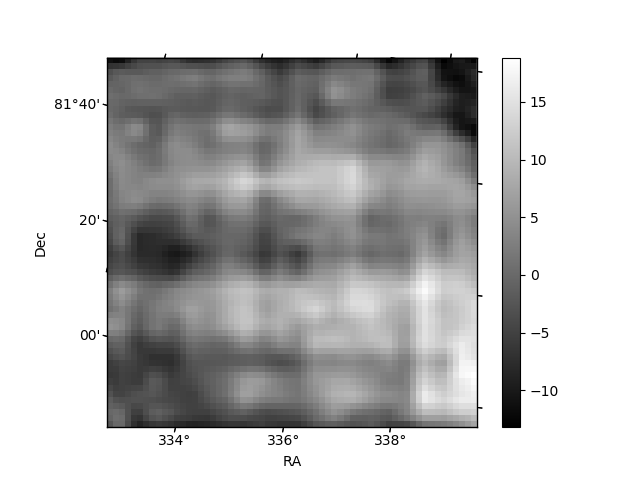
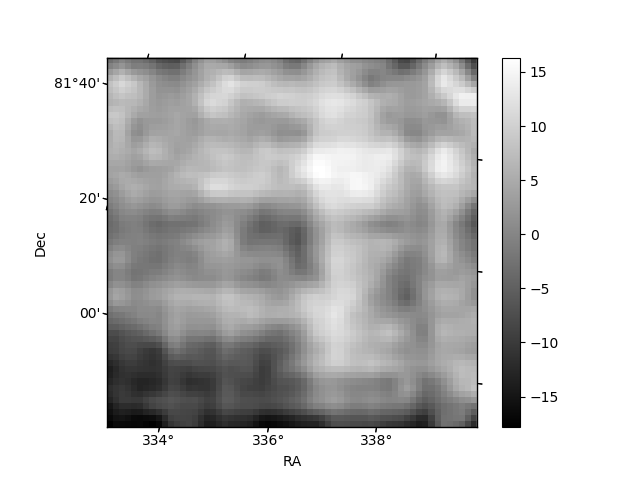
Histogram calculated using DETX and DETY for each event in the final _common_clean file
| Quadrant A | 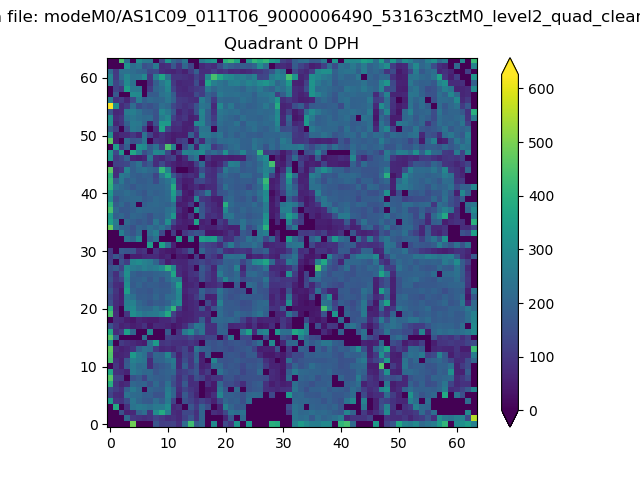 |
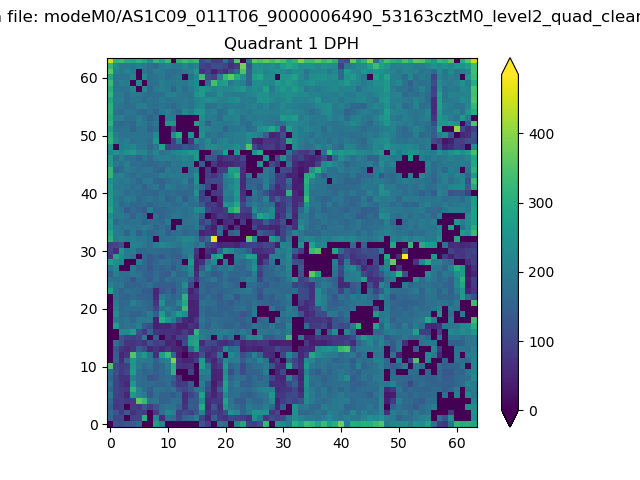 |
Quadrant B |
|---|---|---|---|
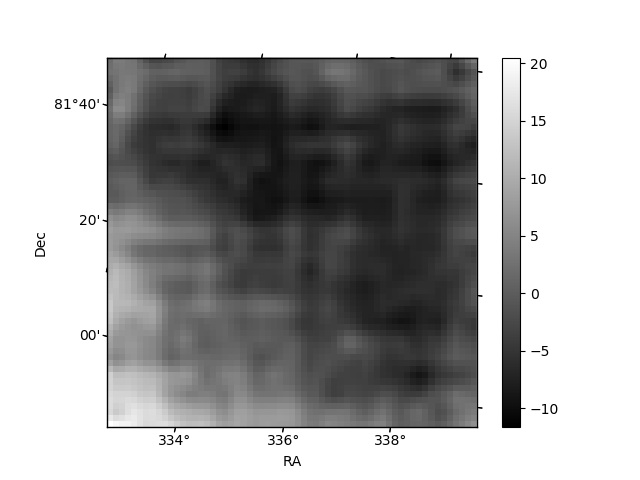
| Quadrant D | 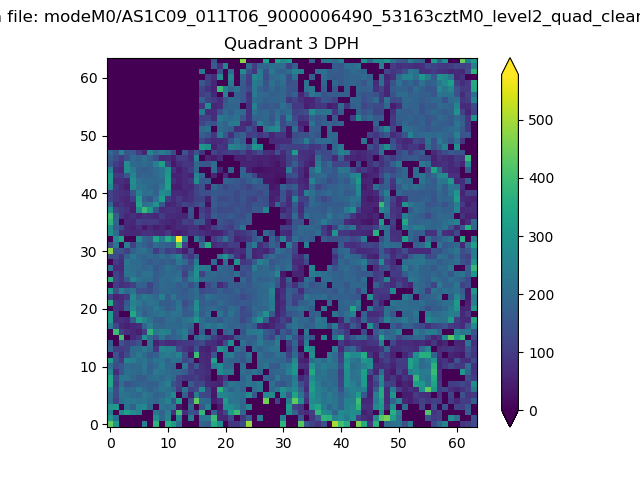 |
 |
Quadrant C |
| Plot type | Count rate plots | Images |
|---|---|---|
| Comparison with Poisson distribution Blue bars denote a histogram of data divided into 1 sec bins. Red curve is a Poisson curve with rate = median count rate of data. |
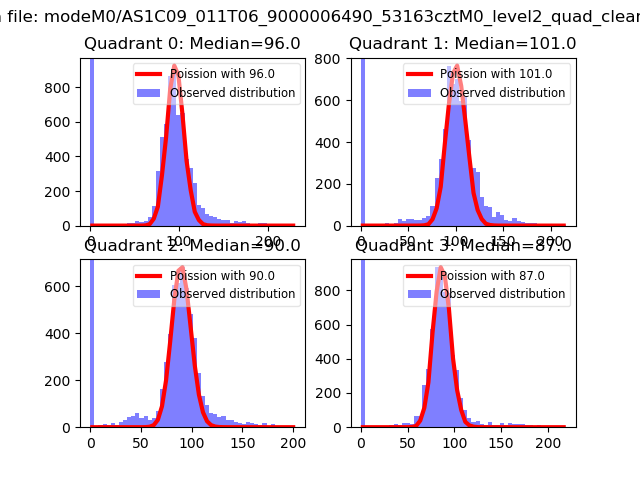 |
 |
| Quadrant-wise count rates Data is divided into 100 sec bins |
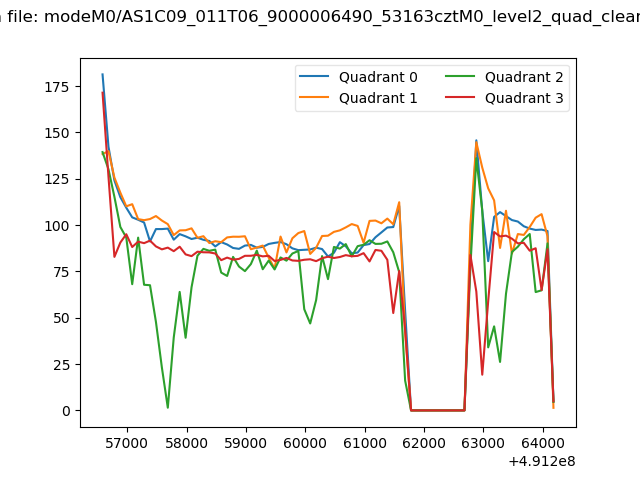 |
|
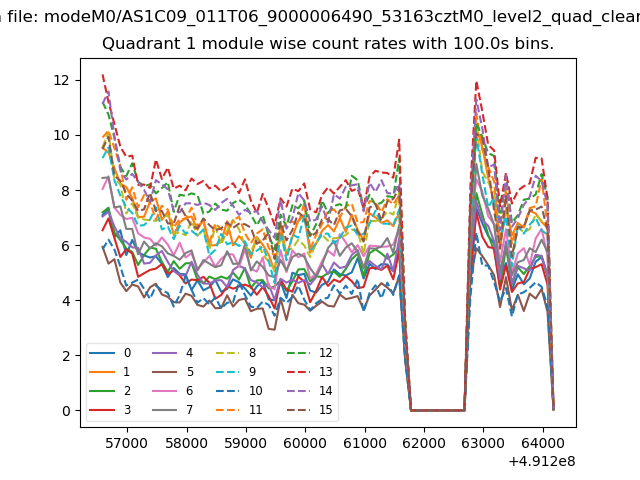
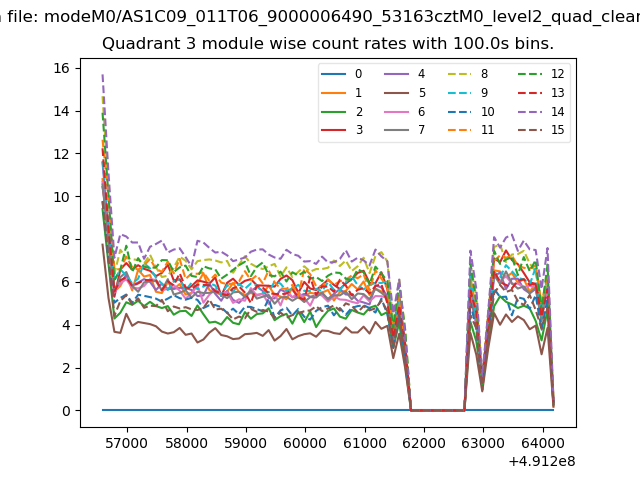
| Module-wise count rates for Quadrant A Data is divided into 100 sec bins |
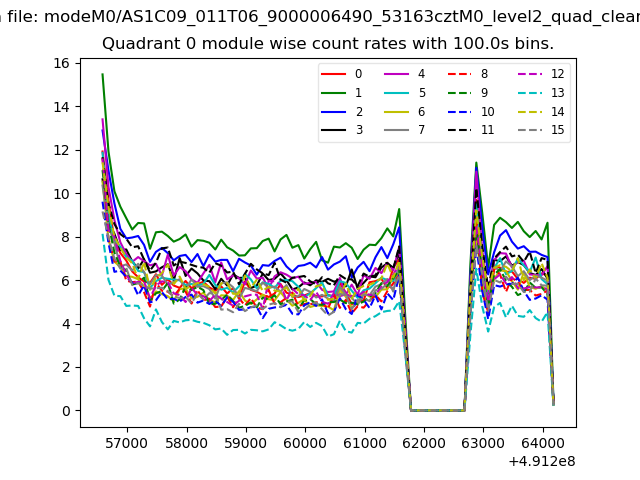 |
 |
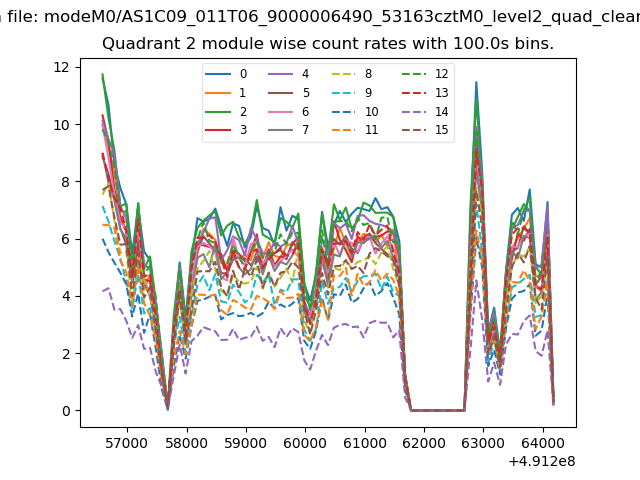
| Module-wise count rates for Quadrant B Data is divided into 100 sec bins |
 |
 |
| Module-wise count rates for Quadrant C Data is divided into 100 sec bins |
 |
 |
| Module-wise count rates for Quadrant D Data is divided into 100 sec bins |
 |
 |
| Parameter | Plot |
|---|---|
| CZT HV Monitor |  |
| D_VDD | 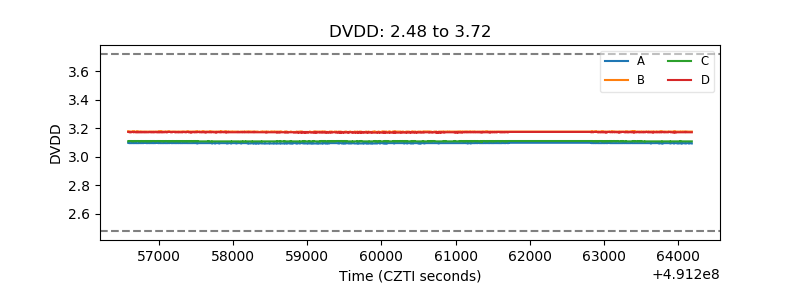 |
| Temperature 1 | 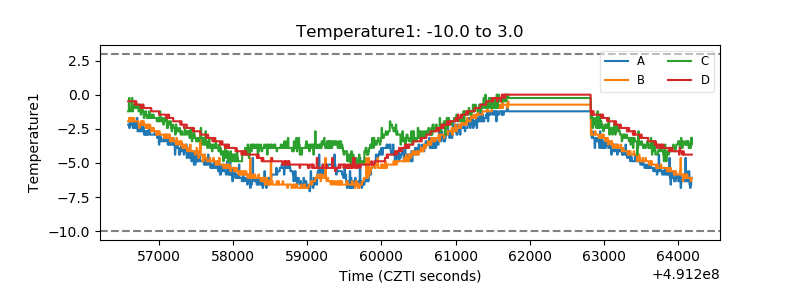 |
| Veto HV Monitor | 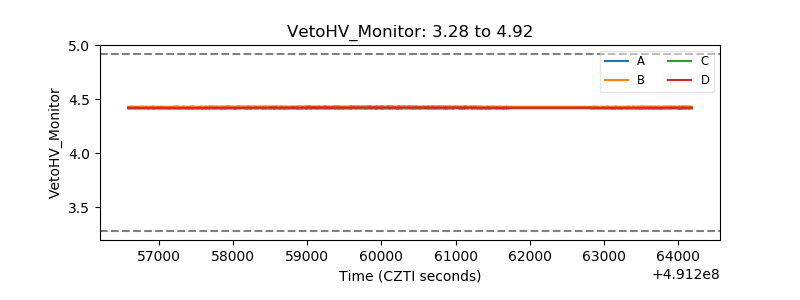 |
| Veto LLD | 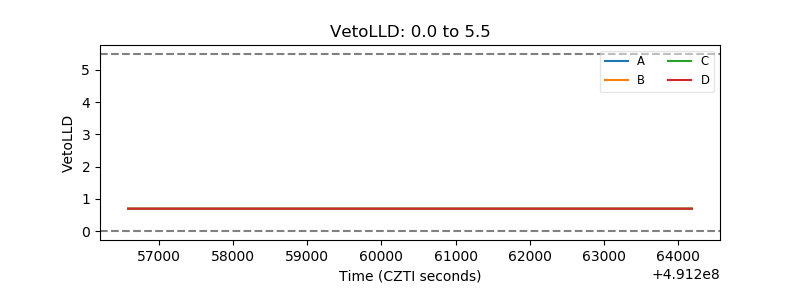 |
| Alpha Counter | 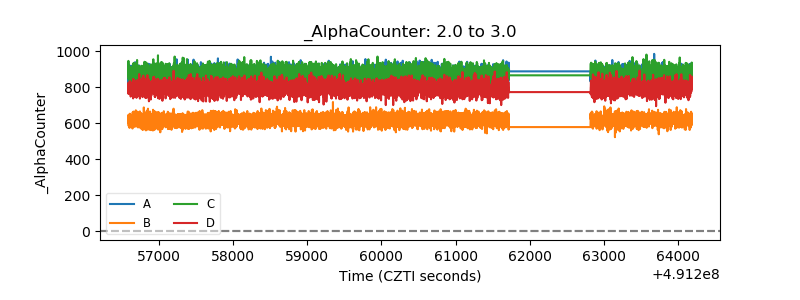 |
| _CPM_Rate | 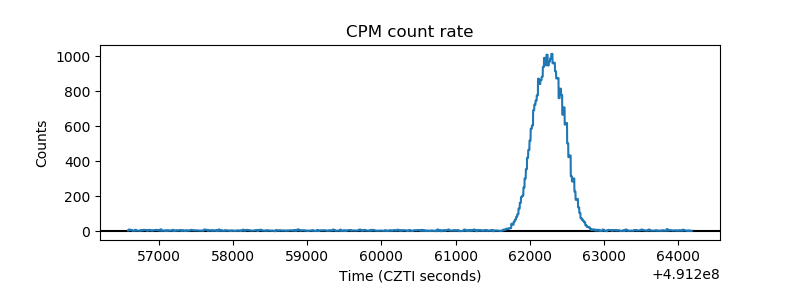 |
| CZT Counter | 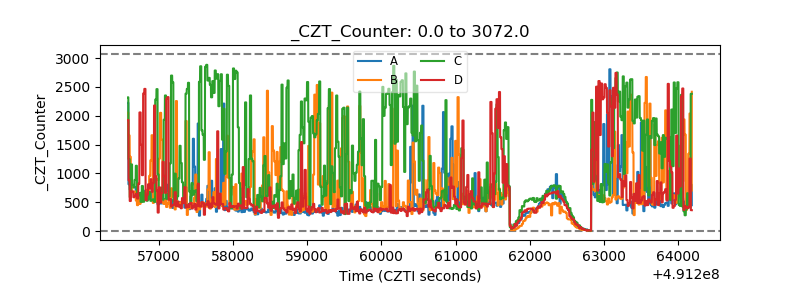 |
| +2.5 Volts monitor |  |
| +5 Volts monitor | 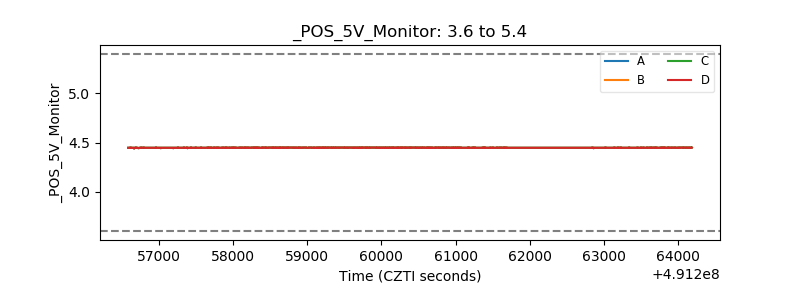 |
| _ROLL_ROT | 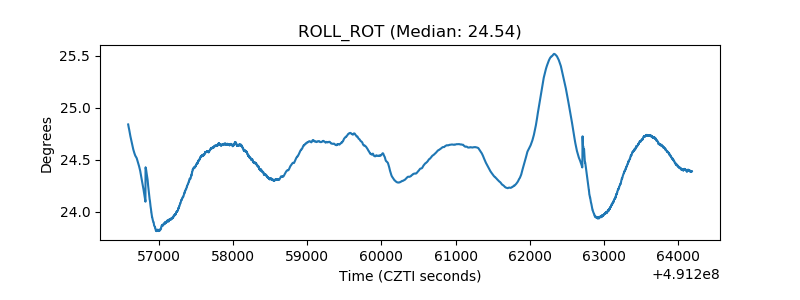 |
| _Roll_DEC | 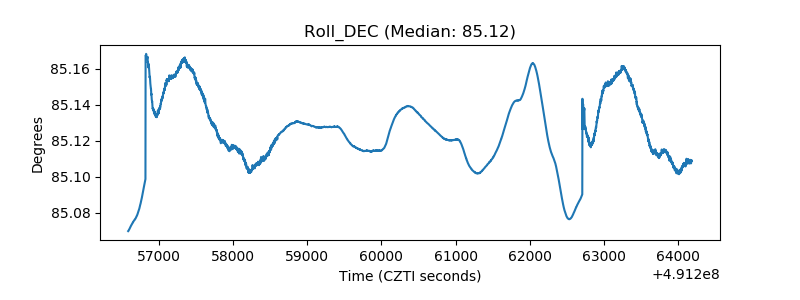 |
| _Roll_RA | 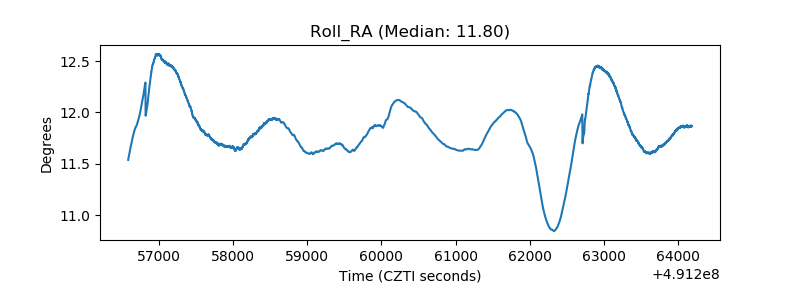 |
| Veto Counter | 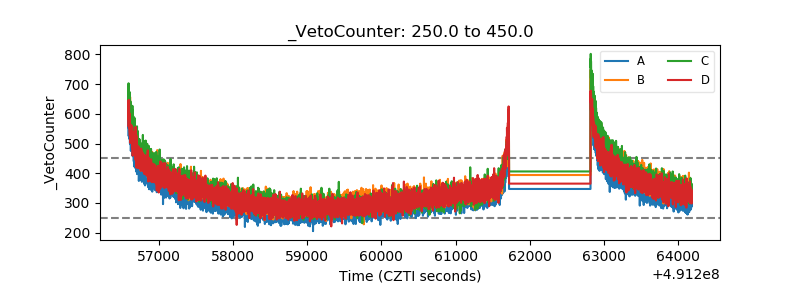 |