| Param | Original file | Final file |
|---|---|---|
| Filename | modeM0/AS1C09_011T06_9000006490_53165cztM0_level2.fits | modeM0/AS1C09_011T06_9000006490_53165cztM0_level2_quad_clean.evt |
| Size (bytes) | 1,264,547,520 | 157,530,240 |
| Size | 1.2 GB | 150.2 MB |
| Events in quadrant A | 7,065,322 | 1,116,067 |
| Events in quadrant B | 12,102,112 | 1,075,419 |
| Events in quadrant C | 15,482,247 | 831,366 |
| Events in quadrant D | 11,258,268 | 938,191 |
| Mode M9 | |||
|---|---|---|---|
| Quadrant | BADHDUFLAG | Total packets | Discarded packets |
| A | 0 | 27 | 0 |
| B | 0 | 28 | 0 |
| C | 0 | 28 | 0 |
| D | 0 | 28 | 0 |
| Mode SS | |||
|---|---|---|---|
| Quadrant | BADHDUFLAG | Total packets | Discarded packets |
| A | 0 | 236 | 0 |
| B | 0 | 236 | 0 |
| C | 0 | 236 | 0 |
| D | 0 | 236 | 0 |
| Mode M0 | |||
|---|---|---|---|
| Quadrant | BADHDUFLAG | Total packets | Discarded packets |
| A | 0 | 29519 | 3 |
| B | 0 | 44171 | 4 |
| C | 0 | 54230 | 3 |
| D | 0 | 41736 | 3 |
| Quadrant | Total seconds | Saturated seconds | Saturation percentage |
|---|---|---|---|
| A | 11686 | 400 | 3.422899% |
| B | 11685 | 1854 | 15.866496% |
| C | 11685 | 3137 | 26.846384% |
| D | 11685 | 1363 | 11.664527% |
Noise dominated data is calculated using 1-second bins in cleaned event files. If a bin has >2000 counts, and if more than 50% of those come from <1% of pixels, then it is considered to be noise-dominated and hence unusable.
| Quadrant | # 1 sec bins | Bins with >0 counts | Bins with >2000 counts | High rate bins dominated by noise | Noise dominated (total time) | Noise dominated (detector-on time) | Marked lightcurve |
|---|---|---|---|---|---|---|---|
| A | 14066 | 11688 | 288 | 288 | 2.05% | 2.46% | 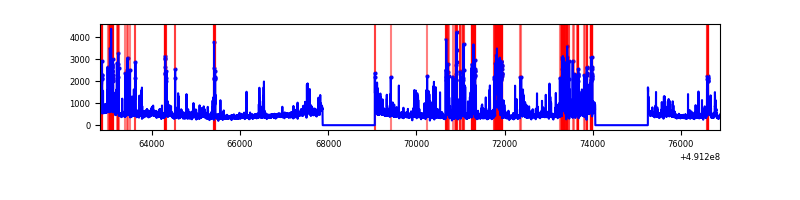 |
| B | 14065 | 11687 | 1309 | 1309 | 9.31% | 11.20% | 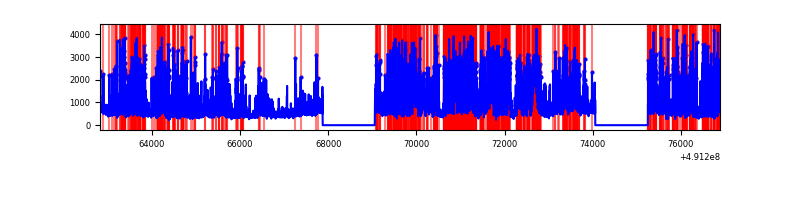 |
| C | 14065 | 11687 | 3117 | 3117 | 22.16% | 26.67% | 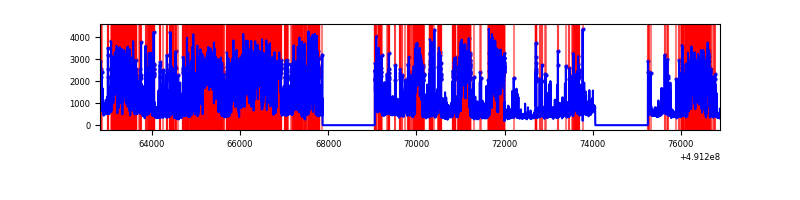 |
| D | 14065 | 11687 | 1181 | 1181 | 8.40% | 10.11% | 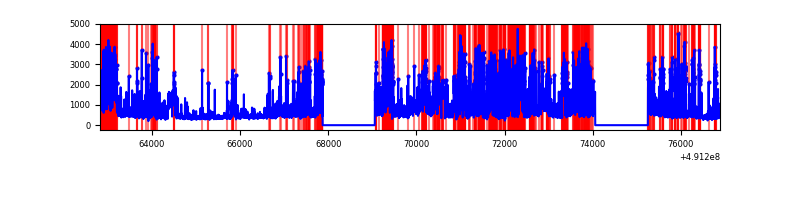 |
Top three noisy pixels from each quadrant. If the there are fewer than three noisy pixels in the level2.evt file, extra rows are filled as -1
| Pixel properties | Quadrant properties | ||||||
|---|---|---|---|---|---|---|---|
| Quadrant | DetID | PixID | Counts | Sigma | Mean | Median | Sigma |
| A | 3 | 62 | 729122 | 2444.38 | 1195 | 1169 | 297.8 |
| A | 8 | 249 | 586589 | 1965.77 | 1195 | 1169 | 297.8 |
| A | 15 | 174 | 342283 | 1145.42 | 1195 | 1169 | 297.8 |
| B | 10 | 191 | 4099541 | 17123.44 | 1143 | 1106 | 239.3 |
| B | 1 | 239 | 1720164 | 7182.3 | 1143 | 1106 | 239.3 |
| B | 4 | 81 | 715639 | 2985.35 | 1143 | 1106 | 239.3 |
| C | 0 | 240 | 4789877 | 15977.14 | 1078 | 1067 | 299.7 |
| C | 1 | 241 | 2106201 | 7023.46 | 1078 | 1067 | 299.7 |
| C | 10 | 22 | 1737208 | 5792.37 | 1078 | 1067 | 299.7 |
| D | 10 | 172 | 1904581 | 5910.96 | 1114 | 1061 | 322.0 |
| D | 5 | 70 | 1705326 | 5292.21 | 1114 | 1061 | 322.0 |
| D | 9 | 19 | 1338801 | 4154.05 | 1114 | 1061 | 322.0 |
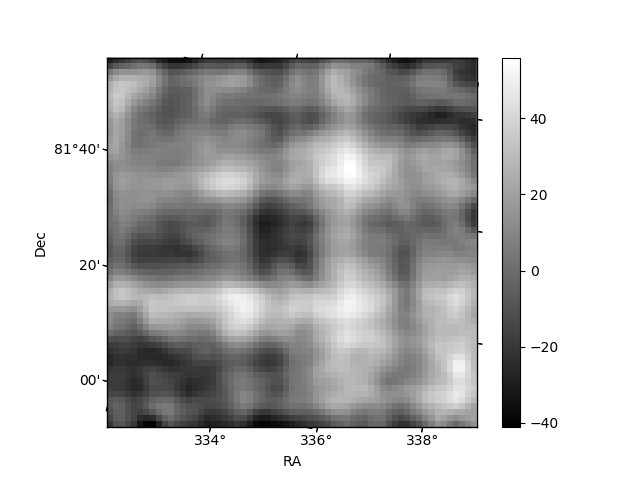
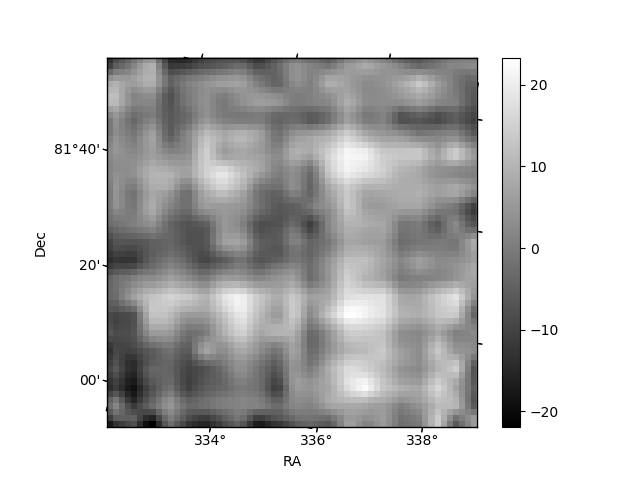
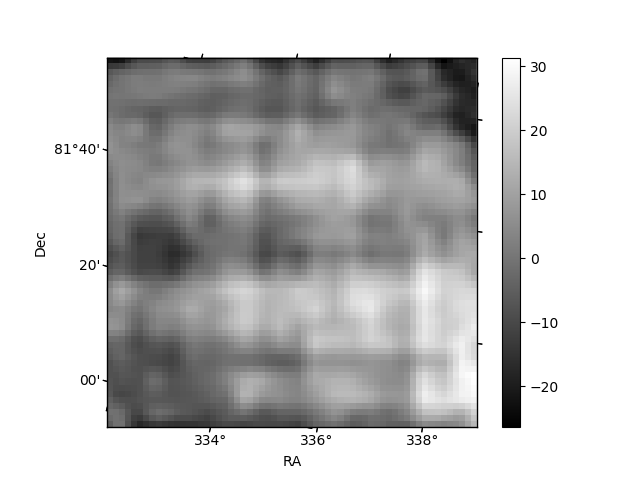
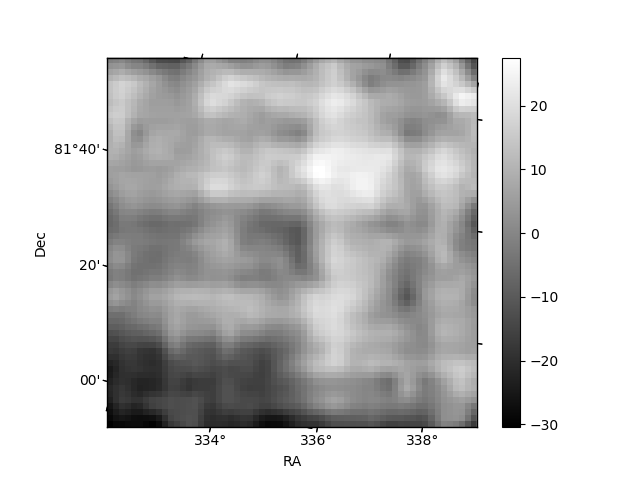
Histogram calculated using DETX and DETY for each event in the final _common_clean file
| Quadrant A | 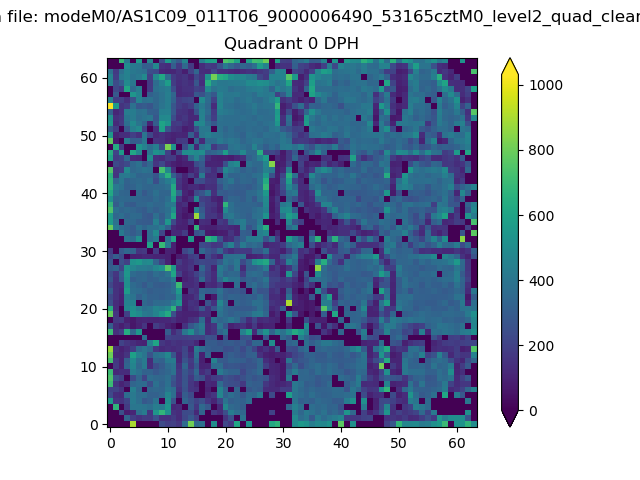 |
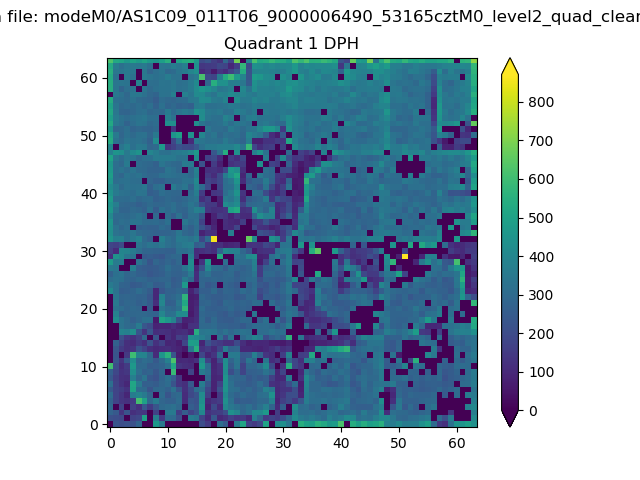 |
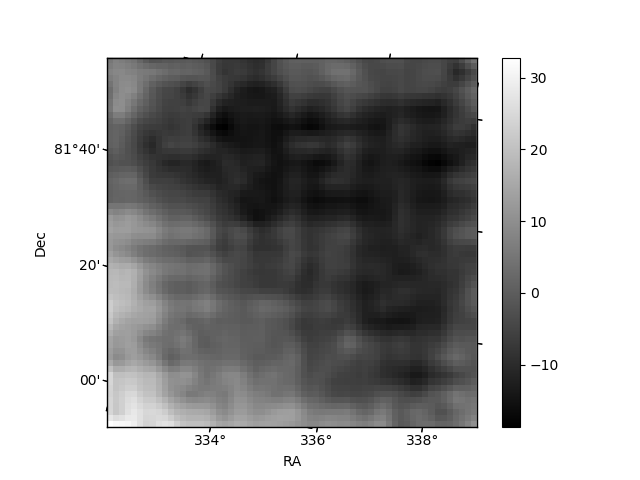
Quadrant B |
|---|---|---|---|
| Quadrant D | 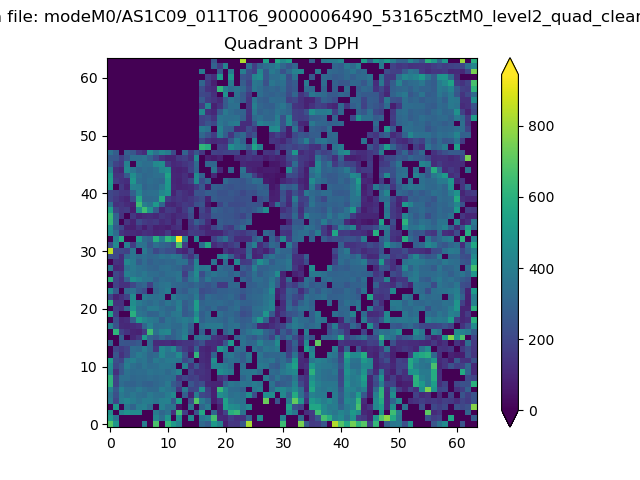 |
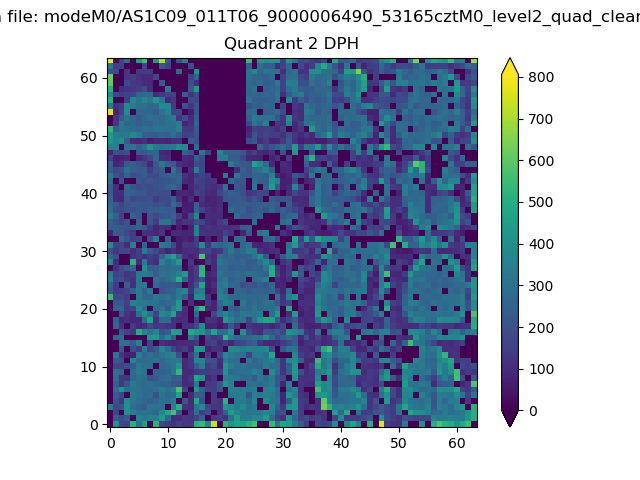 |
Quadrant C |
| Plot type | Count rate plots | Images |
|---|---|---|
| Comparison with Poisson distribution Blue bars denote a histogram of data divided into 1 sec bins. Red curve is a Poisson curve with rate = median count rate of data. |
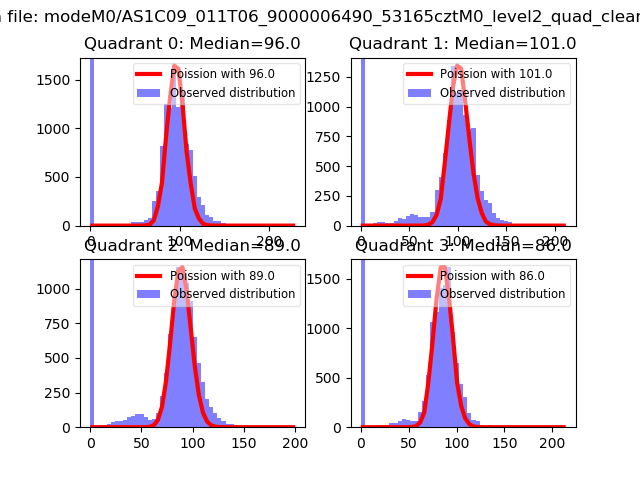 |
 |
| Quadrant-wise count rates Data is divided into 100 sec bins |
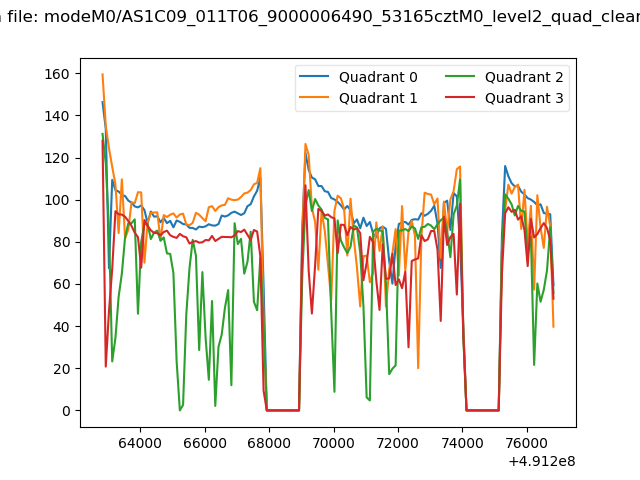 |
|
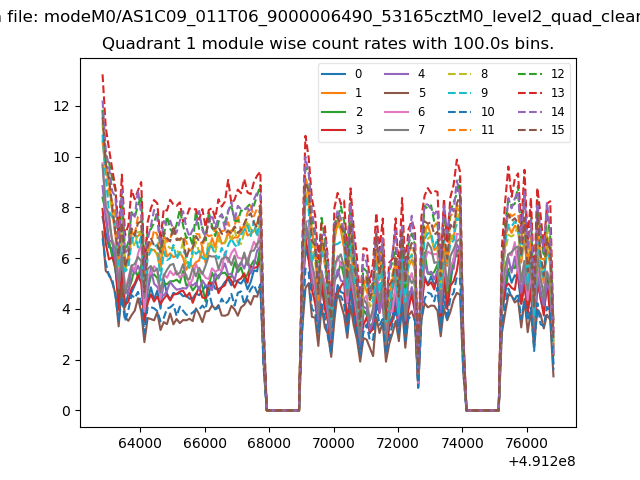
| Module-wise count rates for Quadrant A Data is divided into 100 sec bins |
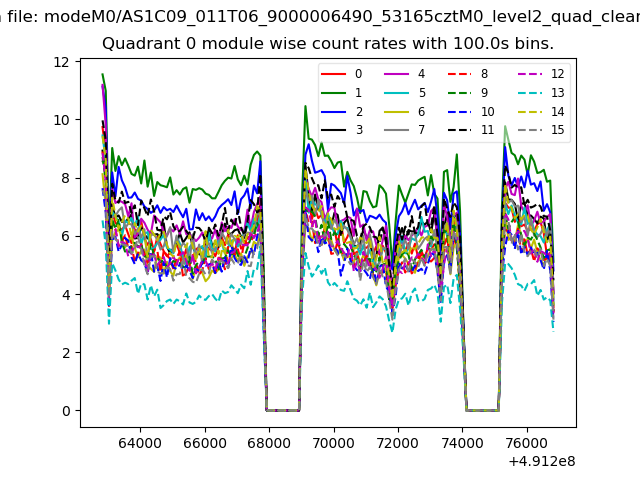 |
 |
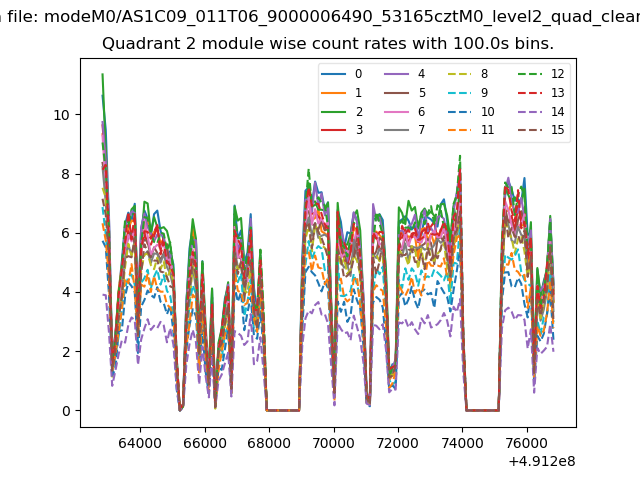
| Module-wise count rates for Quadrant B Data is divided into 100 sec bins |
 |
 |
| Module-wise count rates for Quadrant C Data is divided into 100 sec bins |
 |
 |
| Module-wise count rates for Quadrant D Data is divided into 100 sec bins |
 |
 |
| Parameter | Plot |
|---|---|
| CZT HV Monitor | 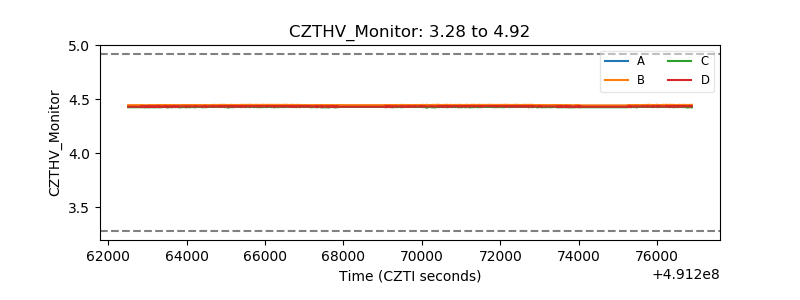 |
| D_VDD | 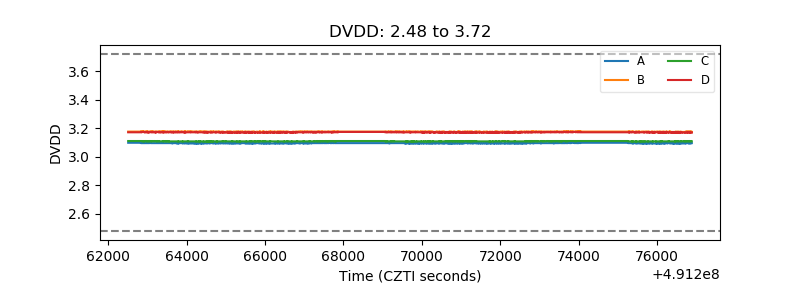 |
| Temperature 1 | 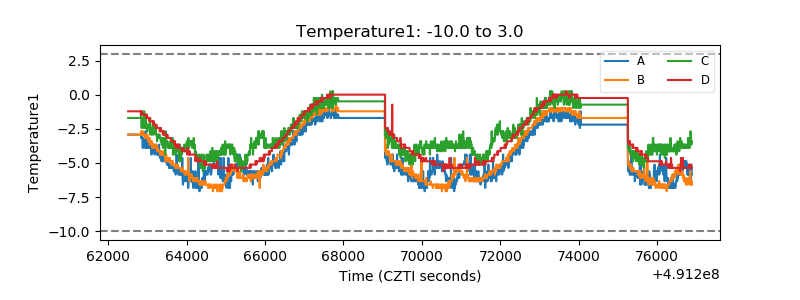 |
| Veto HV Monitor |  |
| Veto LLD | 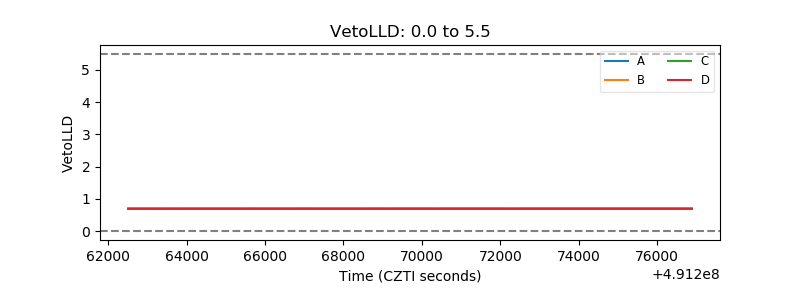 |
| Alpha Counter | 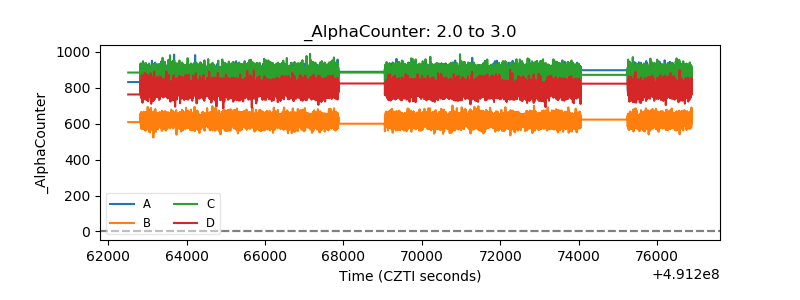 |
| _CPM_Rate | 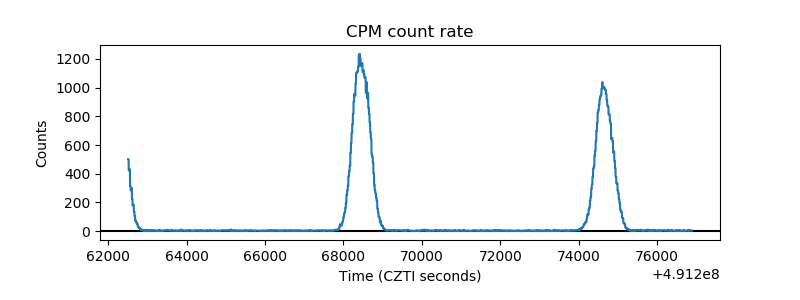 |
| CZT Counter | 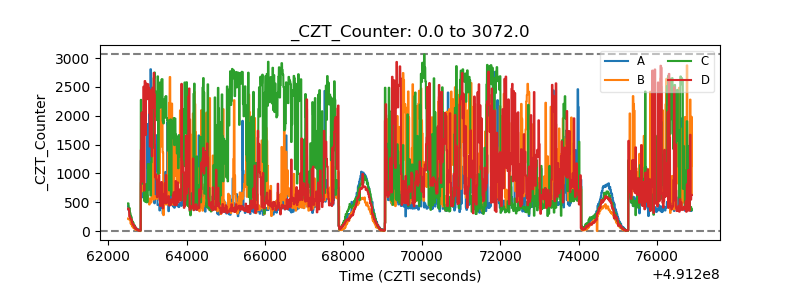 |
| +2.5 Volts monitor |  |
| +5 Volts monitor |  |
| _ROLL_ROT | 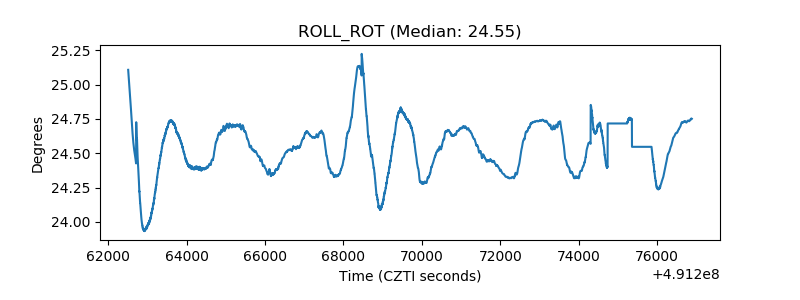 |
| _Roll_DEC | 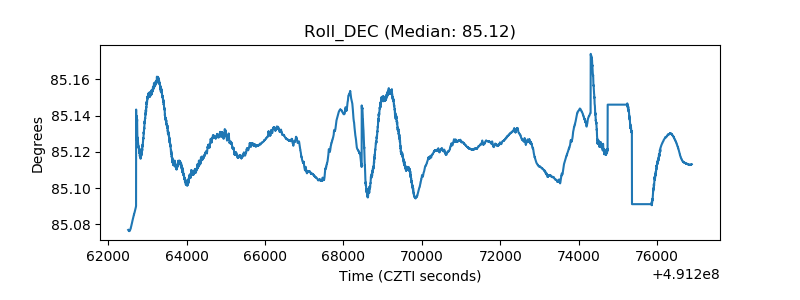 |
| _Roll_RA | 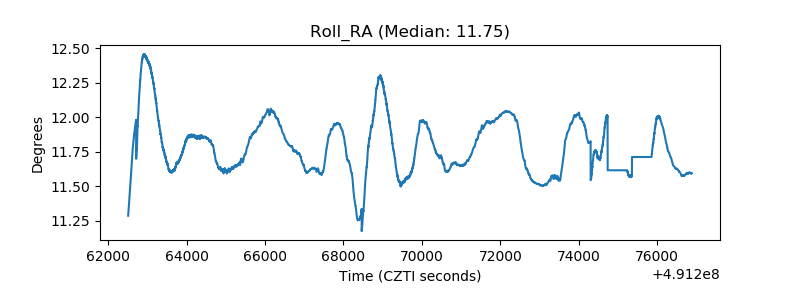 |
| Veto Counter | 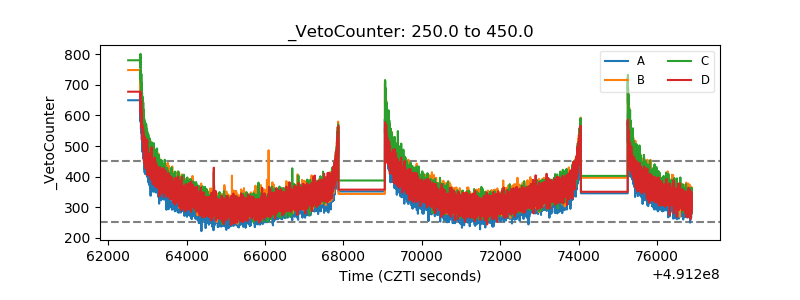 |