| Param | Original file | Final file |
|---|---|---|
| Filename | modeM0/AS1C09_011T06_9000006490_53169cztM0_level2.fits | modeM0/AS1C09_011T06_9000006490_53169cztM0_level2_quad_clean.evt |
| Size (bytes) | 1,208,361,600 | 75,113,280 |
| Size | 1.1 GB | 71.6 MB |
| Events in quadrant A | 9,587,365 | 513,718 |
| Events in quadrant B | 4,649,496 | 731,167 |
| Events in quadrant C | 10,505,391 | 477,166 |
| Events in quadrant D | 19,408,347 | 29,533 |
| Mode SS | |||
|---|---|---|---|
| Quadrant | BADHDUFLAG | Total packets | Discarded packets |
| A | 0 | 150 | 0 |
| B | 0 | 150 | 0 |
| C | 0 | 150 | 0 |
| D | 0 | 150 | 0 |
| Mode M0 | |||
|---|---|---|---|
| Quadrant | BADHDUFLAG | Total packets | Discarded packets |
| A | 0 | 33739 | 0 |
| B | 0 | 19260 | 0 |
| C | 0 | 36400 | 0 |
| D | 0 | 62907 | 0 |
| Quadrant | Total seconds | Saturated seconds | Saturation percentage |
|---|---|---|---|
| A | 7505 | 2099 | 27.968021% |
| B | 7506 | 282 | 3.756994% |
| C | 7506 | 2414 | 32.160938% |
| D | 7505 | 7241 | 96.482345% |
Noise dominated data is calculated using 1-second bins in cleaned event files. If a bin has >2000 counts, and if more than 50% of those come from <1% of pixels, then it is considered to be noise-dominated and hence unusable.
| Quadrant | # 1 sec bins | Bins with >0 counts | Bins with >2000 counts | High rate bins dominated by noise | Noise dominated (total time) | Noise dominated (detector-on time) | Marked lightcurve |
|---|---|---|---|---|---|---|---|
| A | 7505 | 7505 | 1965 | 1965 | 26.18% | 26.18% | 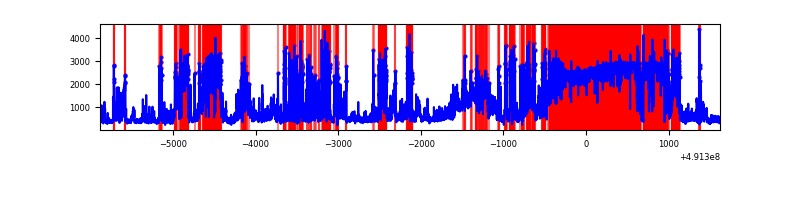 |
| B | 7506 | 7506 | 155 | 155 | 2.07% | 2.07% | 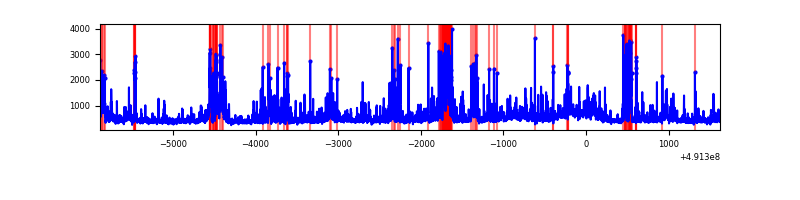 |
| C | 7506 | 7506 | 2016 | 2016 | 26.86% | 26.86% | 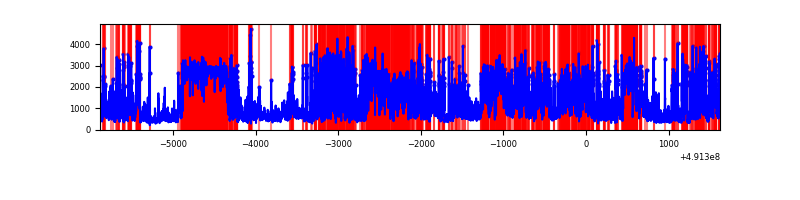 |
| D | 7504 | 7504 | 6938 | 6938 | 92.46% | 92.46% | 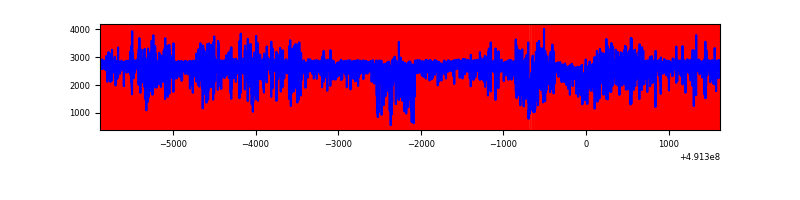 |
Top three noisy pixels from each quadrant. If the there are fewer than three noisy pixels in the level2.evt file, extra rows are filled as -1
| Pixel properties | Quadrant properties | ||||||
|---|---|---|---|---|---|---|---|
| Quadrant | DetID | PixID | Counts | Sigma | Mean | Median | Sigma |
| A | 12 | 3 | 3859539 | 24009.6 | 645 | 628 | 160.7 |
| A | 0 | 8 | 1186735 | 7379.79 | 645 | 628 | 160.7 |
| A | 12 | 80 | 776662 | 4828.37 | 645 | 628 | 160.7 |
| B | 10 | 191 | 526037 | 3281.42 | 752 | 726 | 160.1 |
| B | 1 | 239 | 343101 | 2138.69 | 752 | 726 | 160.1 |
| B | 2 | 249 | 321995 | 2006.85 | 752 | 726 | 160.1 |
| C | 4 | 5 | 2059184 | 11956.19 | 627 | 618 | 172.2 |
| C | 0 | 240 | 2015940 | 11705.03 | 627 | 618 | 172.2 |
| C | 1 | 241 | 1657152 | 9621.18 | 627 | 618 | 172.2 |
| D | 15 | 125 | 17226695 | 204349.11 | 288 | 273 | 84.3 |
| D | 12 | 3 | 523689 | 6209.04 | 288 | 273 | 84.3 |
| D | 2 | 249 | 307013 | 3638.72 | 288 | 273 | 84.3 |
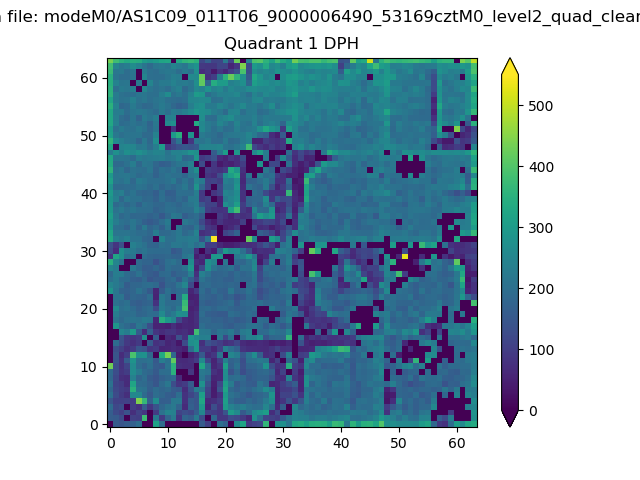
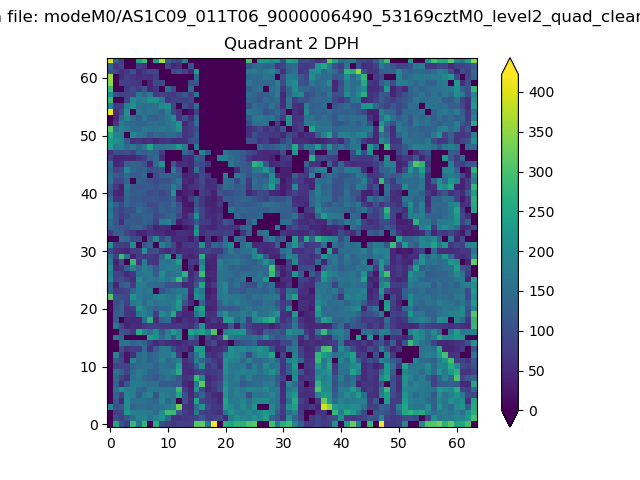
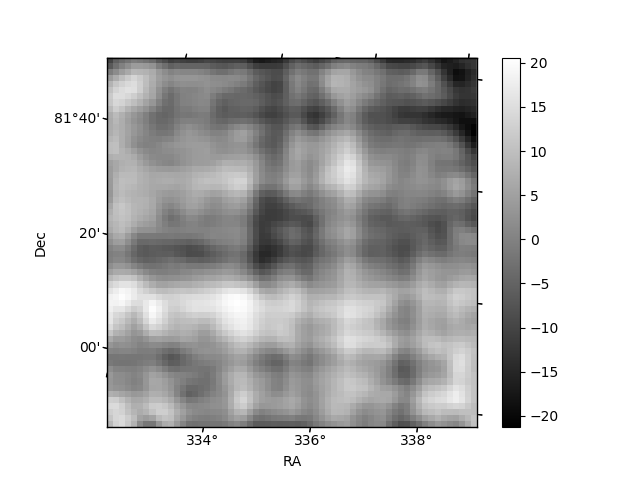
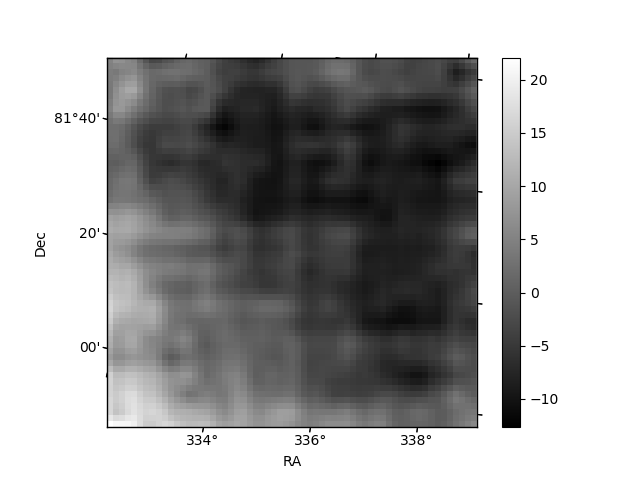
Histogram calculated using DETX and DETY for each event in the final _common_clean file
| Quadrant A |  |
 |
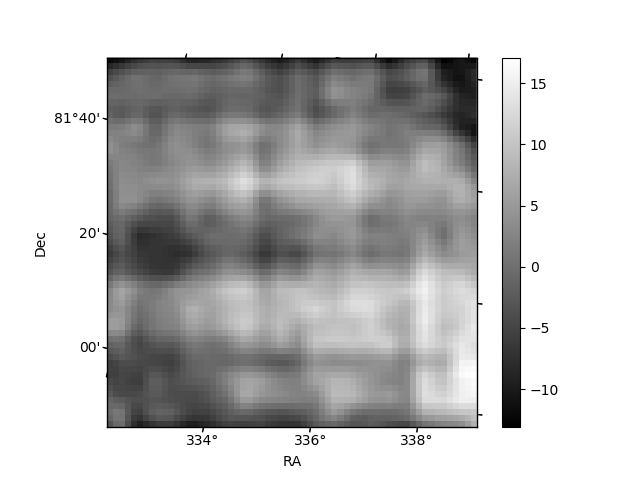
Quadrant B |
|---|---|---|---|
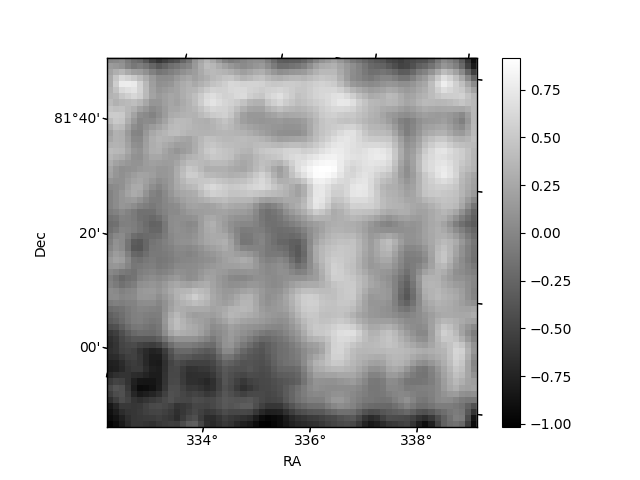
| Quadrant D | 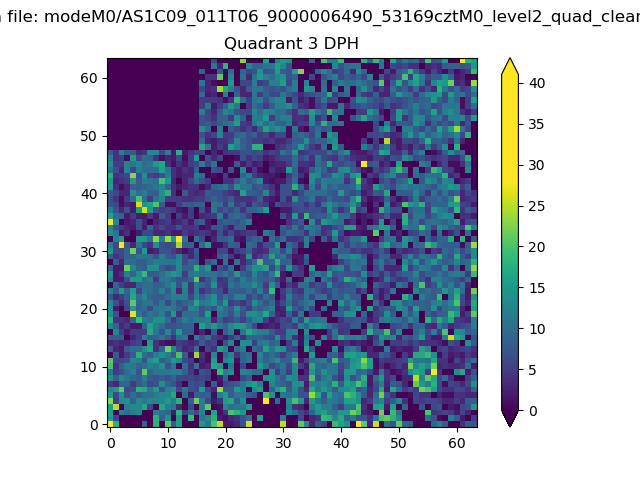 |
 |
Quadrant C |
| Plot type | Count rate plots | Images |
|---|---|---|
| Comparison with Poisson distribution Blue bars denote a histogram of data divided into 1 sec bins. Red curve is a Poisson curve with rate = median count rate of data. |
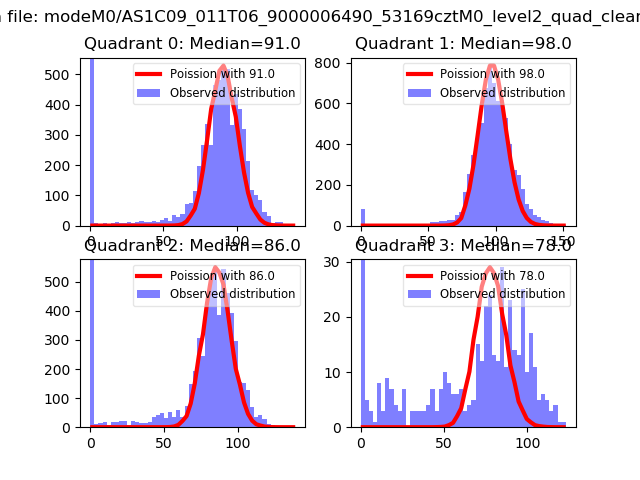 |
 |
| Quadrant-wise count rates Data is divided into 100 sec bins |
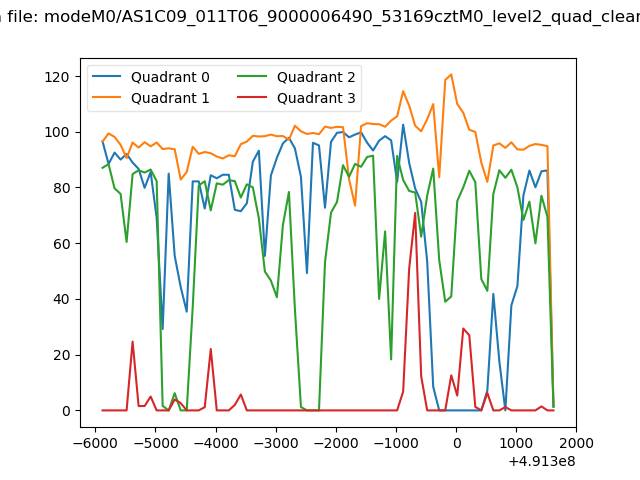 |
|
| Module-wise count rates for Quadrant A Data is divided into 100 sec bins |
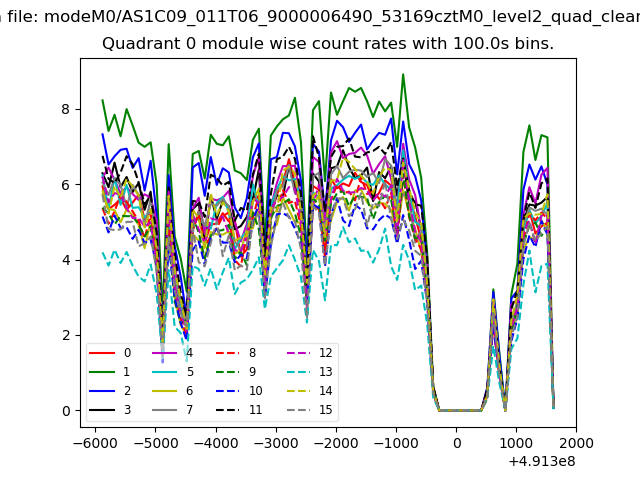 |
 |
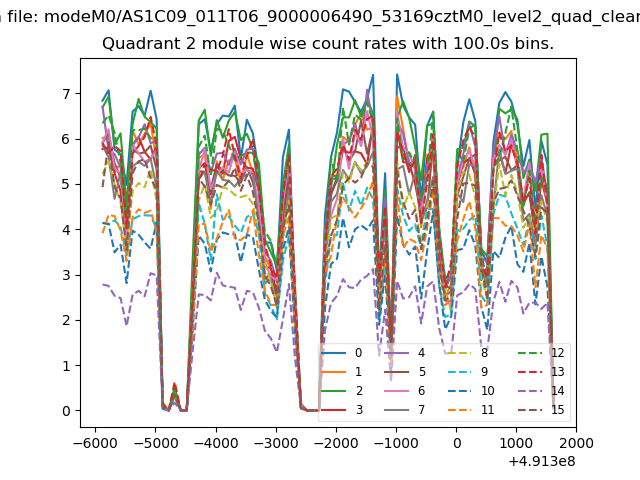
| Module-wise count rates for Quadrant B Data is divided into 100 sec bins |
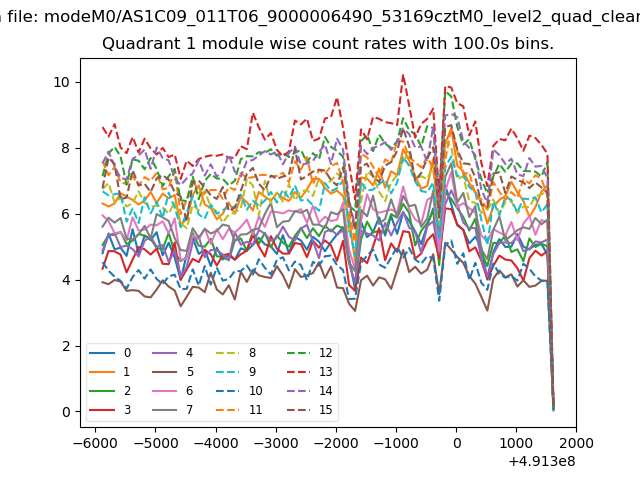 |
 |
| Module-wise count rates for Quadrant C Data is divided into 100 sec bins |
 |
 |
| Module-wise count rates for Quadrant D Data is divided into 100 sec bins |
 |
 |
| Parameter | Plot |
|---|---|
| CZT HV Monitor | 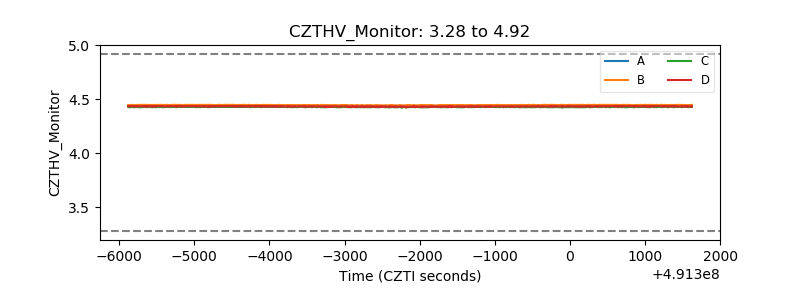 |
| D_VDD | 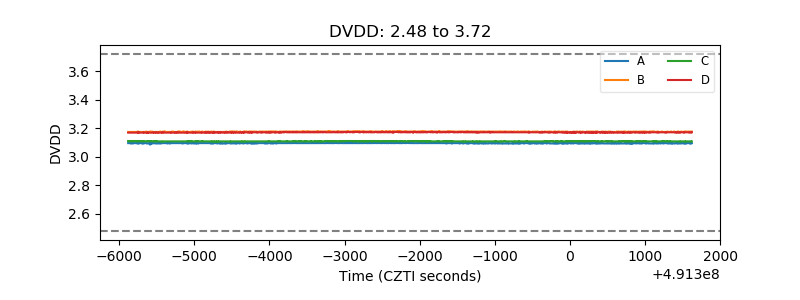 |
| Temperature 1 | 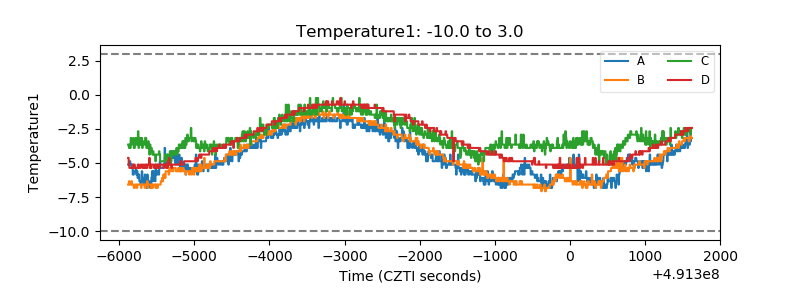 |
| Veto HV Monitor | 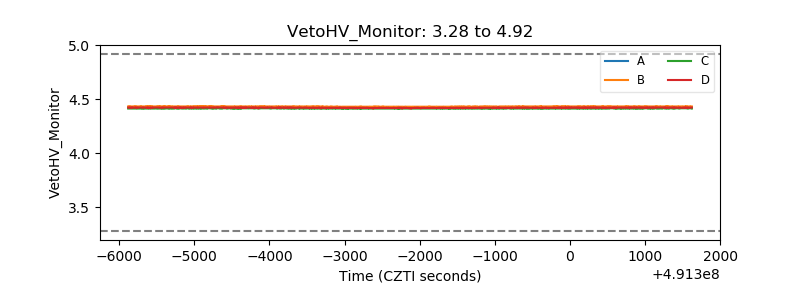 |
| Veto LLD | 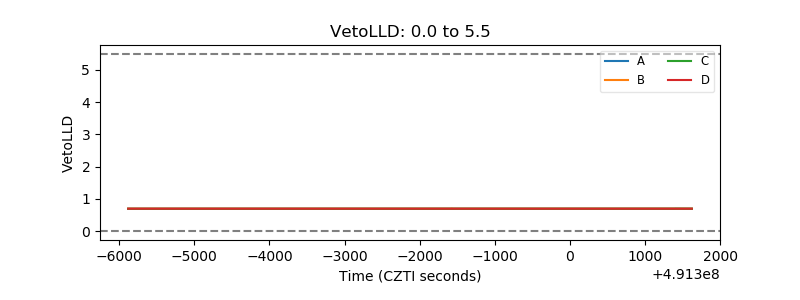 |
| Alpha Counter | 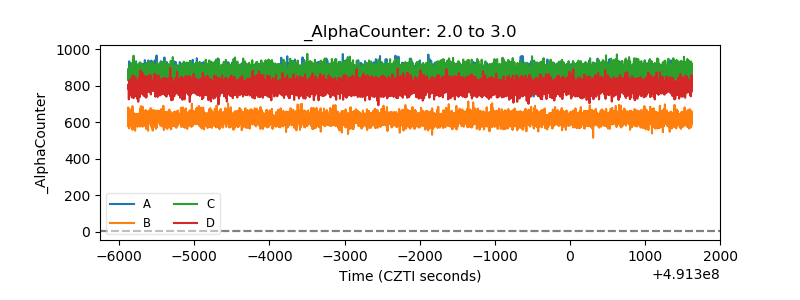 |
| _CPM_Rate | 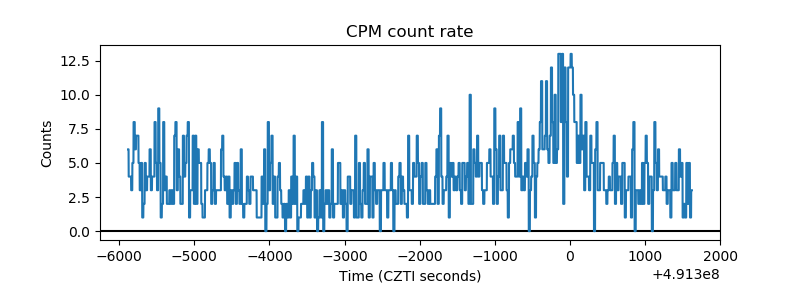 |
| CZT Counter | 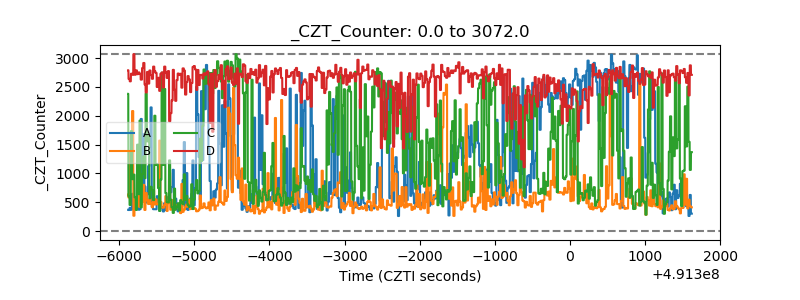 |
| +2.5 Volts monitor |  |
| +5 Volts monitor |  |
| _ROLL_ROT | 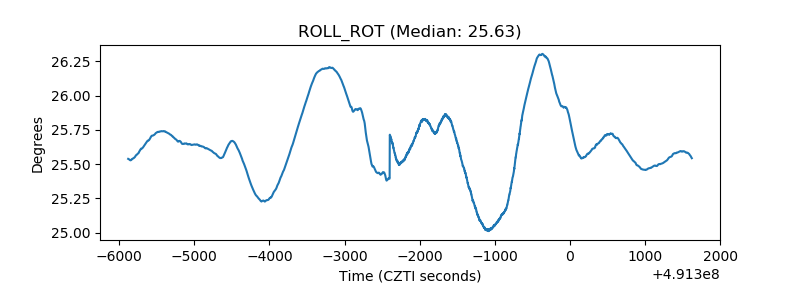 |
| _Roll_DEC | 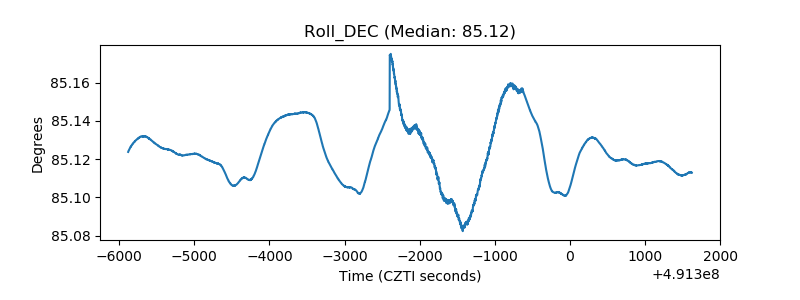 |
| _Roll_RA | 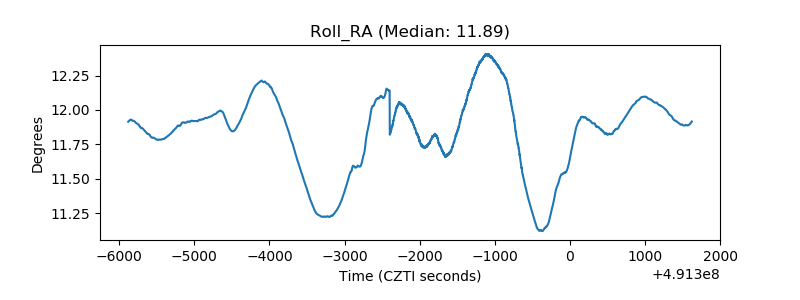 |
| Veto Counter | 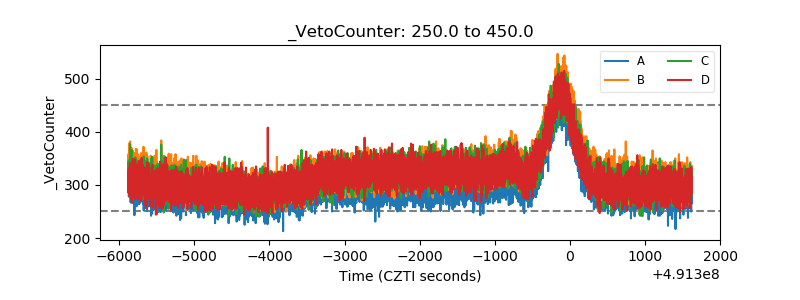 |