| Param | Original file | Final file |
|---|---|---|
| Filename | modeM0/AS1C09_011T06_9000006490_53170cztM0_level2.fits | modeM0/AS1C09_011T06_9000006490_53170cztM0_level2_quad_clean.evt |
| Size (bytes) | 1,099,235,520 | 76,944,960 |
| Size | 1.0 GB | 73.4 MB |
| Events in quadrant A | 6,438,101 | 624,263 |
| Events in quadrant B | 5,357,740 | 684,277 |
| Events in quadrant C | 9,171,257 | 509,218 |
| Events in quadrant D | 19,163,856 | 6,946 |
| Mode SS | |||
|---|---|---|---|
| Quadrant | BADHDUFLAG | Total packets | Discarded packets |
| A | 0 | 146 | 0 |
| B | 0 | 146 | 0 |
| C | 0 | 146 | 0 |
| D | 0 | 146 | 0 |
| Mode M0 | |||
|---|---|---|---|
| Quadrant | BADHDUFLAG | Total packets | Discarded packets |
| A | 0 | 24175 | 0 |
| B | 0 | 20988 | 0 |
| C | 0 | 32283 | 0 |
| D | 0 | 62031 | 0 |
| Quadrant | Total seconds | Saturated seconds | Saturation percentage |
|---|---|---|---|
| A | 7242 | 525 | 7.249379% |
| B | 7242 | 419 | 5.785695% |
| C | 7243 | 1698 | 23.443325% |
| D | 7243 | 7184 | 99.185420% |
Noise dominated data is calculated using 1-second bins in cleaned event files. If a bin has >2000 counts, and if more than 50% of those come from <1% of pixels, then it is considered to be noise-dominated and hence unusable.
| Quadrant | # 1 sec bins | Bins with >0 counts | Bins with >2000 counts | High rate bins dominated by noise | Noise dominated (total time) | Noise dominated (detector-on time) | Marked lightcurve |
|---|---|---|---|---|---|---|---|
| A | 7242 | 7242 | 481 | 481 | 6.64% | 6.64% | 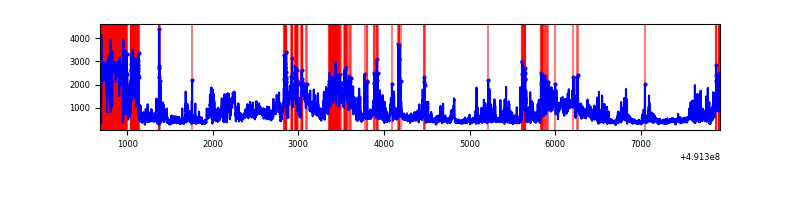 |
| B | 7242 | 7242 | 262 | 262 | 3.62% | 3.62% | 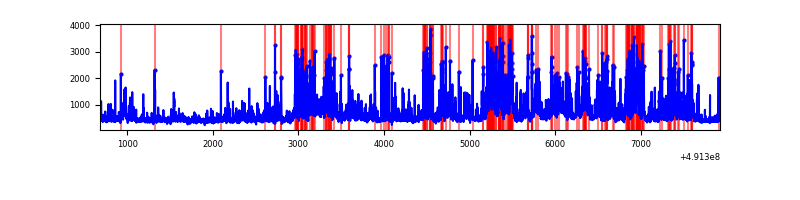 |
| C | 7243 | 7243 | 1536 | 1536 | 21.21% | 21.21% | 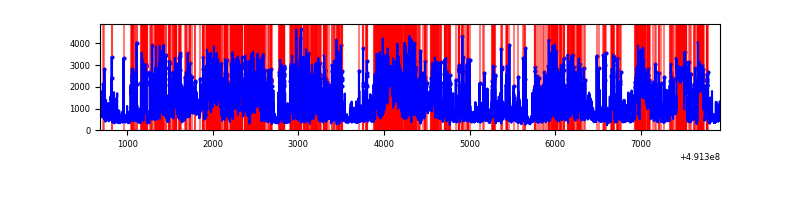 |
| D | 7242 | 7242 | 7080 | 7080 | 97.76% | 97.76% | 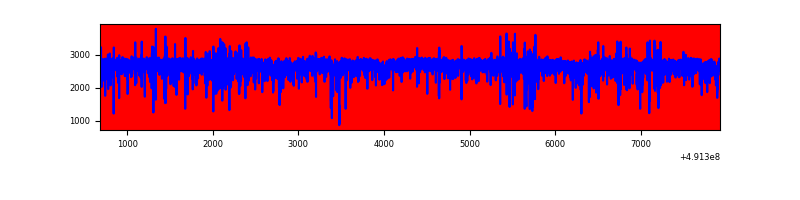 |
Top three noisy pixels from each quadrant. If the there are fewer than three noisy pixels in the level2.evt file, extra rows are filled as -1
| Pixel properties | Quadrant properties | ||||||
|---|---|---|---|---|---|---|---|
| Quadrant | DetID | PixID | Counts | Sigma | Mean | Median | Sigma |
| A | 12 | 80 | 1651702 | 9383.4 | 707 | 689 | 176.0 |
| A | 12 | 3 | 927291 | 5266.27 | 707 | 689 | 176.0 |
| A | 8 | 249 | 583549 | 3312.64 | 707 | 689 | 176.0 |
| B | 10 | 191 | 1070182 | 7114.66 | 710 | 687 | 150.3 |
| B | 1 | 239 | 492462 | 3271.46 | 710 | 687 | 150.3 |
| B | 2 | 249 | 426678 | 2833.85 | 710 | 687 | 150.3 |
| C | 4 | 5 | 2086266 | 11875.4 | 632 | 624 | 175.6 |
| C | 15 | 224 | 1662814 | 9464.32 | 632 | 624 | 175.6 |
| C | 1 | 241 | 794826 | 4522.09 | 632 | 624 | 175.6 |
| D | 15 | 125 | 17856463 | 291609.65 | 209 | 199 | 61.2 |
| D | 2 | 249 | 294665 | 4808.91 | 209 | 199 | 61.2 |
| D | 1 | 0 | 42485 | 690.57 | 209 | 199 | 61.2 |
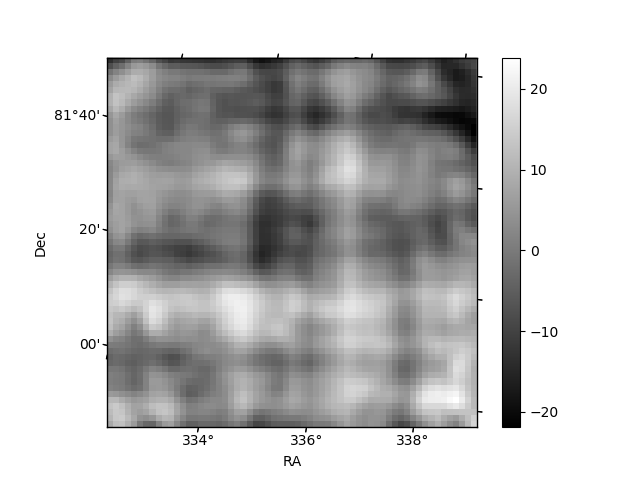
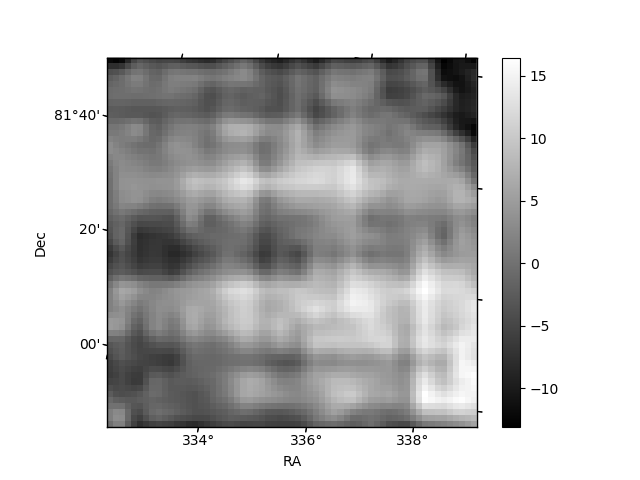
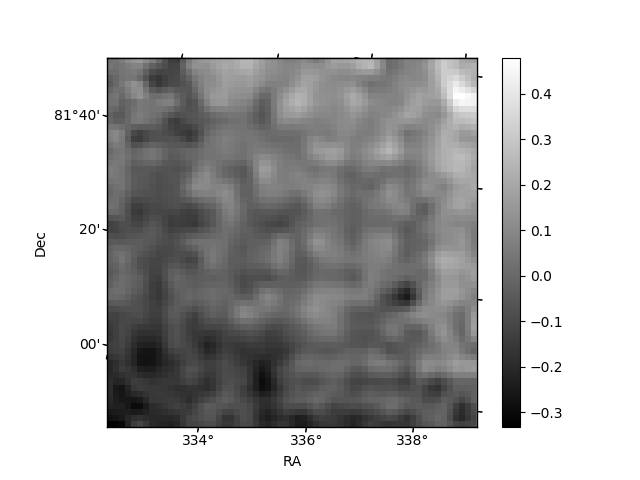
Histogram calculated using DETX and DETY for each event in the final _common_clean file
| Quadrant A | 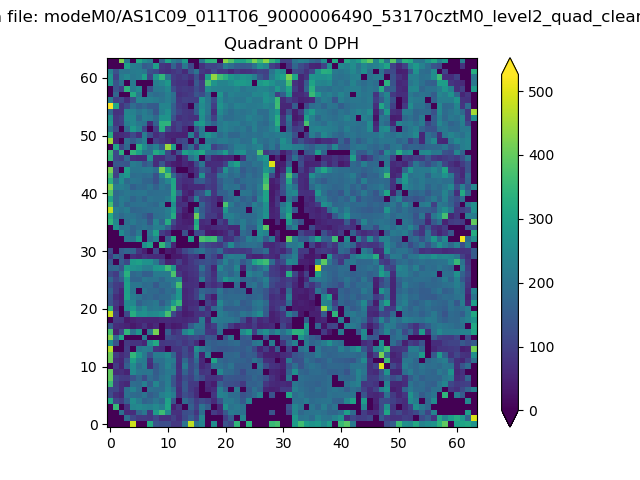 |
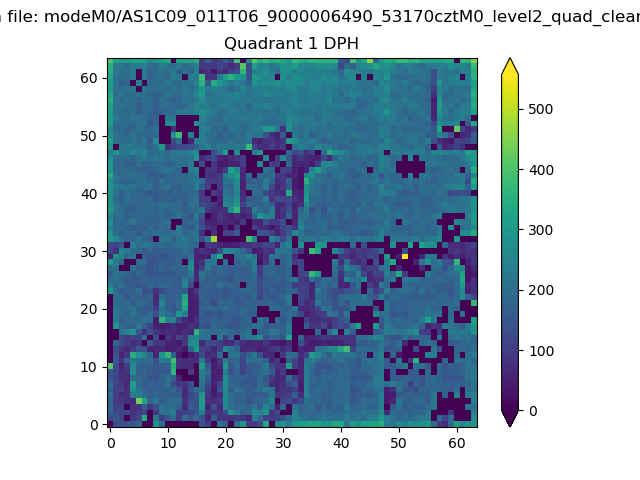 |
Quadrant B |
|---|---|---|---|
| Quadrant D | 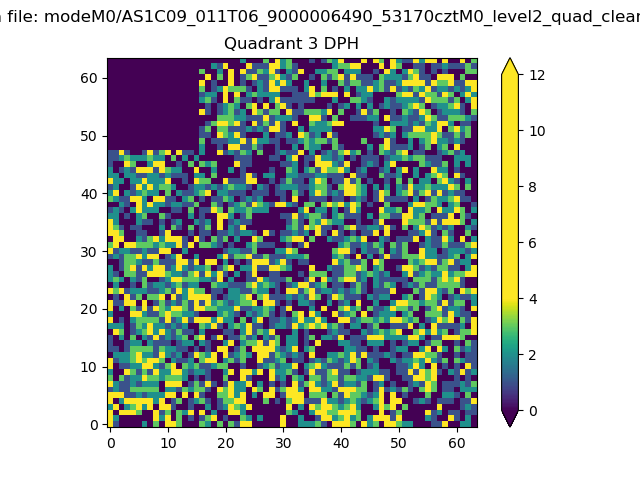 |
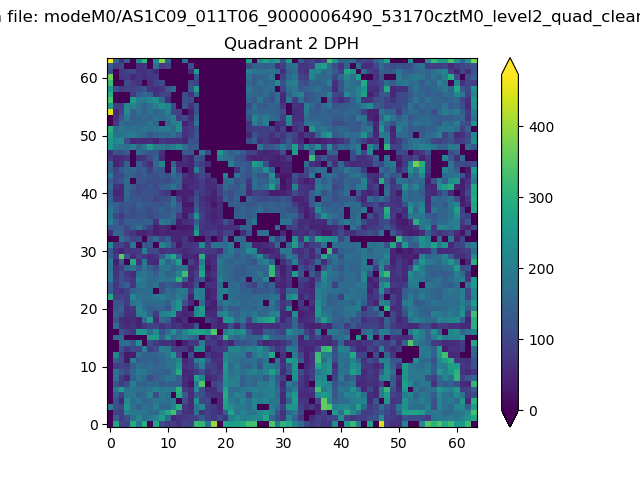 |
Quadrant C |
| Plot type | Count rate plots | Images |
|---|---|---|
| Comparison with Poisson distribution Blue bars denote a histogram of data divided into 1 sec bins. Red curve is a Poisson curve with rate = median count rate of data. |
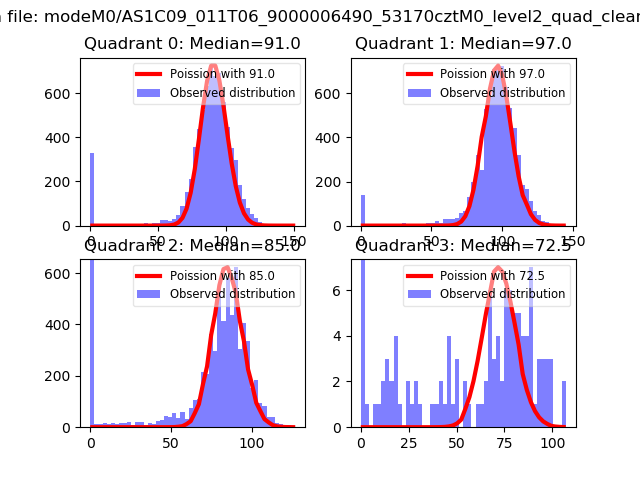 |
 |
| Quadrant-wise count rates Data is divided into 100 sec bins |
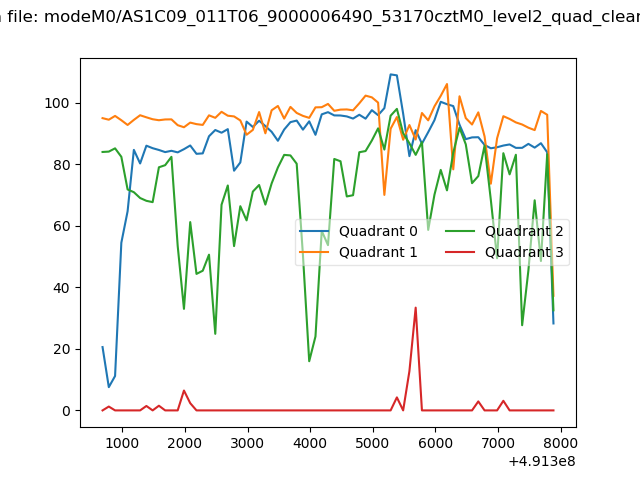 |
|
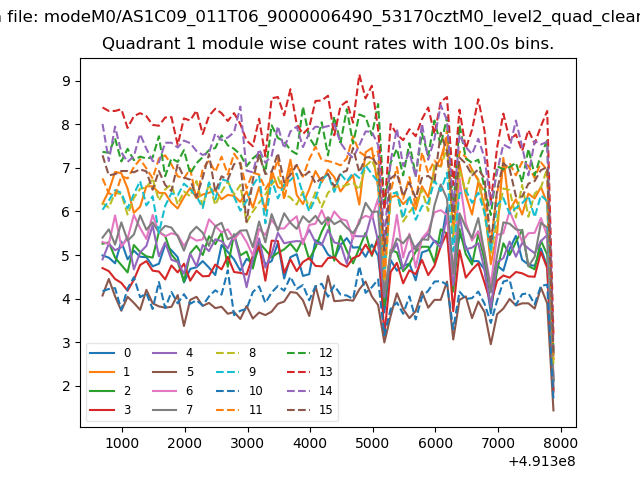
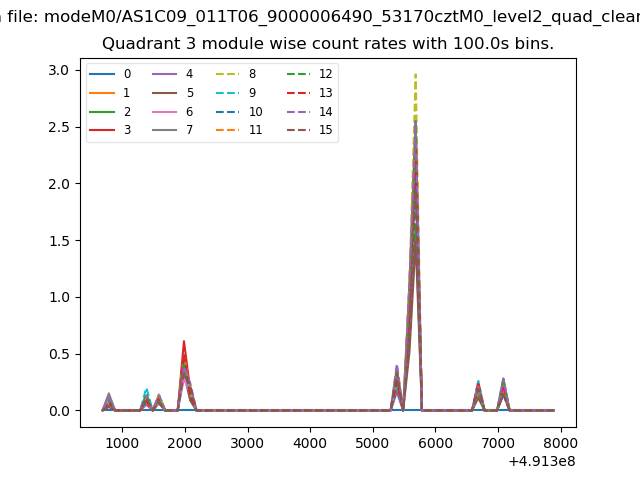
| Module-wise count rates for Quadrant A Data is divided into 100 sec bins |
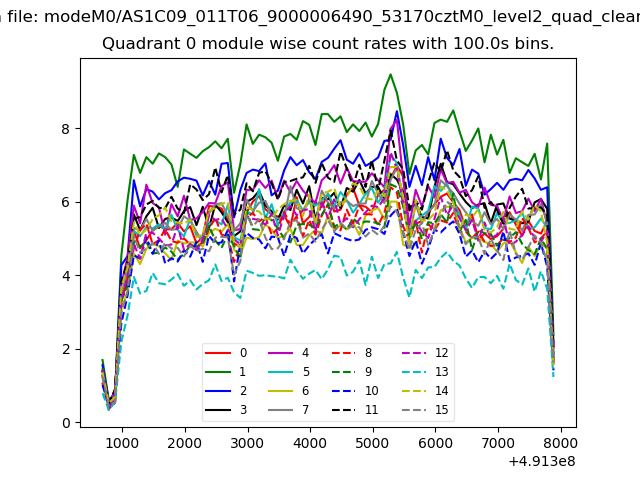 |
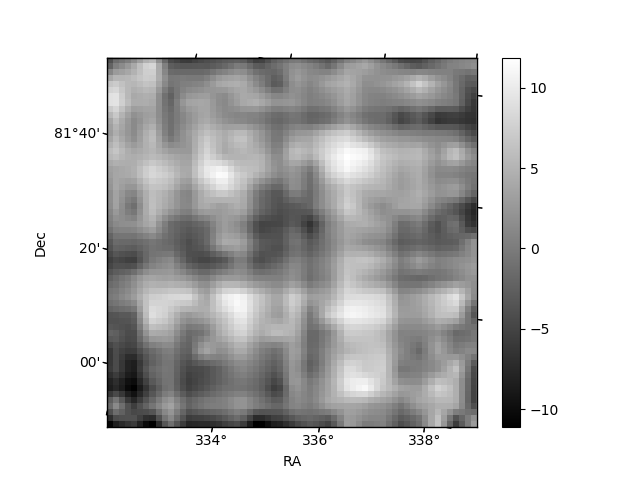 |
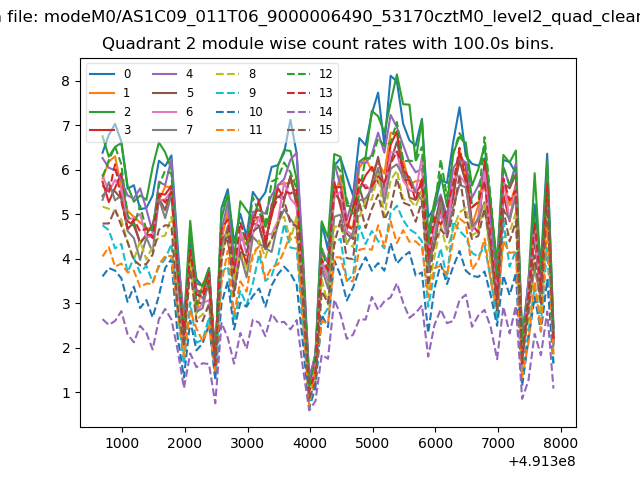
| Module-wise count rates for Quadrant B Data is divided into 100 sec bins |
 |
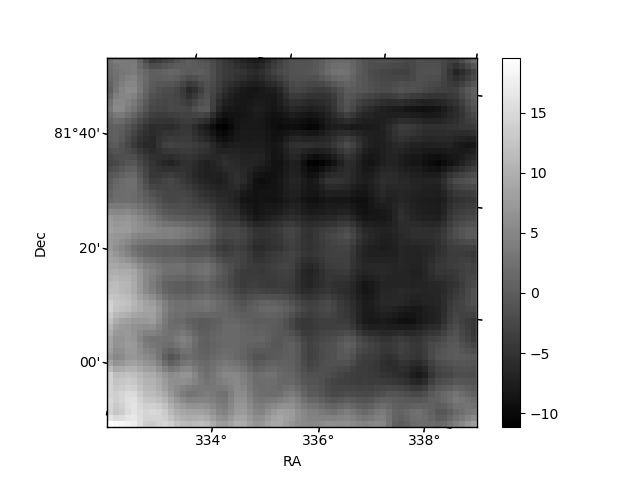 |
| Module-wise count rates for Quadrant C Data is divided into 100 sec bins |
 |
 |
| Module-wise count rates for Quadrant D Data is divided into 100 sec bins |
 |
 |
| Parameter | Plot |
|---|---|
| CZT HV Monitor | 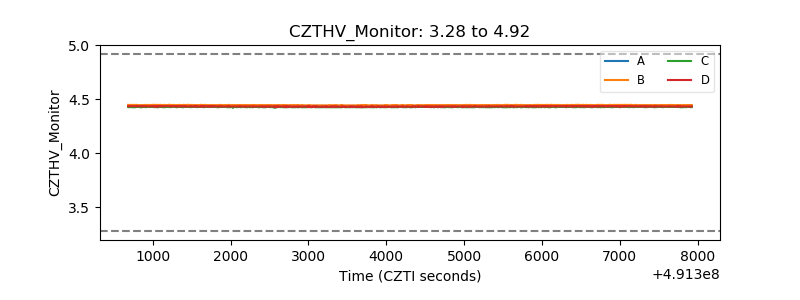 |
| D_VDD | 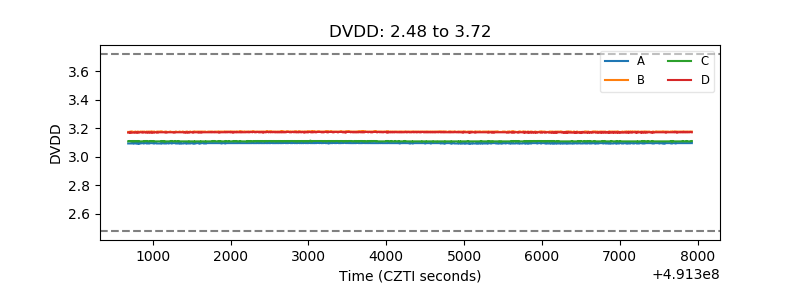 |
| Temperature 1 | 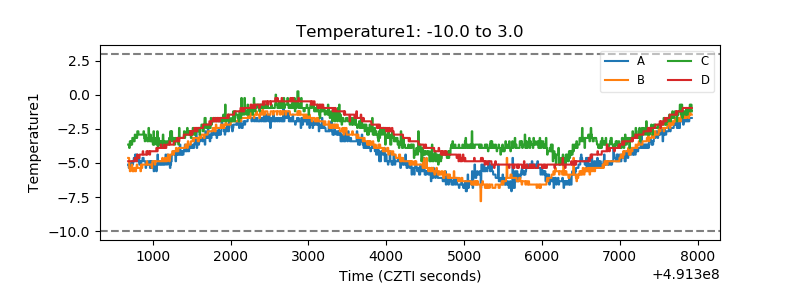 |
| Veto HV Monitor | 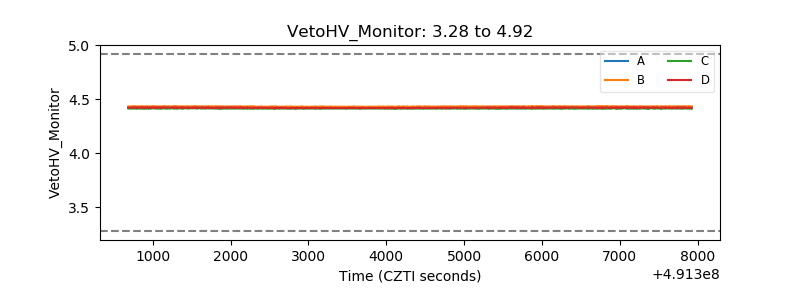 |
| Veto LLD | 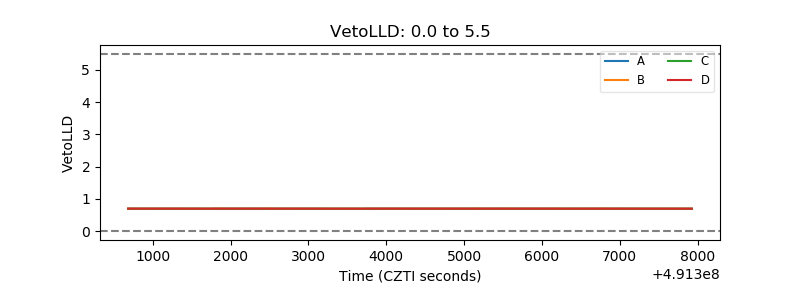 |
| Alpha Counter | 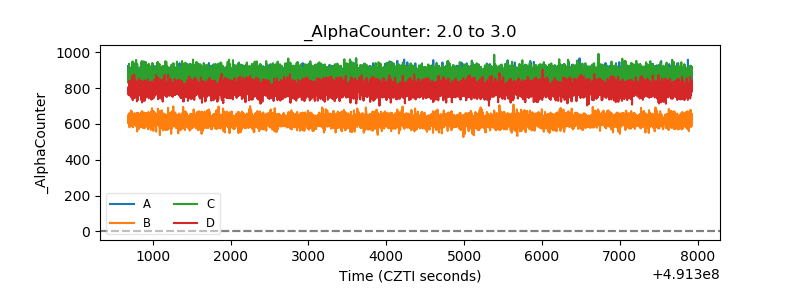 |
| _CPM_Rate | 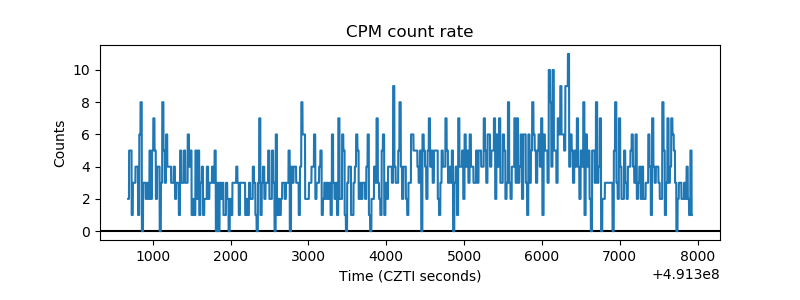 |
| CZT Counter | 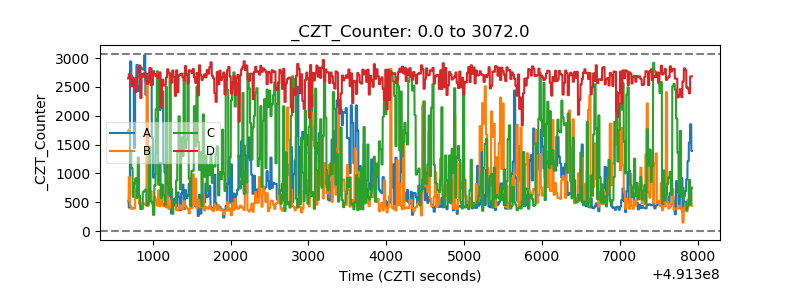 |
| +2.5 Volts monitor |  |
| +5 Volts monitor |  |
| _ROLL_ROT | 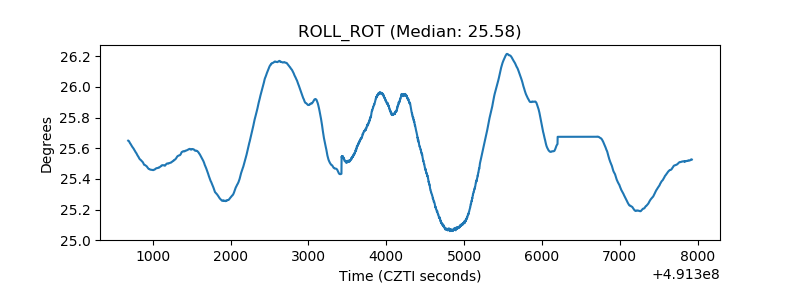 |
| _Roll_DEC | 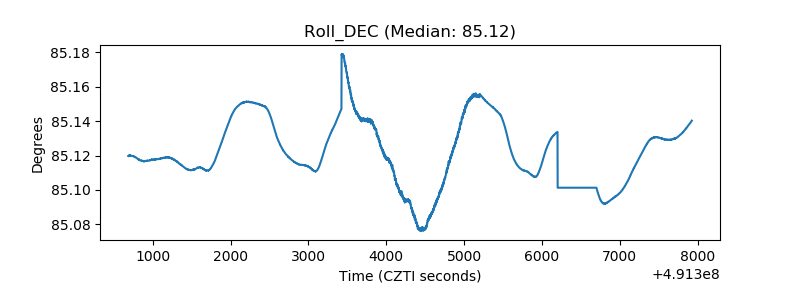 |
| _Roll_RA | 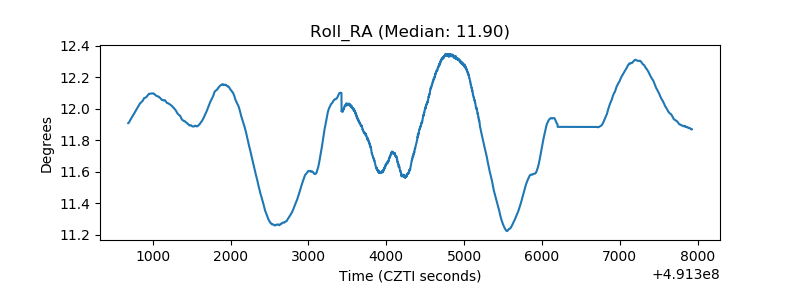 |
| Veto Counter | 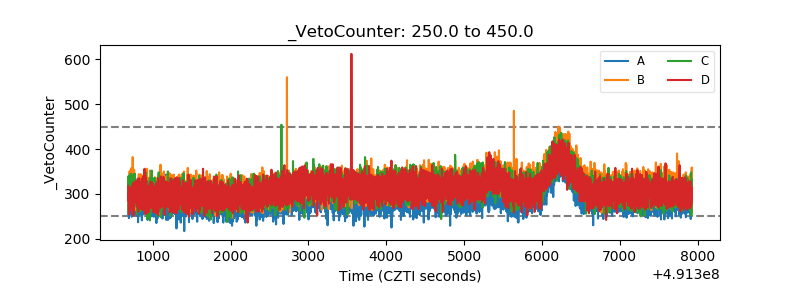 |