| Param | Original file | Final file |
|---|---|---|
| Filename | modeM0/AS1C09_011T06_9000006490_53171cztM0_level2.fits | modeM0/AS1C09_011T06_9000006490_53171cztM0_level2_quad_clean.evt |
| Size (bytes) | 1,043,539,200 | 83,842,560 |
| Size | 995.2 MB | 80.0 MB |
| Events in quadrant A | 6,190,901 | 664,556 |
| Events in quadrant B | 4,901,937 | 731,407 |
| Events in quadrant C | 7,769,741 | 590,375 |
| Events in quadrant D | 19,176,940 | 22,705 |
| Mode SS | |||
|---|---|---|---|
| Quadrant | BADHDUFLAG | Total packets | Discarded packets |
| A | 0 | 152 | 0 |
| B | 0 | 152 | 0 |
| C | 0 | 152 | 0 |
| D | 0 | 152 | 0 |
| Mode M0 | |||
|---|---|---|---|
| Quadrant | BADHDUFLAG | Total packets | Discarded packets |
| A | 0 | 23615 | 0 |
| B | 0 | 19904 | 0 |
| C | 0 | 28379 | 0 |
| D | 0 | 62232 | 0 |
| Quadrant | Total seconds | Saturated seconds | Saturation percentage |
|---|---|---|---|
| A | 7607 | 507 | 6.664914% |
| B | 7607 | 295 | 3.878007% |
| C | 7608 | 1066 | 14.011567% |
| D | 7608 | 7409 | 97.384332% |
Noise dominated data is calculated using 1-second bins in cleaned event files. If a bin has >2000 counts, and if more than 50% of those come from <1% of pixels, then it is considered to be noise-dominated and hence unusable.
| Quadrant | # 1 sec bins | Bins with >0 counts | Bins with >2000 counts | High rate bins dominated by noise | Noise dominated (total time) | Noise dominated (detector-on time) | Marked lightcurve |
|---|---|---|---|---|---|---|---|
| A | 7607 | 7607 | 480 | 480 | 6.31% | 6.31% | 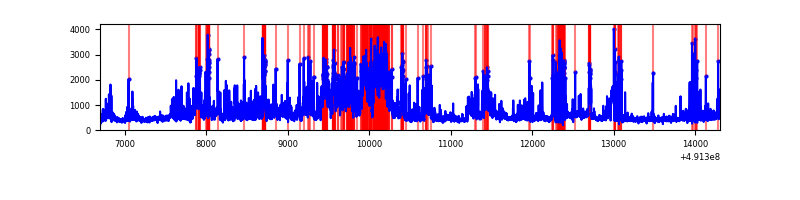 |
| B | 7607 | 7607 | 192 | 192 | 2.52% | 2.52% | 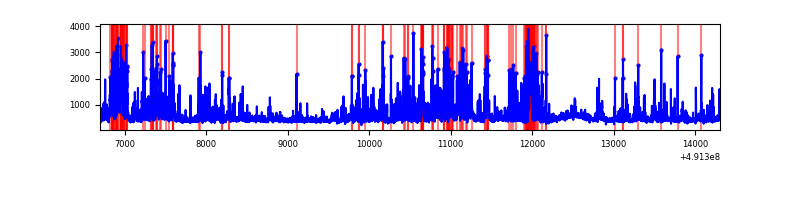 |
| C | 7608 | 7608 | 969 | 969 | 12.74% | 12.74% | 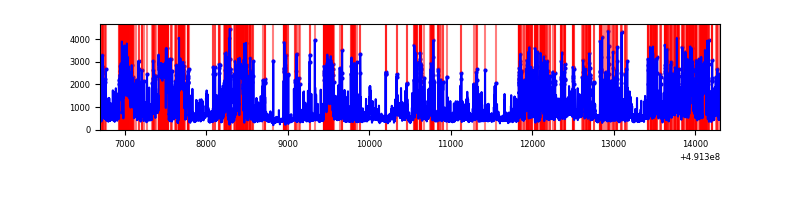 |
| D | 7608 | 7608 | 7002 | 7002 | 92.03% | 92.03% | 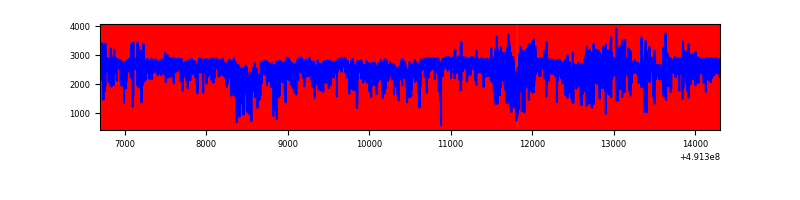 |
Top three noisy pixels from each quadrant. If the there are fewer than three noisy pixels in the level2.evt file, extra rows are filled as -1
| Pixel properties | Quadrant properties | ||||||
|---|---|---|---|---|---|---|---|
| Quadrant | DetID | PixID | Counts | Sigma | Mean | Median | Sigma |
| A | 12 | 3 | 1328039 | 7056.57 | 759 | 739 | 188.1 |
| A | 8 | 249 | 428231 | 2272.76 | 759 | 739 | 188.1 |
| A | 4 | 249 | 413353 | 2193.66 | 759 | 739 | 188.1 |
| B | 10 | 191 | 1088955 | 6804.24 | 759 | 734 | 159.9 |
| B | 2 | 249 | 254663 | 1587.72 | 759 | 734 | 159.9 |
| B | 1 | 239 | 158388 | 985.75 | 759 | 734 | 159.9 |
| C | 1 | 241 | 1396727 | 7148.29 | 705 | 695 | 195.3 |
| C | 15 | 224 | 1285125 | 6576.84 | 705 | 695 | 195.3 |
| C | 4 | 5 | 824044 | 4215.9 | 705 | 695 | 195.3 |
| D | 15 | 125 | 17962576 | 271826.22 | 228 | 218 | 66.1 |
| D | 2 | 153 | 46181 | 695.56 | 228 | 218 | 66.1 |
| D | 2 | 249 | 42220 | 635.62 | 228 | 218 | 66.1 |
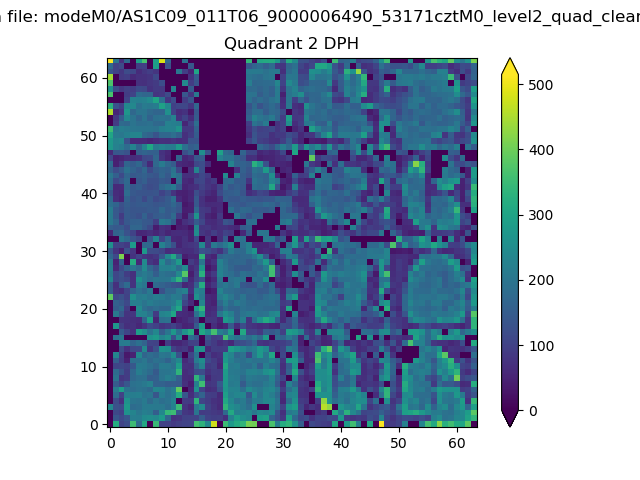
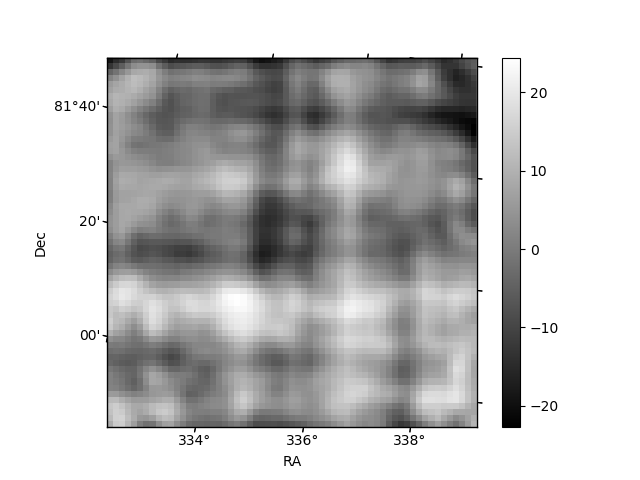
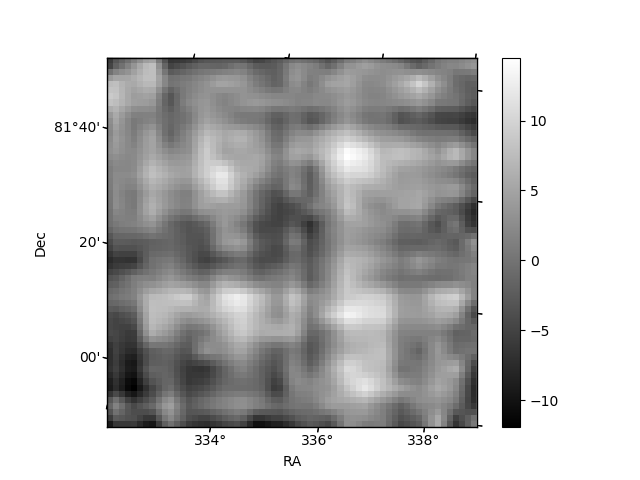
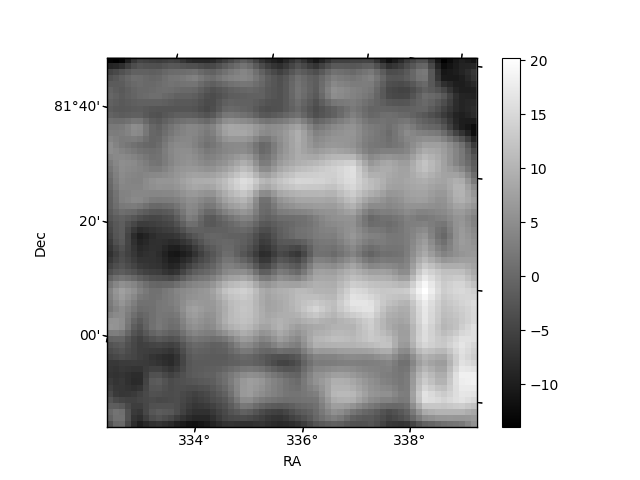
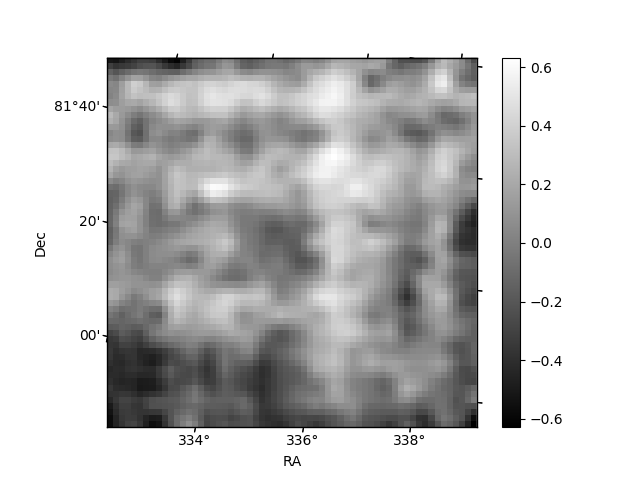
Histogram calculated using DETX and DETY for each event in the final _common_clean file
| Quadrant A | 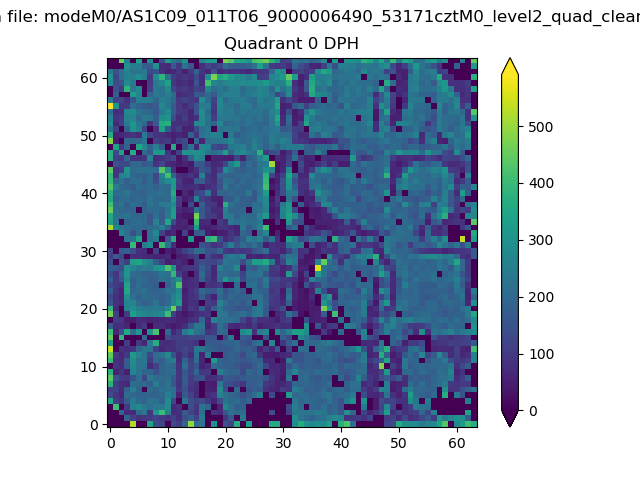 |
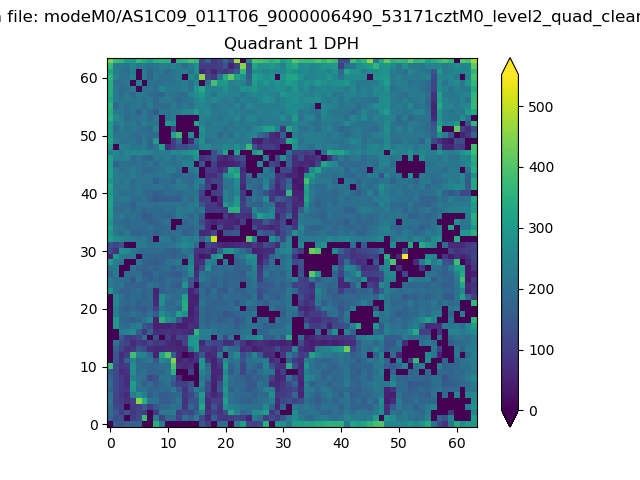 |
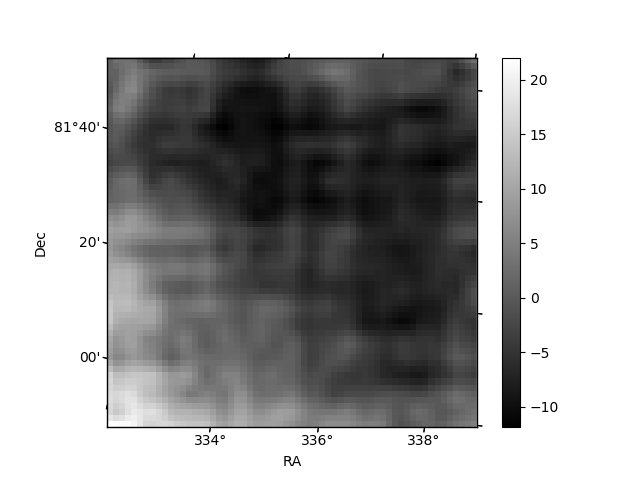
Quadrant B |
|---|---|---|---|
| Quadrant D | 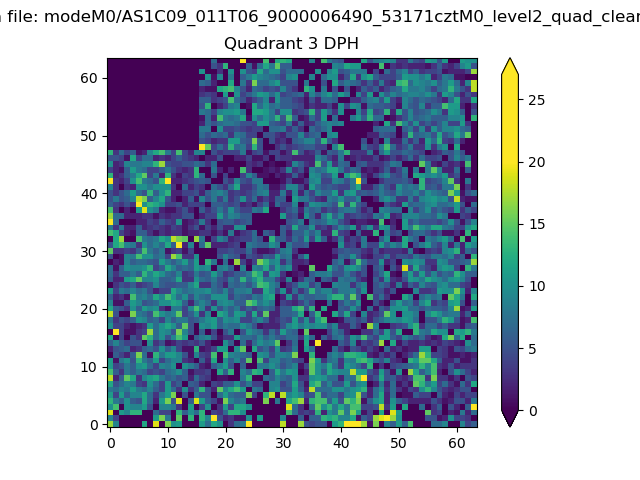 |
 |
Quadrant C |
| Plot type | Count rate plots | Images |
|---|---|---|
| Comparison with Poisson distribution Blue bars denote a histogram of data divided into 1 sec bins. Red curve is a Poisson curve with rate = median count rate of data. |
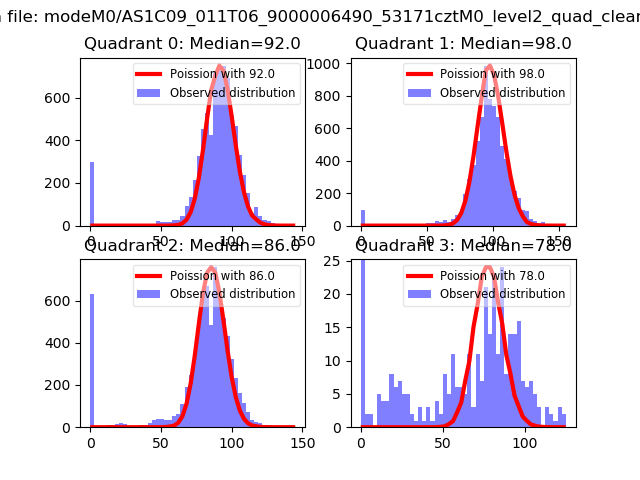 |
 |
| Quadrant-wise count rates Data is divided into 100 sec bins |
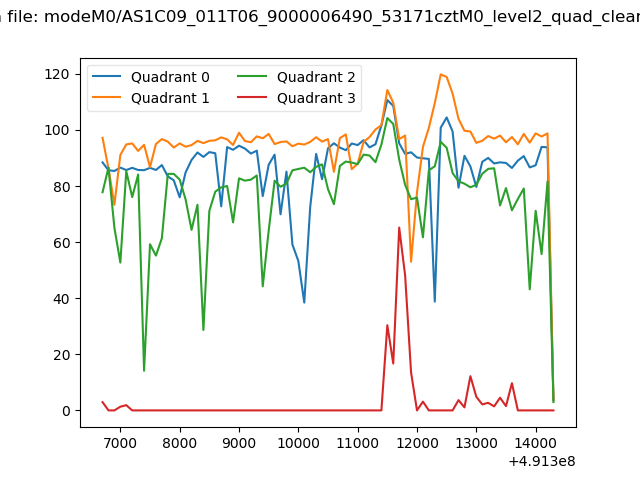 |
|
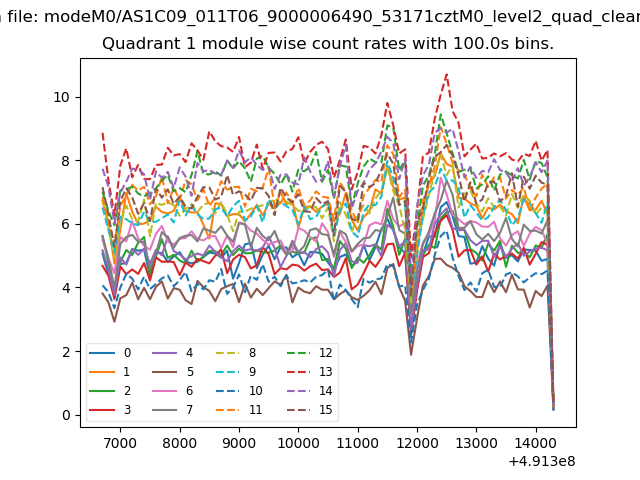
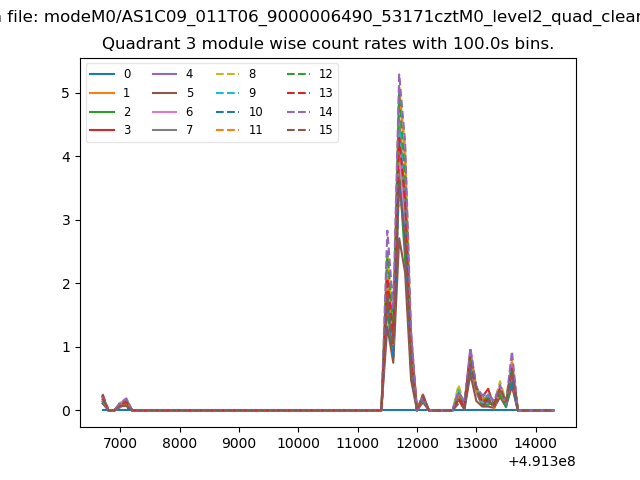
| Module-wise count rates for Quadrant A Data is divided into 100 sec bins |
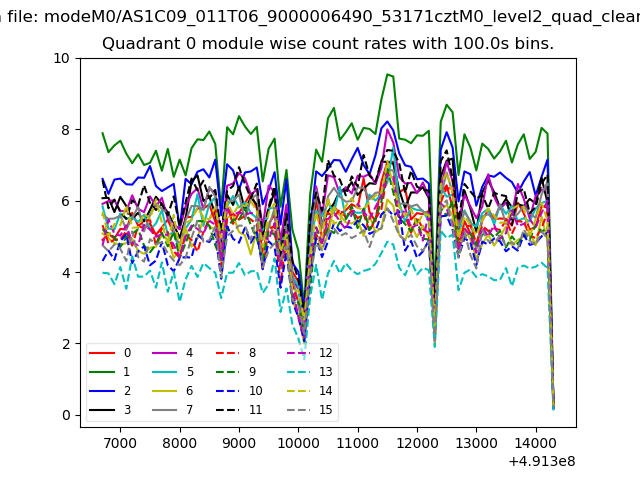 |
 |
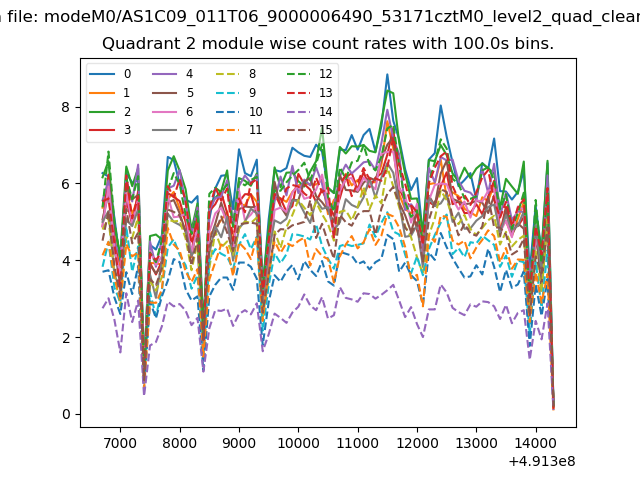
| Module-wise count rates for Quadrant B Data is divided into 100 sec bins |
 |
 |
| Module-wise count rates for Quadrant C Data is divided into 100 sec bins |
 |
 |
| Module-wise count rates for Quadrant D Data is divided into 100 sec bins |
 |
 |
| Parameter | Plot |
|---|---|
| CZT HV Monitor | 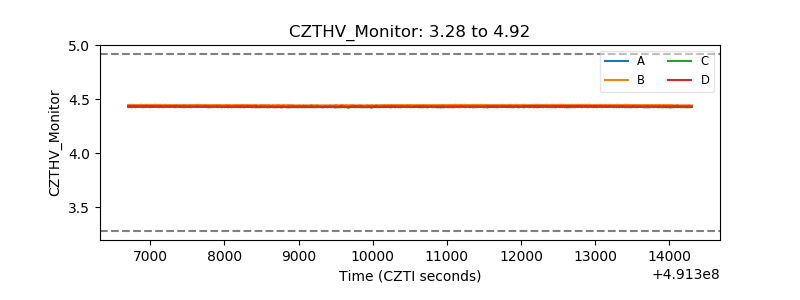 |
| D_VDD | 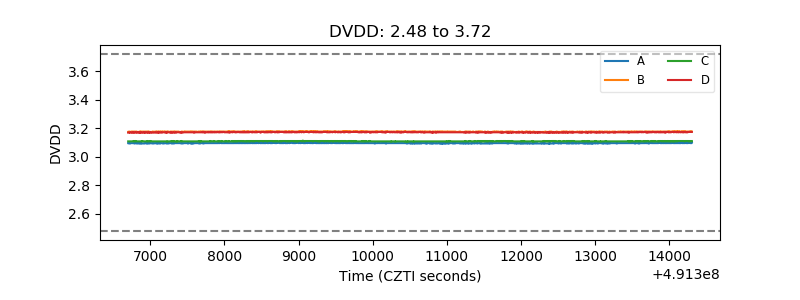 |
| Temperature 1 | 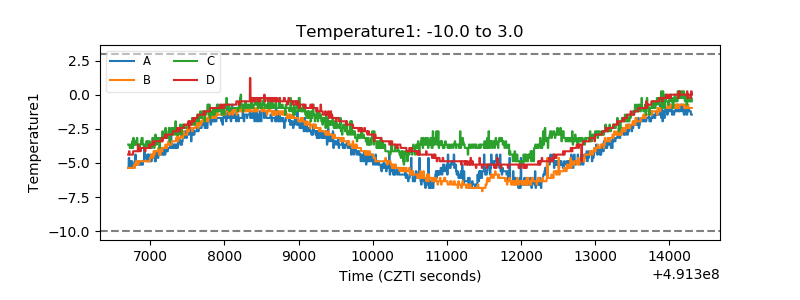 |
| Veto HV Monitor | 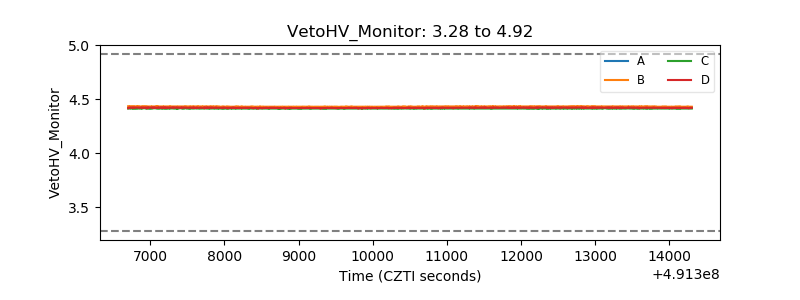 |
| Veto LLD | 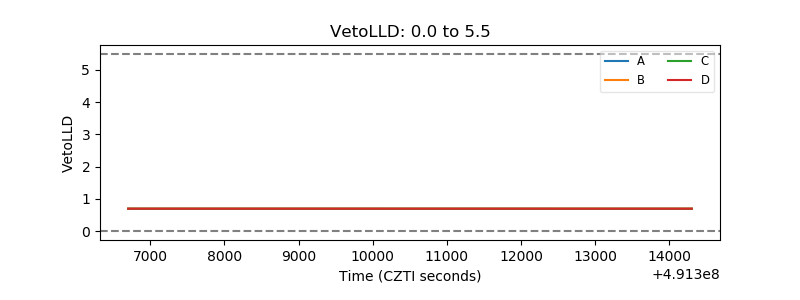 |
| Alpha Counter | 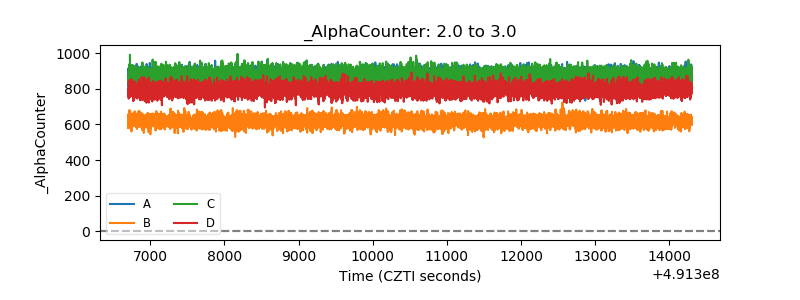 |
| _CPM_Rate | 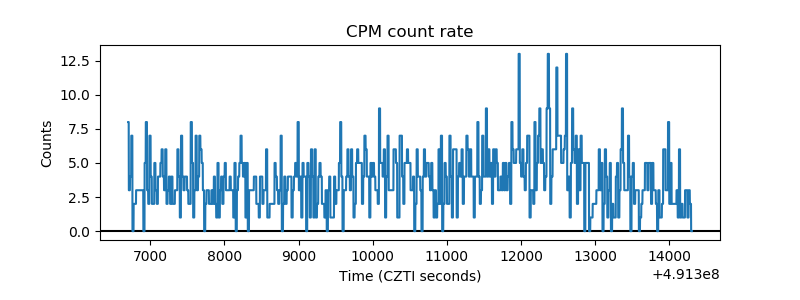 |
| CZT Counter | 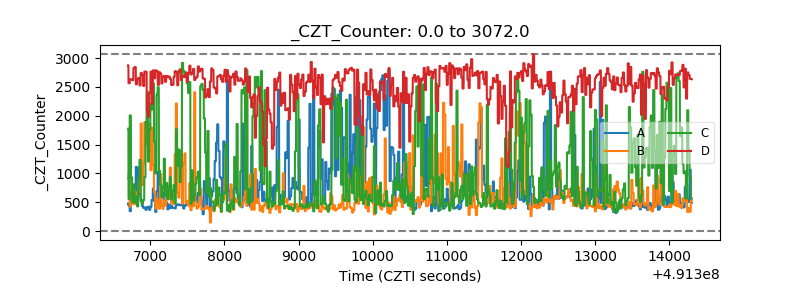 |
| +2.5 Volts monitor | 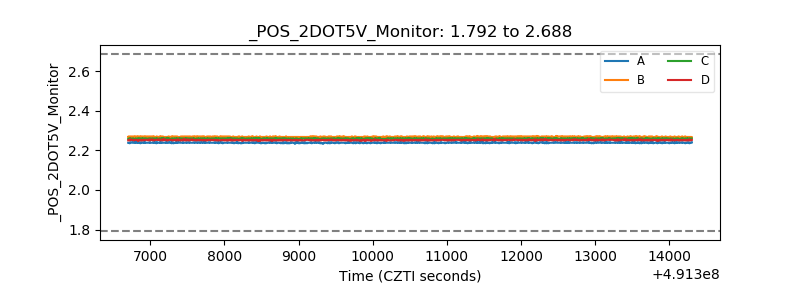 |
| +5 Volts monitor |  |
| _ROLL_ROT | 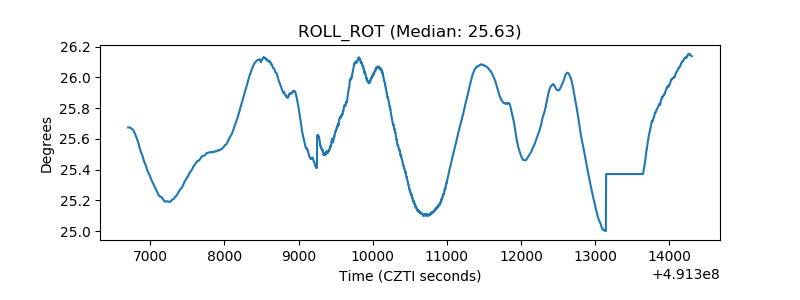 |
| _Roll_DEC | 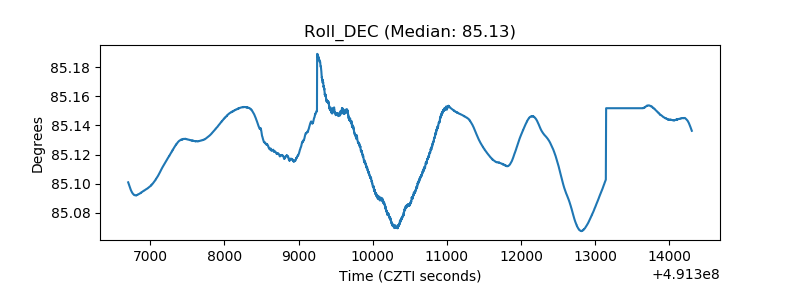 |
| _Roll_RA | 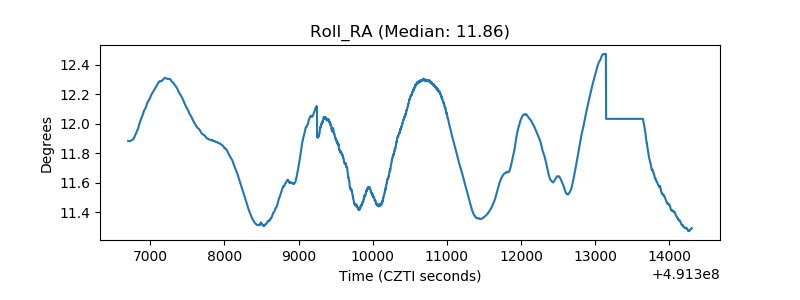 |
| Veto Counter | 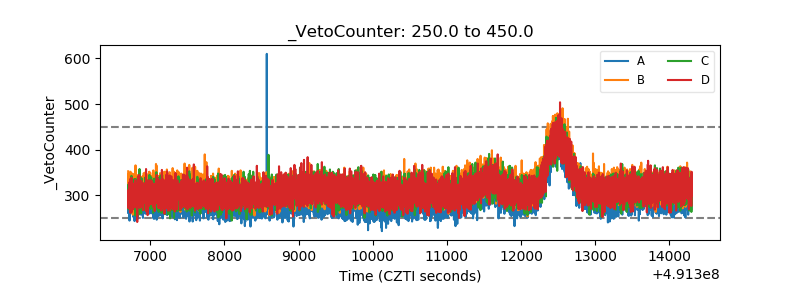 |