| Param | Original file | Final file |
|---|---|---|
| Filename | modeM0/AS1C09_011T06_9000006490_53174cztM0_level2.fits | modeM0/AS1C09_011T06_9000006490_53174cztM0_level2_quad_clean.evt |
| Size (bytes) | 2,556,783,360 | 192,620,160 |
| Size | 2.4 GB | 183.7 MB |
| Events in quadrant A | 12,134,110 | 1,615,750 |
| Events in quadrant B | 14,845,132 | 1,638,578 |
| Events in quadrant C | 19,441,833 | 1,302,469 |
| Events in quadrant D | 46,826,375 | 25,499 |
| Mode M9 | |||
|---|---|---|---|
| Quadrant | BADHDUFLAG | Total packets | Discarded packets |
| A | 0 | 13 | 0 |
| B | 0 | 13 | 0 |
| C | 0 | 13 | 0 |
| D | 0 | 13 | 0 |
| Mode SS | |||
|---|---|---|---|
| Quadrant | BADHDUFLAG | Total packets | Discarded packets |
| A | 0 | 368 | 0 |
| B | 0 | 368 | 0 |
| C | 0 | 368 | 0 |
| D | 0 | 368 | 0 |
| Mode M0 | |||
|---|---|---|---|
| Quadrant | BADHDUFLAG | Total packets | Discarded packets |
| A | 0 | 48552 | 3 |
| B | 0 | 56614 | 4 |
| C | 0 | 70306 | 3 |
| D | 0 | 151694 | 3 |
| Quadrant | Total seconds | Saturated seconds | Saturation percentage |
|---|---|---|---|
| A | 18111 | 958 | 5.289603% |
| B | 18110 | 1938 | 10.701270% |
| C | 18110 | 3044 | 16.808393% |
| D | 18110 | 17868 | 98.663722% |
Noise dominated data is calculated using 1-second bins in cleaned event files. If a bin has >2000 counts, and if more than 50% of those come from <1% of pixels, then it is considered to be noise-dominated and hence unusable.
| Quadrant | # 1 sec bins | Bins with >0 counts | Bins with >2000 counts | High rate bins dominated by noise | Noise dominated (total time) | Noise dominated (detector-on time) | Marked lightcurve |
|---|---|---|---|---|---|---|---|
| A | 19411 | 18114 | 658 | 658 | 3.39% | 3.63% | 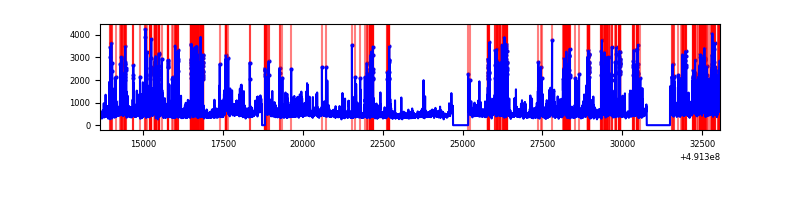 |
| B | 19410 | 18113 | 1175 | 1175 | 6.05% | 6.49% | 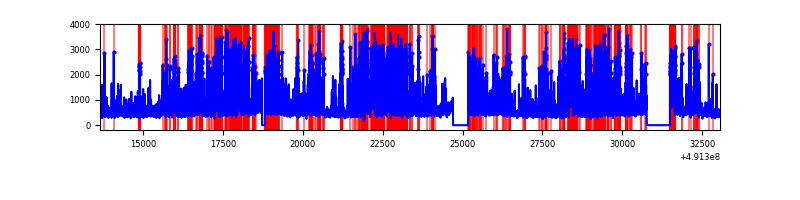 |
| C | 19410 | 18112 | 2458 | 2458 | 12.66% | 13.57% | 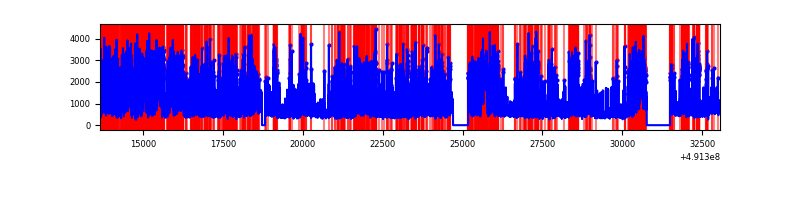 |
| D | 19409 | 18109 | 17212 | 17212 | 88.68% | 95.05% | 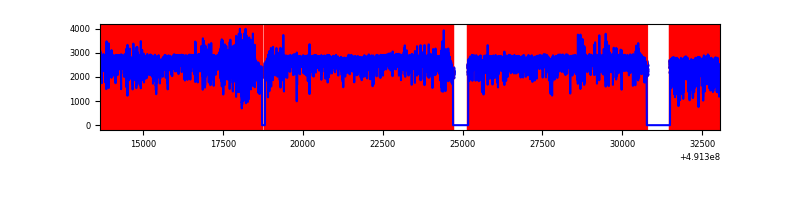 |
Top three noisy pixels from each quadrant. If the there are fewer than three noisy pixels in the level2.evt file, extra rows are filled as -1
| Pixel properties | Quadrant properties | ||||||
|---|---|---|---|---|---|---|---|
| Quadrant | DetID | PixID | Counts | Sigma | Mean | Median | Sigma |
| A | 12 | 3 | 1096857 | 2368.44 | 1862 | 1813 | 462.3 |
| A | 0 | 8 | 1050332 | 2267.81 | 1862 | 1813 | 462.3 |
| A | 15 | 174 | 540048 | 1164.13 | 1862 | 1813 | 462.3 |
| B | 10 | 191 | 4935790 | 13014.69 | 1800 | 1735 | 379.1 |
| B | 4 | 81 | 1104344 | 2908.38 | 1800 | 1735 | 379.1 |
| B | 2 | 249 | 408922 | 1074.05 | 1800 | 1735 | 379.1 |
| C | 15 | 224 | 4336801 | 9276.53 | 1700 | 1681 | 467.3 |
| C | 4 | 5 | 3252891 | 6957.12 | 1700 | 1681 | 467.3 |
| C | 15 | 158 | 916913 | 1958.46 | 1700 | 1681 | 467.3 |
| D | 15 | 125 | 41004641 | 256174.68 | 516 | 487 | 160.1 |
| D | 8 | 176 | 2096716 | 13096.25 | 516 | 487 | 160.1 |
| D | 10 | 172 | 534078 | 3333.63 | 516 | 487 | 160.1 |
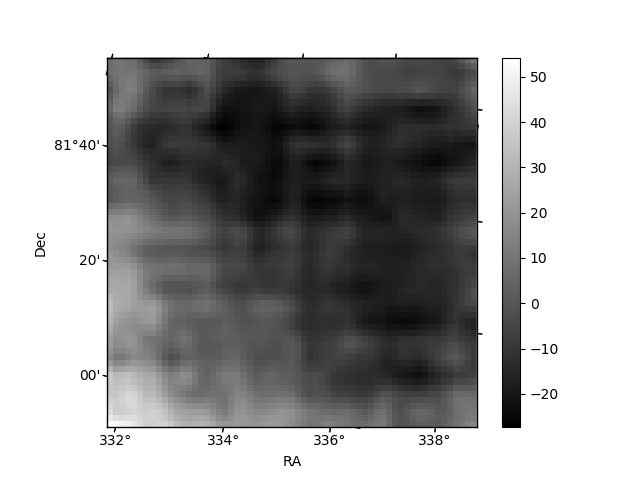
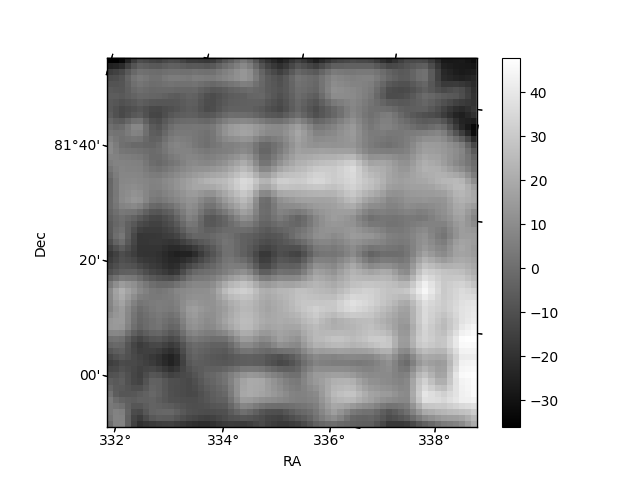
Histogram calculated using DETX and DETY for each event in the final _common_clean file
| Quadrant A | 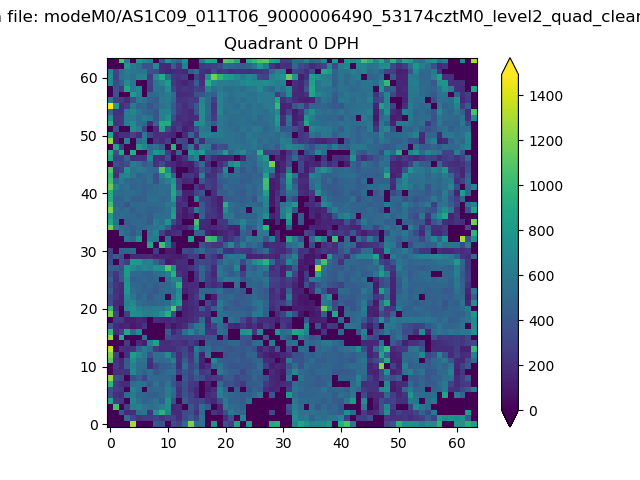 |
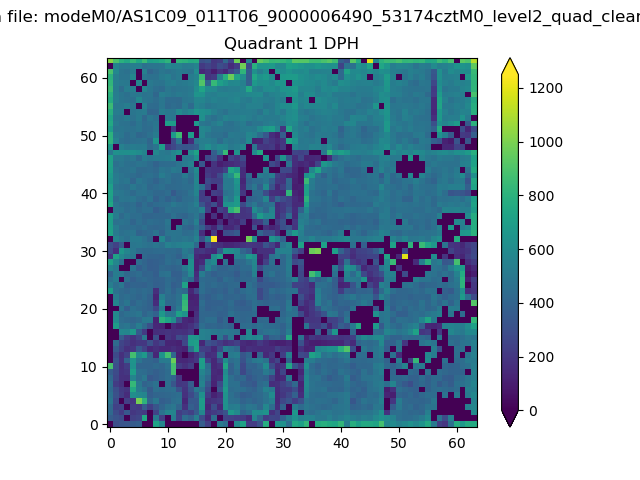 |
Quadrant B |
|---|---|---|---|
| Quadrant D | 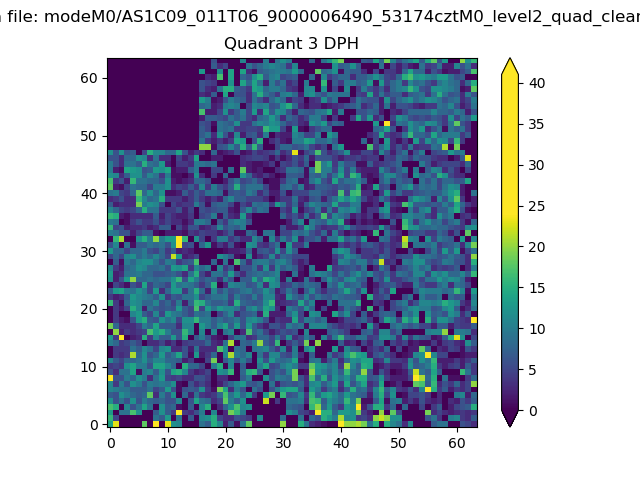 |
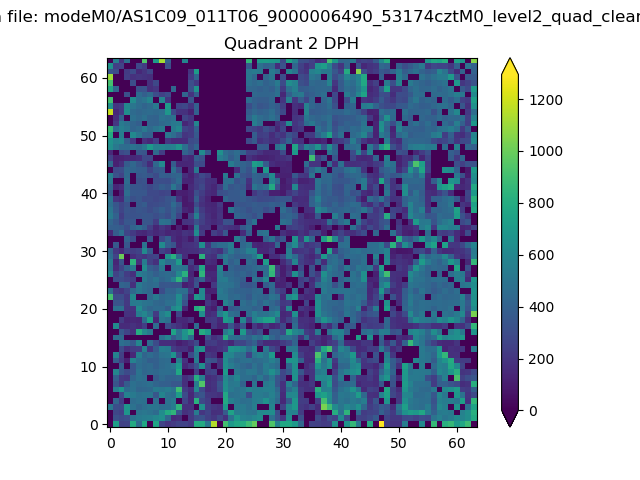 |
Quadrant C |
| Plot type | Count rate plots | Images |
|---|---|---|
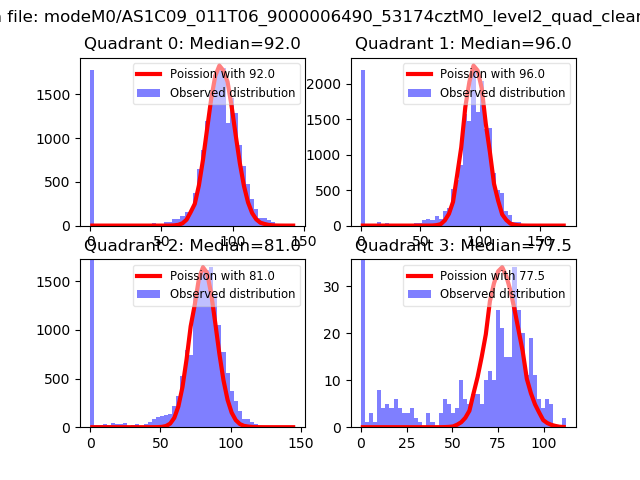
| Comparison with Poisson distribution Blue bars denote a histogram of data divided into 1 sec bins. Red curve is a Poisson curve with rate = median count rate of data. |
 |
 |
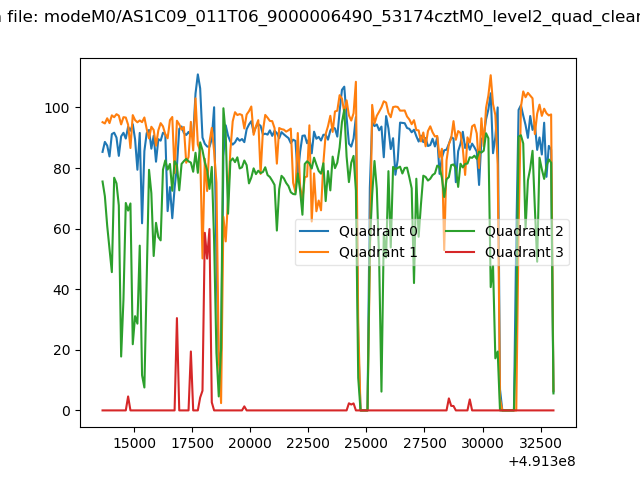
| Quadrant-wise count rates Data is divided into 100 sec bins |
 |
|
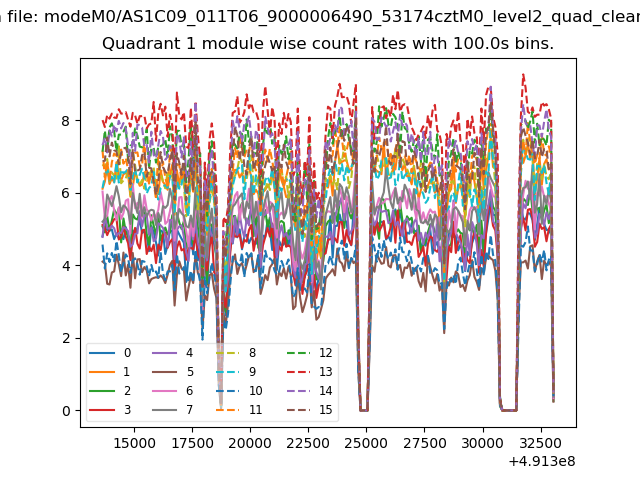
| Module-wise count rates for Quadrant A Data is divided into 100 sec bins |
 |
 |
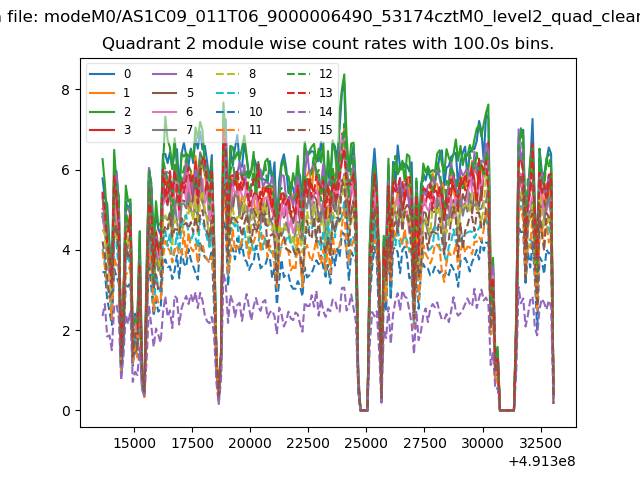
| Module-wise count rates for Quadrant B Data is divided into 100 sec bins |
 |
 |
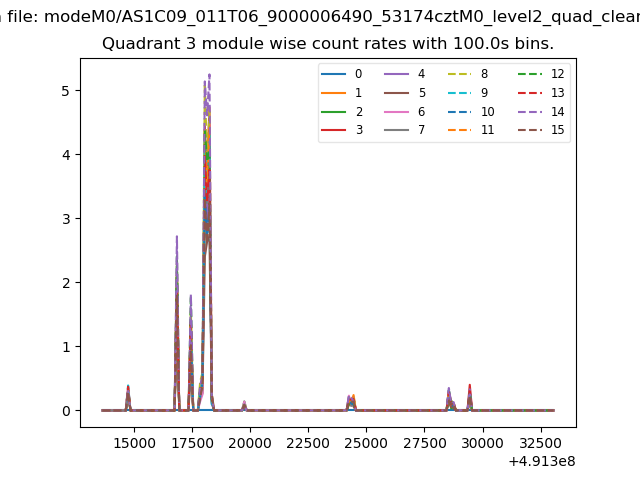
| Module-wise count rates for Quadrant C Data is divided into 100 sec bins |
 |
 |
| Module-wise count rates for Quadrant D Data is divided into 100 sec bins |
 |
 |
| Parameter | Plot |
|---|---|
| CZT HV Monitor | 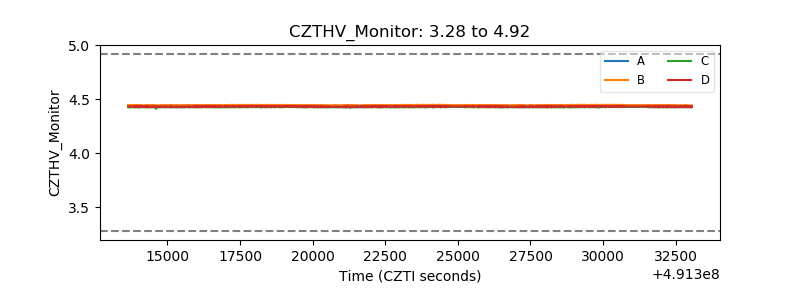 |
| D_VDD | 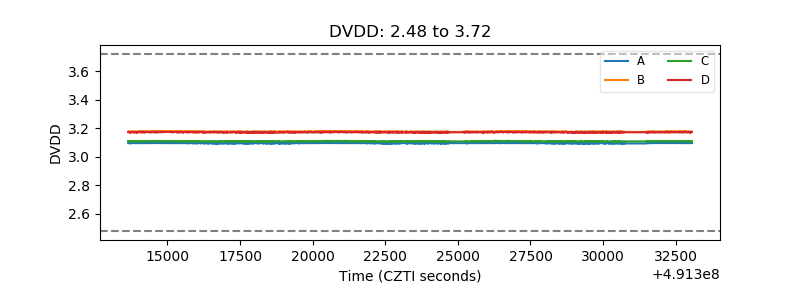 |
| Temperature 1 | 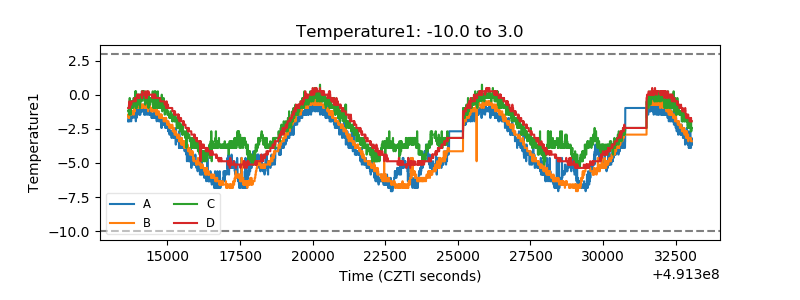 |
| Veto HV Monitor | 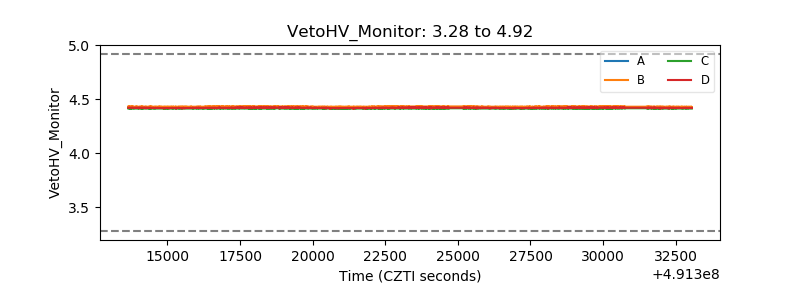 |
| Veto LLD |  |
| Alpha Counter | 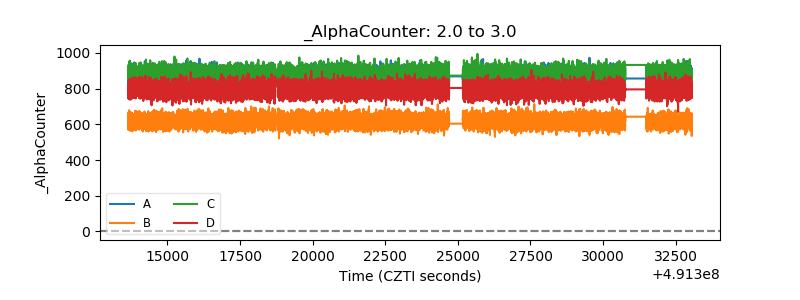 |
| _CPM_Rate | 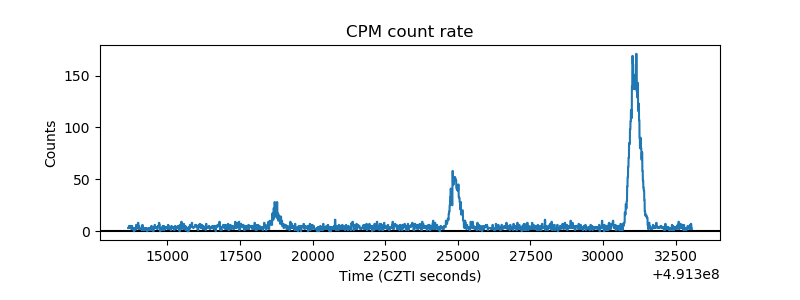 |
| CZT Counter | 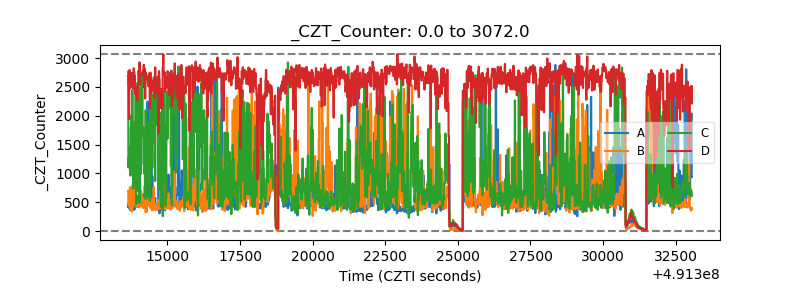 |
| +2.5 Volts monitor | 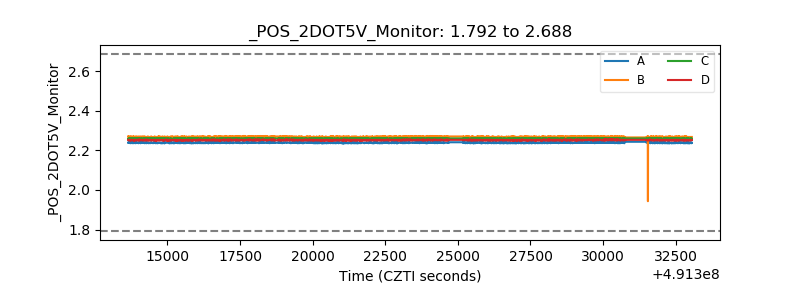 |
| +5 Volts monitor |  |
| _ROLL_ROT | 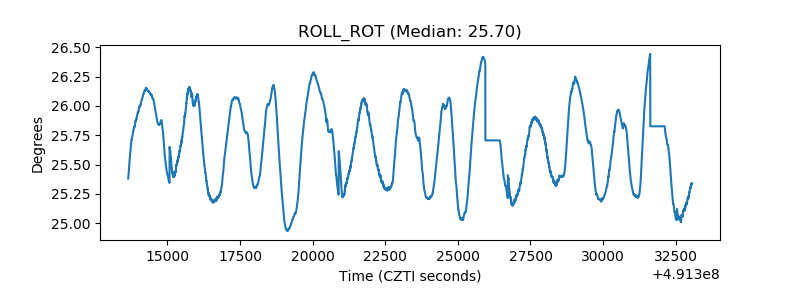 |
| _Roll_DEC | 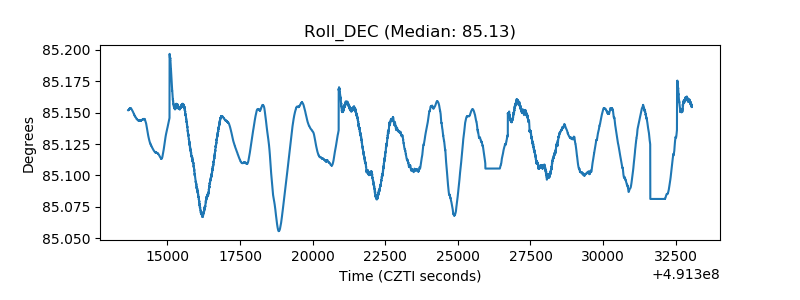 |
| _Roll_RA | 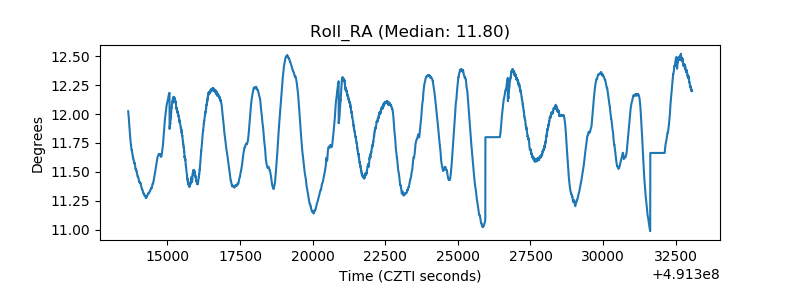 |
| Veto Counter | 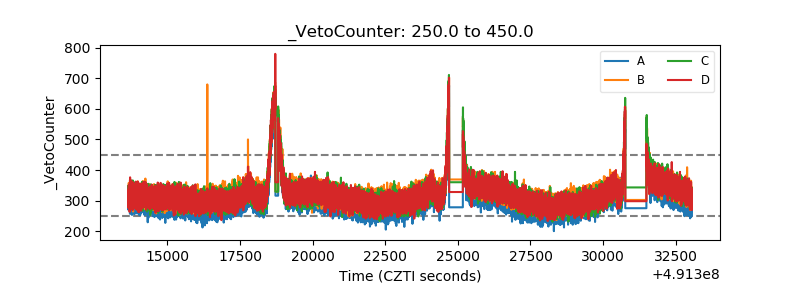 |