| Param | Original file | Final file |
|---|---|---|
| Filename | modeM0/AS1C09_011T06_9000006490_53175cztM0_level2.fits | modeM0/AS1C09_011T06_9000006490_53175cztM0_level2_quad_clean.evt |
| Size (bytes) | 820,108,800 | 70,188,480 |
| Size | 782.1 MB | 66.9 MB |
| Events in quadrant A | 4,361,495 | 576,594 |
| Events in quadrant B | 5,084,624 | 578,721 |
| Events in quadrant C | 4,997,457 | 536,655 |
| Events in quadrant D | 15,434,879 | 1,963 |
| Mode M9 | |||
|---|---|---|---|
| Quadrant | BADHDUFLAG | Total packets | Discarded packets |
| A | 0 | 9 | 0 |
| B | 0 | 9 | 0 |
| C | 0 | 9 | 0 |
| D | 0 | 9 | 0 |
| Mode SS | |||
|---|---|---|---|
| Quadrant | BADHDUFLAG | Total packets | Discarded packets |
| A | 0 | 126 | 0 |
| B | 0 | 126 | 0 |
| C | 0 | 126 | 0 |
| D | 0 | 124 | 0 |
| Mode M0 | |||
|---|---|---|---|
| Quadrant | BADHDUFLAG | Total packets | Discarded packets |
| A | 0 | 17410 | 1 |
| B | 0 | 19441 | 1 |
| C | 0 | 19234 | 1 |
| D | 0 | 50117 | 7 |
| Quadrant | Total seconds | Saturated seconds | Saturation percentage |
|---|---|---|---|
| A | 6174 | 313 | 5.069647% |
| B | 6175 | 633 | 10.251012% |
| C | 6175 | 341 | 5.522267% |
| D | 6174 | 6159 | 99.757046% |
Noise dominated data is calculated using 1-second bins in cleaned event files. If a bin has >2000 counts, and if more than 50% of those come from <1% of pixels, then it is considered to be noise-dominated and hence unusable.
| Quadrant | # 1 sec bins | Bins with >0 counts | Bins with >2000 counts | High rate bins dominated by noise | Noise dominated (total time) | Noise dominated (detector-on time) | Marked lightcurve |
|---|---|---|---|---|---|---|---|
| A | 7084 | 6175 | 272 | 272 | 3.84% | 4.40% | 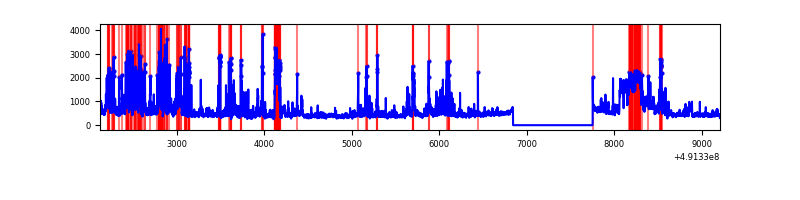 |
| B | 7085 | 6176 | 488 | 488 | 6.89% | 7.90% | 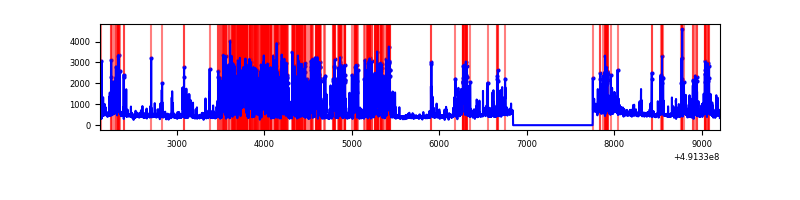 |
| C | 7085 | 6176 | 278 | 278 | 3.92% | 4.50% | 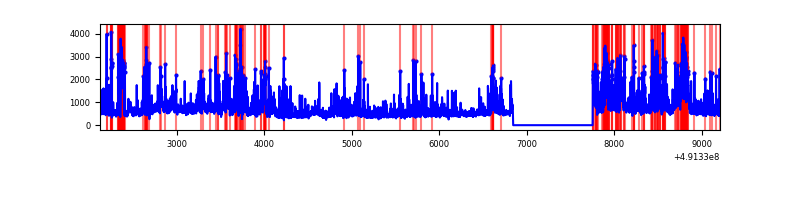 |
| D | 7083 | 6173 | 5625 | 5625 | 79.42% | 91.12% | 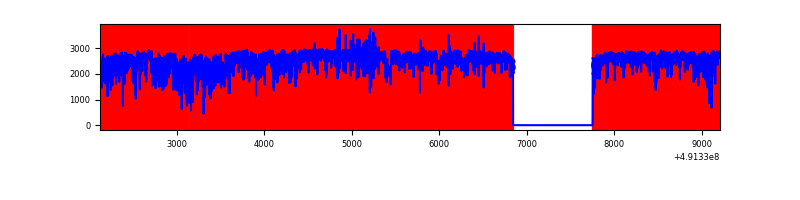 |
Top three noisy pixels from each quadrant. If the there are fewer than three noisy pixels in the level2.evt file, extra rows are filled as -1
| Pixel properties | Quadrant properties | ||||||
|---|---|---|---|---|---|---|---|
| Quadrant | DetID | PixID | Counts | Sigma | Mean | Median | Sigma |
| A | 12 | 80 | 486197 | 3091.34 | 627 | 613 | 157.1 |
| A | 0 | 8 | 325673 | 2069.41 | 627 | 613 | 157.1 |
| A | 15 | 174 | 294900 | 1873.5 | 627 | 613 | 157.1 |
| B | 10 | 191 | 2039325 | 15862.48 | 611 | 593 | 128.5 |
| B | 4 | 81 | 146565 | 1135.74 | 611 | 593 | 128.5 |
| B | 4 | 171 | 83165 | 642.46 | 611 | 593 | 128.5 |
| C | 15 | 224 | 912756 | 5398.47 | 610 | 603 | 169.0 |
| C | 0 | 240 | 570567 | 3373.26 | 610 | 603 | 169.0 |
| C | 7 | 80 | 283288 | 1673.04 | 610 | 603 | 169.0 |
| D | 15 | 125 | 12237231 | 325049.42 | 122 | 115 | 37.6 |
| D | 8 | 176 | 2315253 | 61496.05 | 122 | 115 | 37.6 |
| D | 13 | 170 | 142486 | 3781.74 | 122 | 115 | 37.6 |
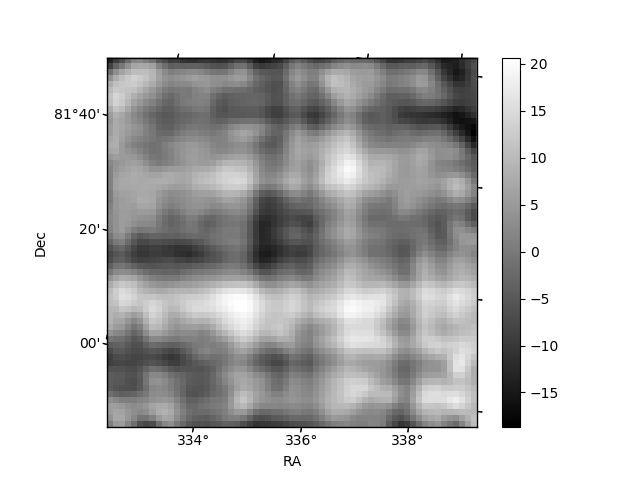
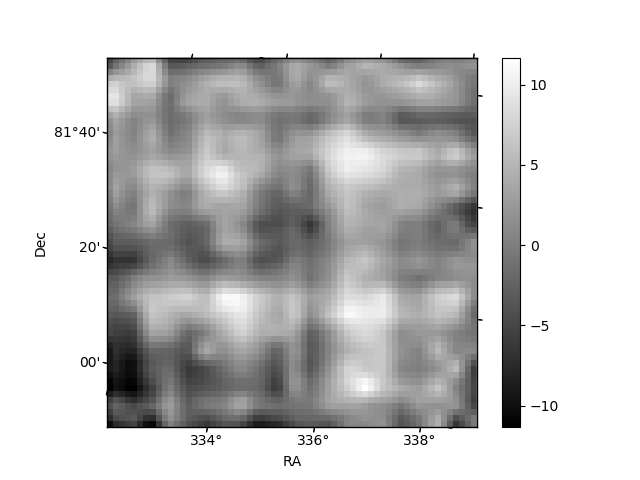
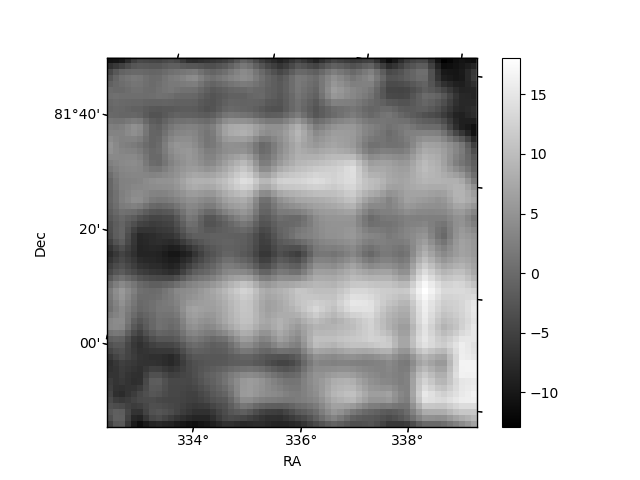
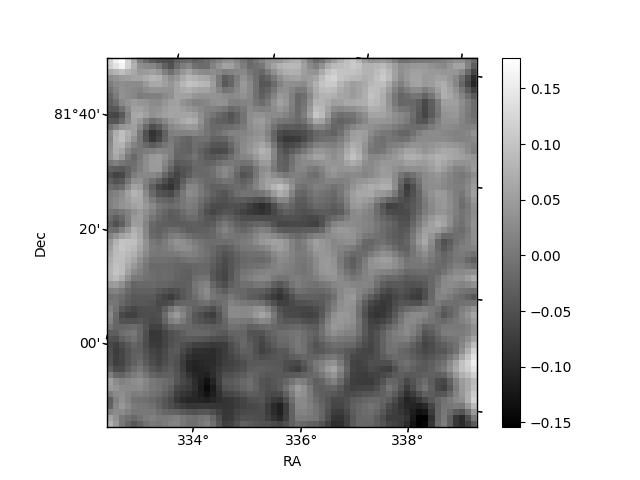
Histogram calculated using DETX and DETY for each event in the final _common_clean file
| Quadrant A | 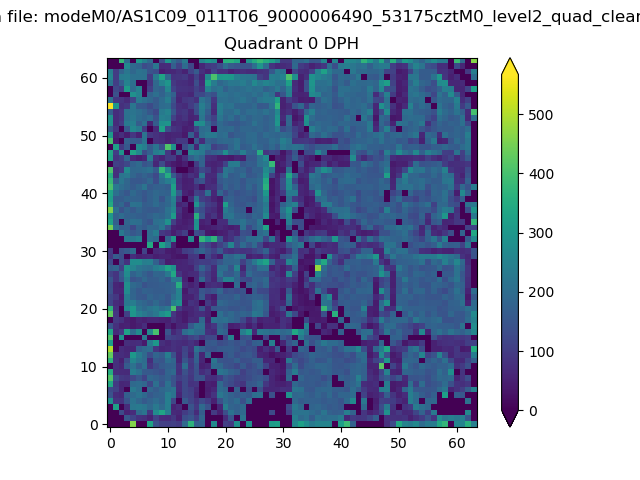 |
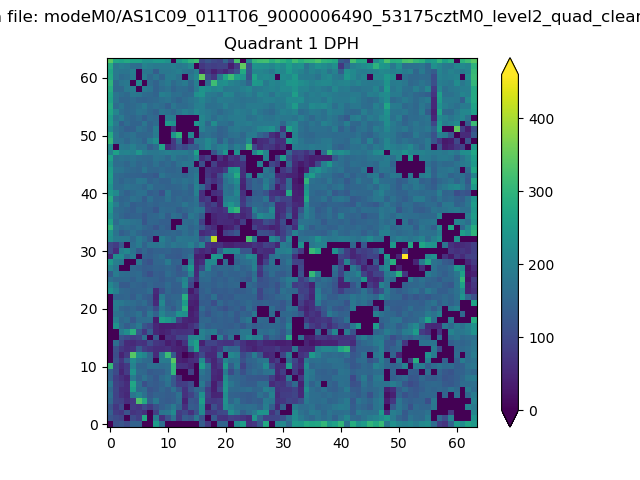 |
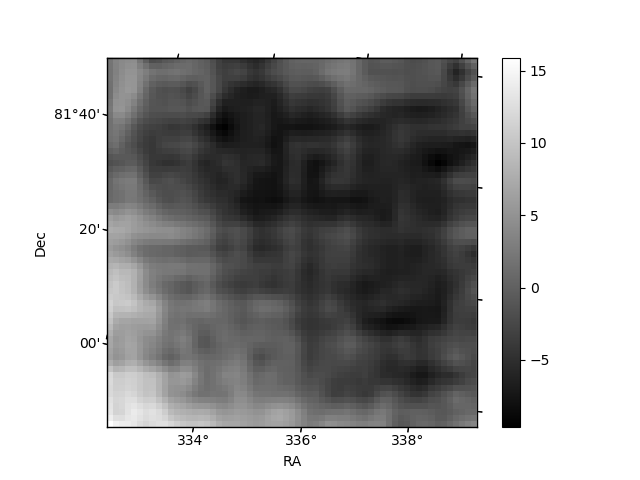
Quadrant B |
|---|---|---|---|
| Quadrant D | 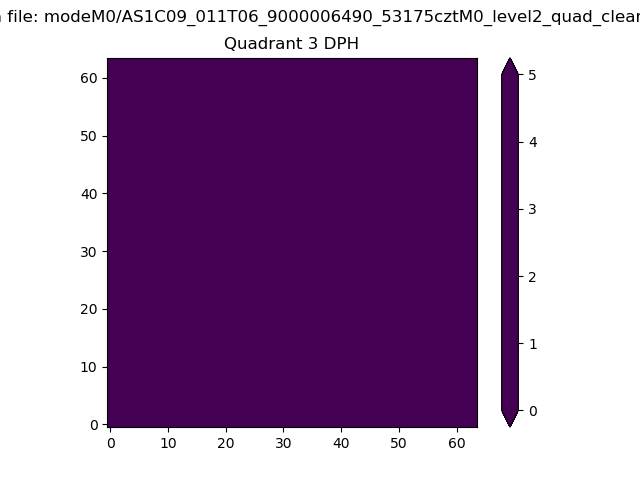 |
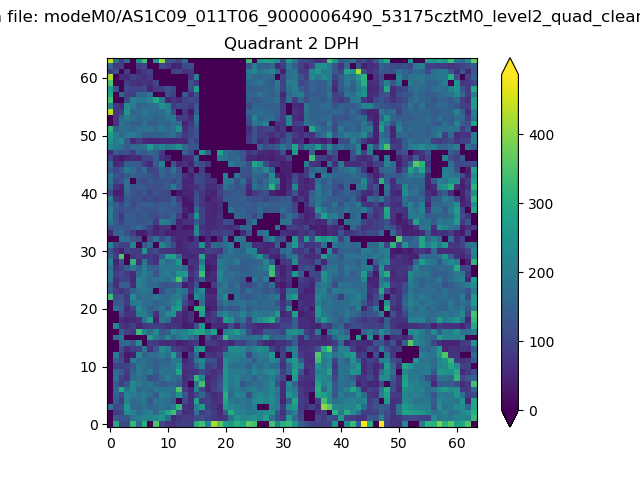 |
Quadrant C |
| Plot type | Count rate plots | Images |
|---|---|---|
| Comparison with Poisson distribution Blue bars denote a histogram of data divided into 1 sec bins. Red curve is a Poisson curve with rate = median count rate of data. |
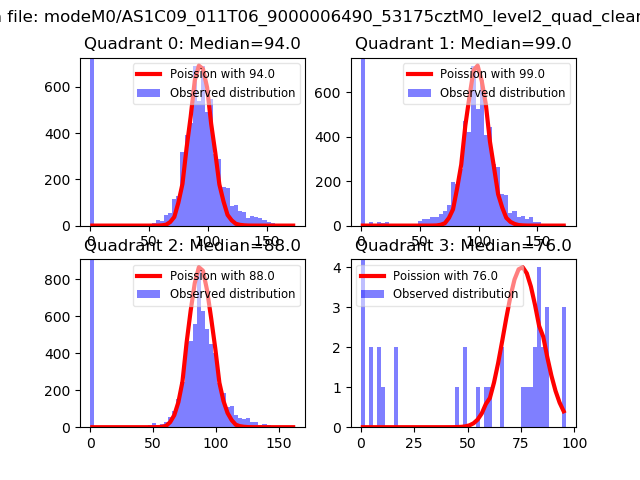 |
 |
| Quadrant-wise count rates Data is divided into 100 sec bins |
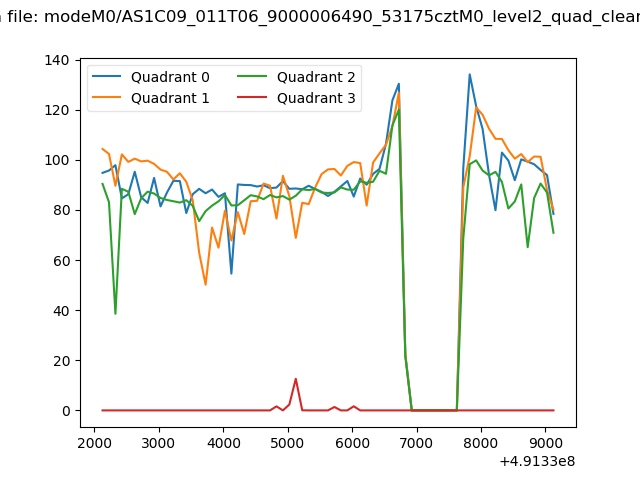 |
|
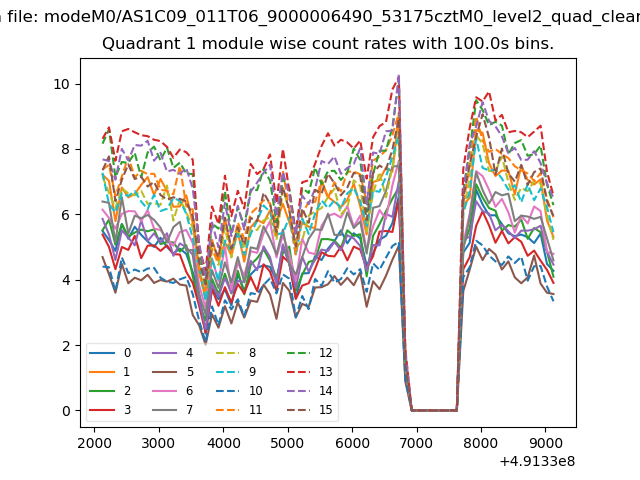
| Module-wise count rates for Quadrant A Data is divided into 100 sec bins |
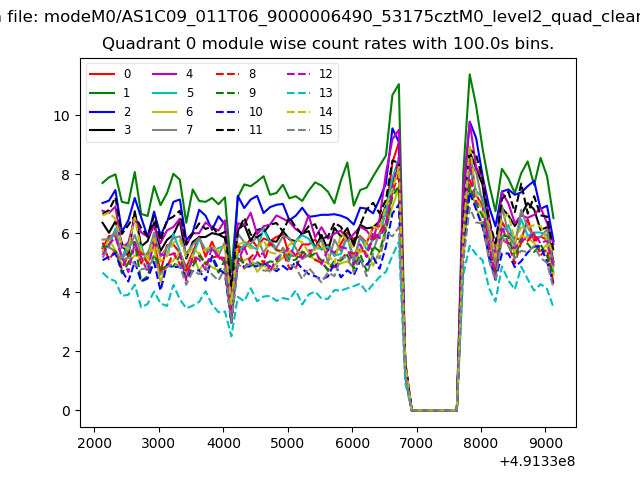 |
 |
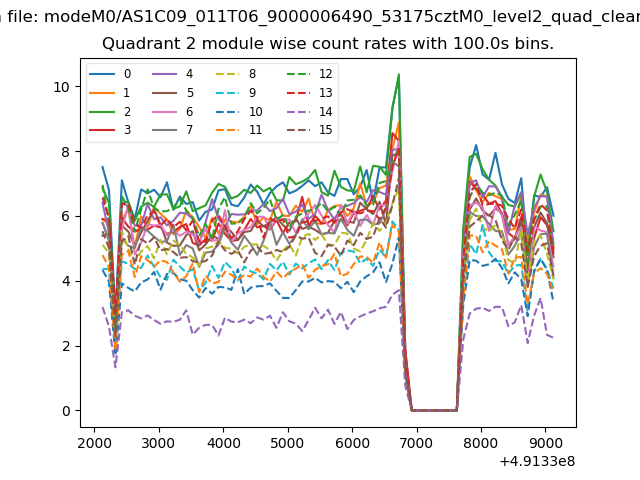
| Module-wise count rates for Quadrant B Data is divided into 100 sec bins |
 |
 |
| Module-wise count rates for Quadrant C Data is divided into 100 sec bins |
 |
 |
| Module-wise count rates for Quadrant D Data is divided into 100 sec bins |
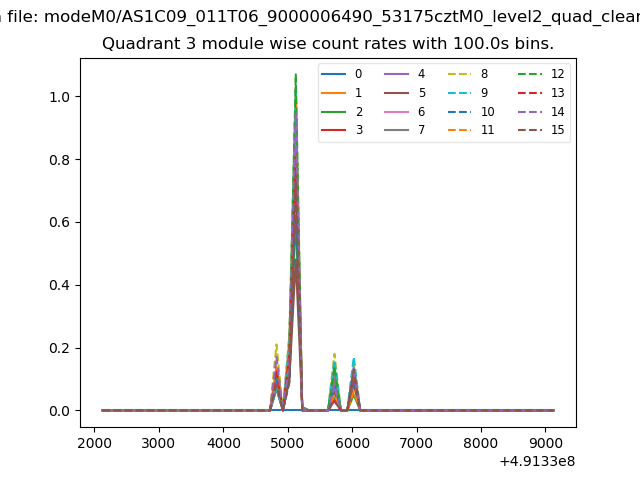 |
 |
| Parameter | Plot |
|---|---|
| CZT HV Monitor | 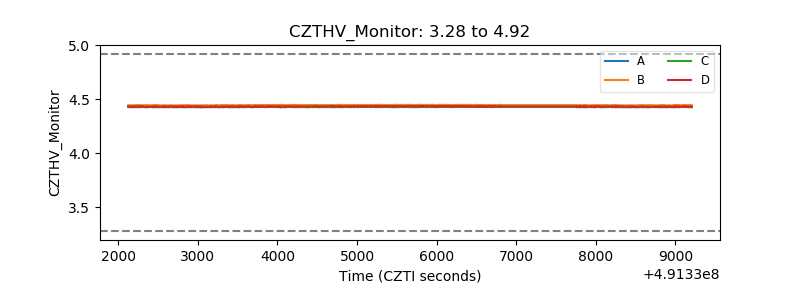 |
| D_VDD | 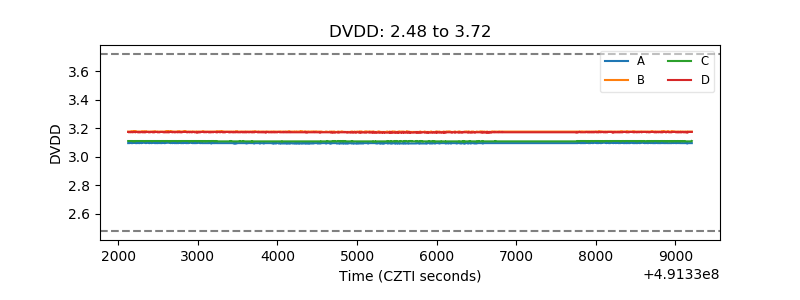 |
| Temperature 1 | 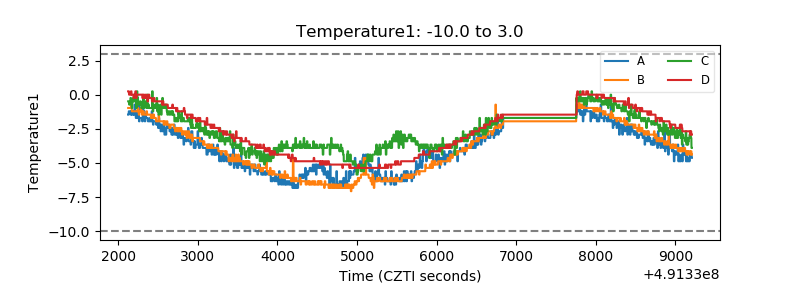 |
| Veto HV Monitor | 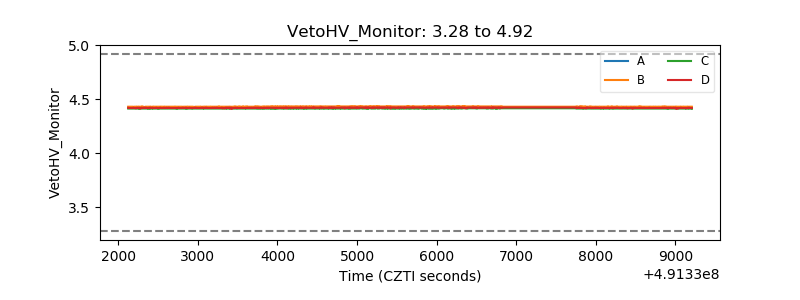 |
| Veto LLD | 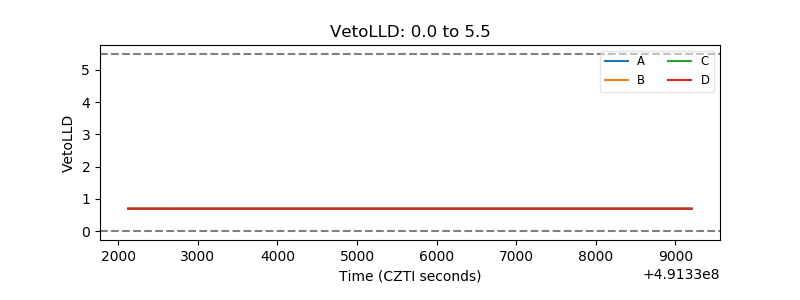 |
| Alpha Counter | 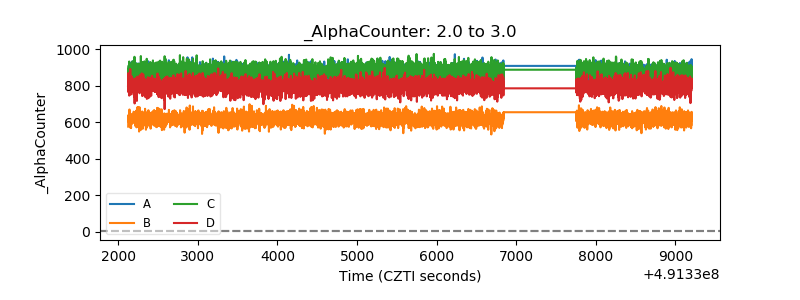 |
| _CPM_Rate | 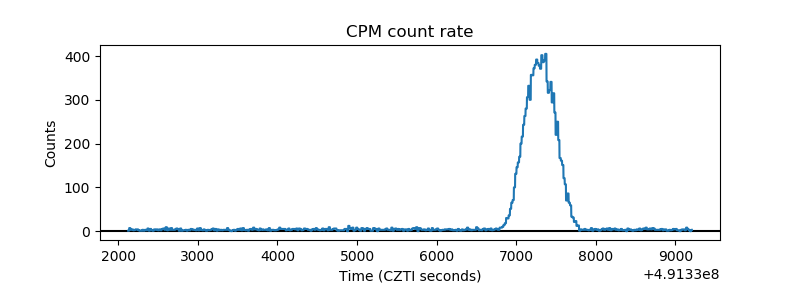 |
| CZT Counter | 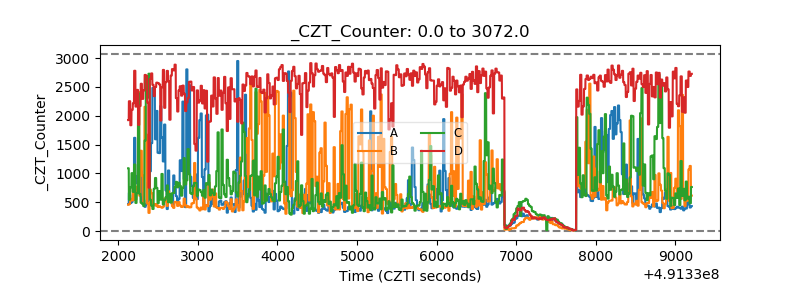 |
| +2.5 Volts monitor | 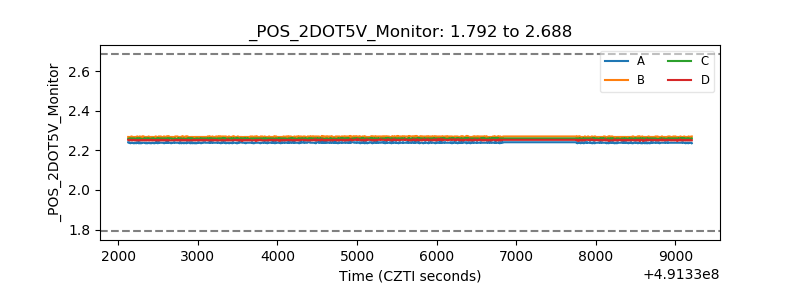 |
| +5 Volts monitor |  |
| _ROLL_ROT | 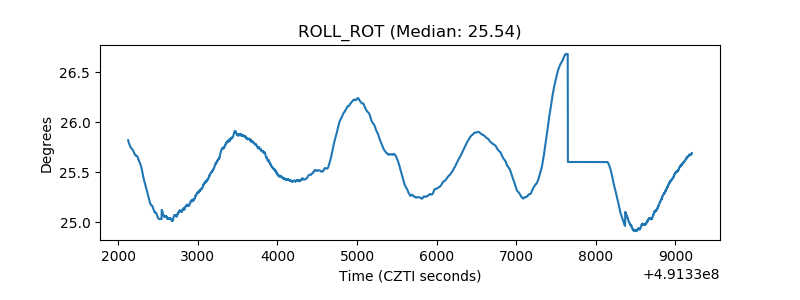 |
| _Roll_DEC | 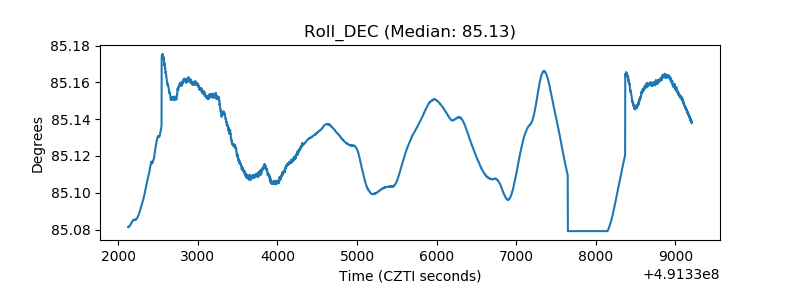 |
| _Roll_RA | 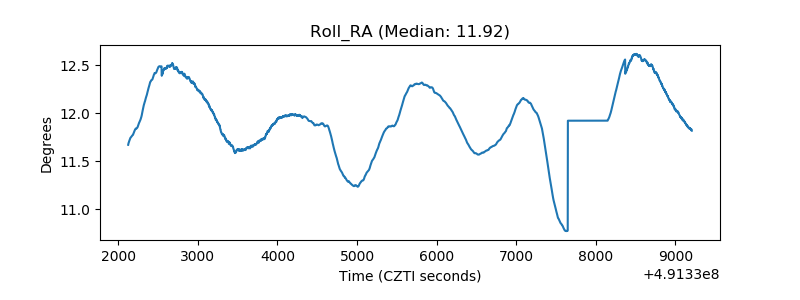 |
| Veto Counter | 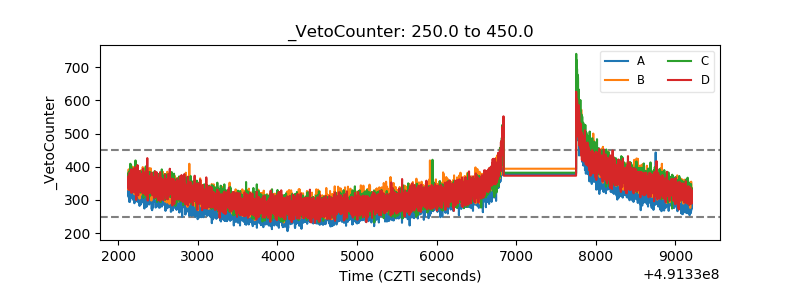 |