| Param | Original file | Final file |
|---|---|---|
| Filename | modeM0/AS1C09_011T06_9000006490_53178cztM0_level2.fits | modeM0/AS1C09_011T06_9000006490_53178cztM0_level2_quad_clean.evt |
| Size (bytes) | 842,901,120 | 75,214,080 |
| Size | 803.9 MB | 71.7 MB |
| Events in quadrant A | 4,196,257 | 594,839 |
| Events in quadrant B | 4,682,354 | 633,919 |
| Events in quadrant C | 5,615,069 | 576,151 |
| Events in quadrant D | 16,215,964 | 29,518 |
| Mode M9 | |||
|---|---|---|---|
| Quadrant | BADHDUFLAG | Total packets | Discarded packets |
| A | 0 | 11 | 0 |
| B | 0 | 12 | 0 |
| C | 0 | 12 | 0 |
| D | 0 | 12 | 0 |
| Mode SS | |||
|---|---|---|---|
| Quadrant | BADHDUFLAG | Total packets | Discarded packets |
| A | 0 | 130 | 0 |
| B | 0 | 130 | 0 |
| C | 0 | 130 | 0 |
| D | 0 | 130 | 0 |
| Mode M0 | |||
|---|---|---|---|
| Quadrant | BADHDUFLAG | Total packets | Discarded packets |
| A | 0 | 17073 | 2 |
| B | 0 | 18388 | 2 |
| C | 0 | 21143 | 2 |
| D | 0 | 52526 | 7 |
| Quadrant | Total seconds | Saturated seconds | Saturation percentage |
|---|---|---|---|
| A | 6343 | 424 | 6.684534% |
| B | 6343 | 491 | 7.740817% |
| C | 6343 | 441 | 6.952546% |
| D | 6342 | 6046 | 95.332703% |
Noise dominated data is calculated using 1-second bins in cleaned event files. If a bin has >2000 counts, and if more than 50% of those come from <1% of pixels, then it is considered to be noise-dominated and hence unusable.
| Quadrant | # 1 sec bins | Bins with >0 counts | Bins with >2000 counts | High rate bins dominated by noise | Noise dominated (total time) | Noise dominated (detector-on time) | Marked lightcurve |
|---|---|---|---|---|---|---|---|
| A | 7508 | 6343 | 358 | 358 | 4.77% | 5.64% | 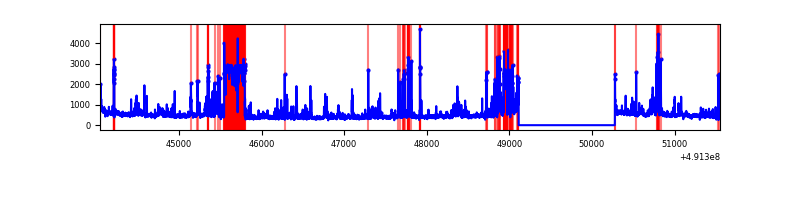 |
| B | 7508 | 6344 | 400 | 400 | 5.33% | 6.31% | 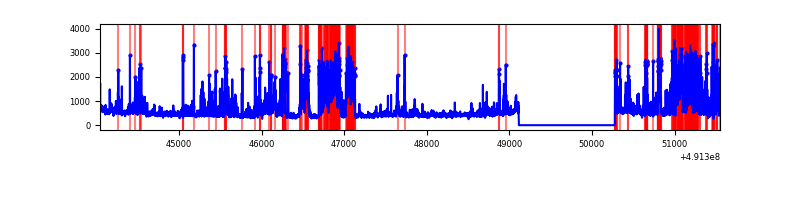 |
| C | 7508 | 6344 | 402 | 402 | 5.35% | 6.34% | 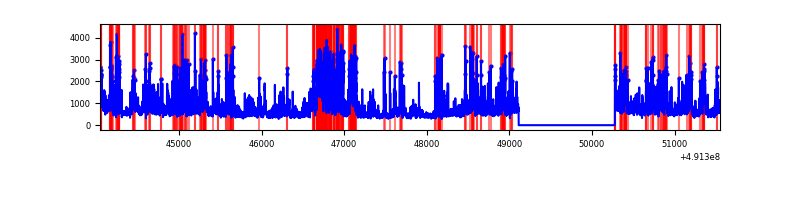 |
| D | 7506 | 6341 | 5867 | 5867 | 78.16% | 92.52% | 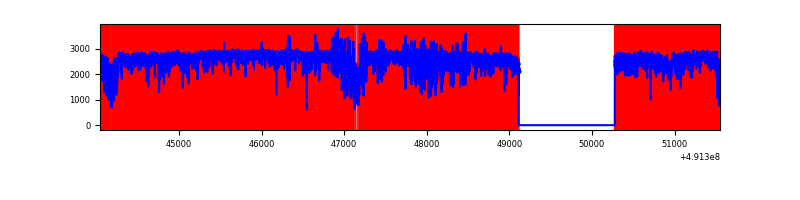 |
Top three noisy pixels from each quadrant. If the there are fewer than three noisy pixels in the level2.evt file, extra rows are filled as -1
| Pixel properties | Quadrant properties | ||||||
|---|---|---|---|---|---|---|---|
| Quadrant | DetID | PixID | Counts | Sigma | Mean | Median | Sigma |
| A | 4 | 249 | 759887 | 4698.02 | 637 | 621 | 161.6 |
| A | 7 | 206 | 314214 | 1940.38 | 637 | 621 | 161.6 |
| A | 15 | 174 | 187247 | 1154.76 | 637 | 621 | 161.6 |
| B | 4 | 81 | 891748 | 6620.52 | 643 | 621 | 134.6 |
| B | 10 | 191 | 817931 | 6072.1 | 643 | 621 | 134.6 |
| B | 10 | 254 | 161773 | 1197.26 | 643 | 621 | 134.6 |
| C | 15 | 224 | 1221804 | 6919.22 | 636 | 630 | 176.5 |
| C | 0 | 240 | 833095 | 4716.78 | 636 | 630 | 176.5 |
| C | 14 | 95 | 231836 | 1310.02 | 636 | 630 | 176.5 |
| D | 15 | 125 | 15029418 | 253997.16 | 200 | 190 | 59.2 |
| D | 2 | 249 | 67145 | 1131.55 | 200 | 190 | 59.2 |
| D | 13 | 170 | 64017 | 1078.69 | 200 | 190 | 59.2 |
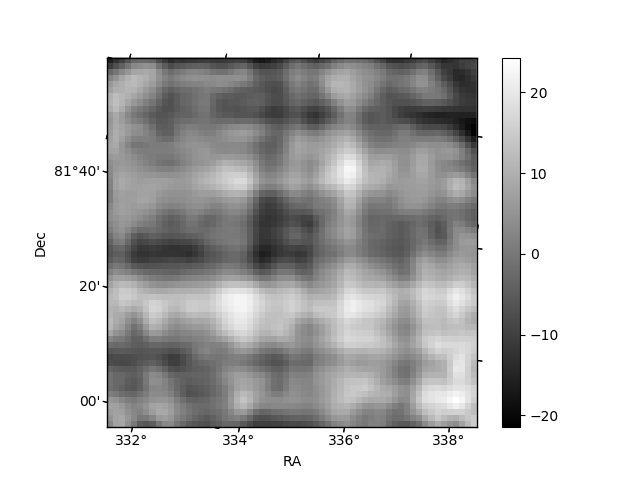
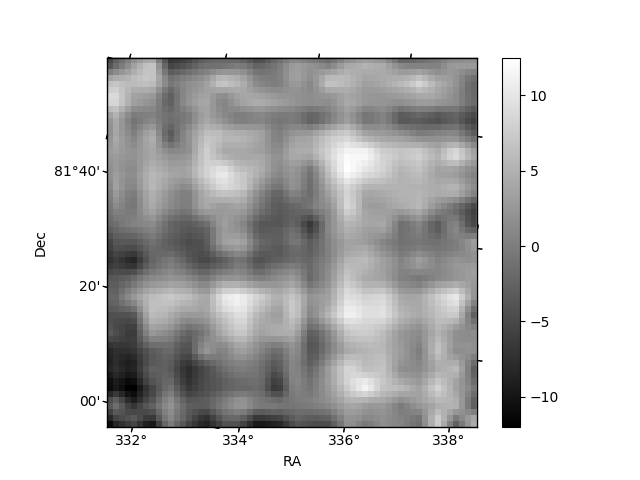
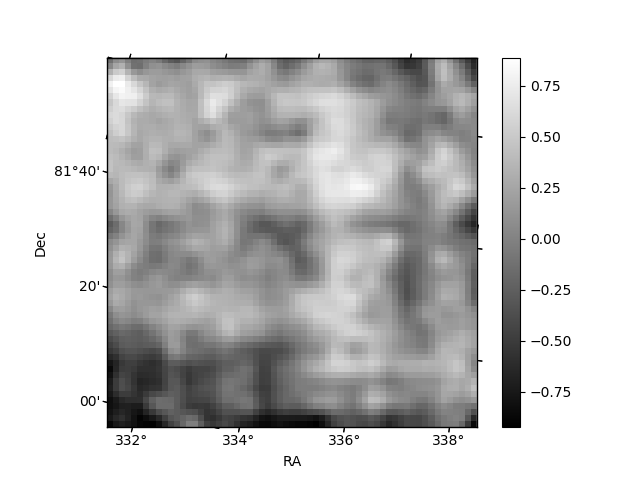
Histogram calculated using DETX and DETY for each event in the final _common_clean file
| Quadrant A | 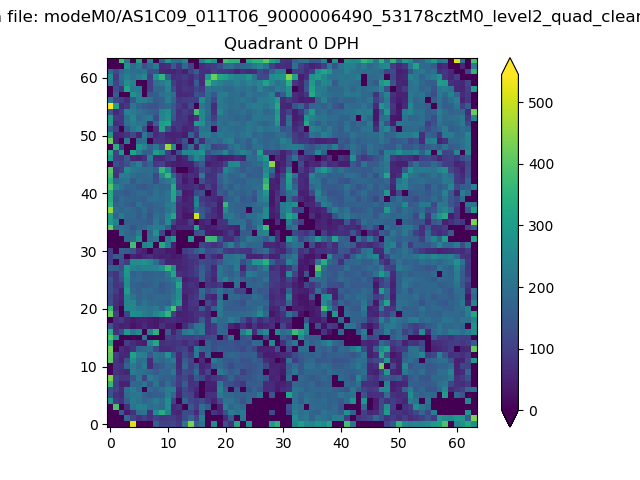 |
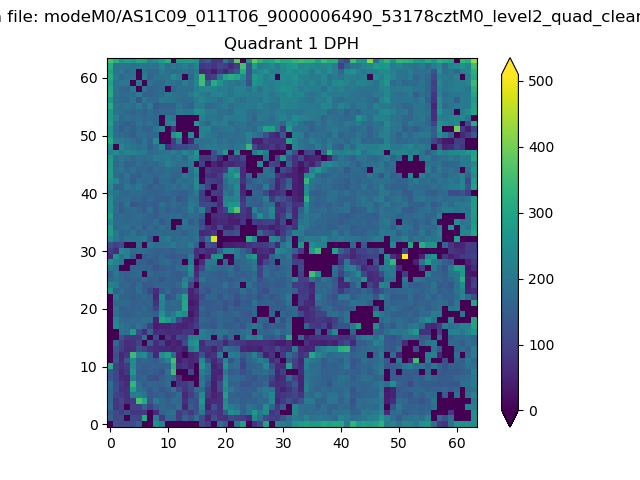 |
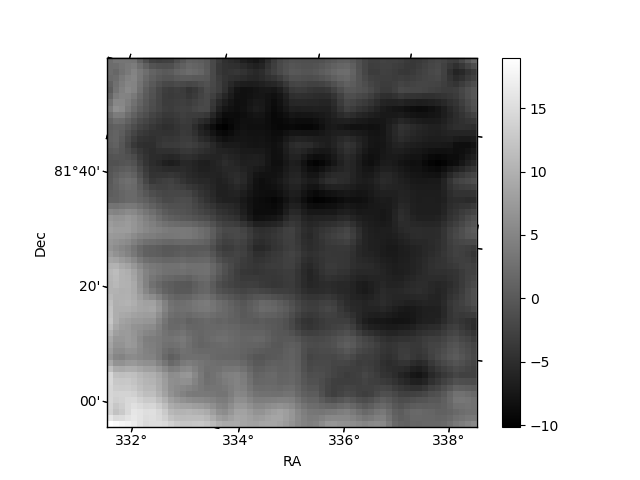
Quadrant B |
|---|---|---|---|
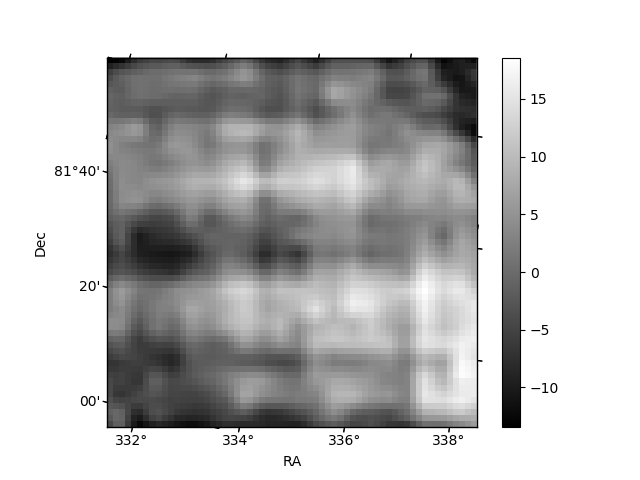
| Quadrant D | 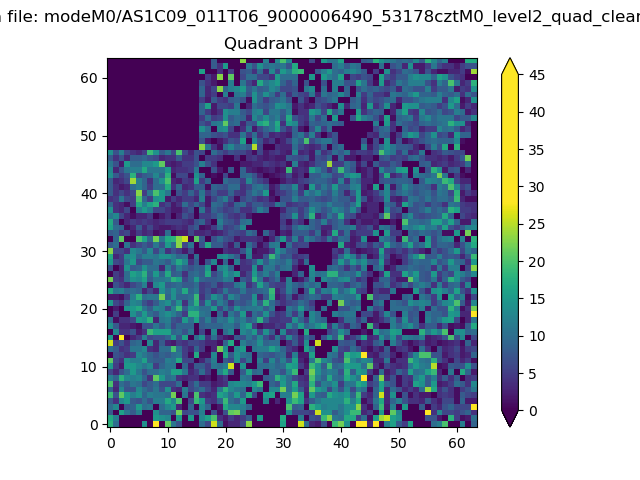 |
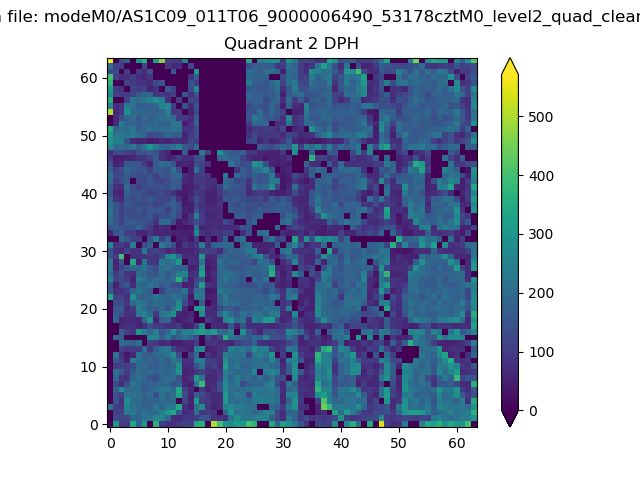 |
Quadrant C |
| Plot type | Count rate plots | Images |
|---|---|---|
| Comparison with Poisson distribution Blue bars denote a histogram of data divided into 1 sec bins. Red curve is a Poisson curve with rate = median count rate of data. |
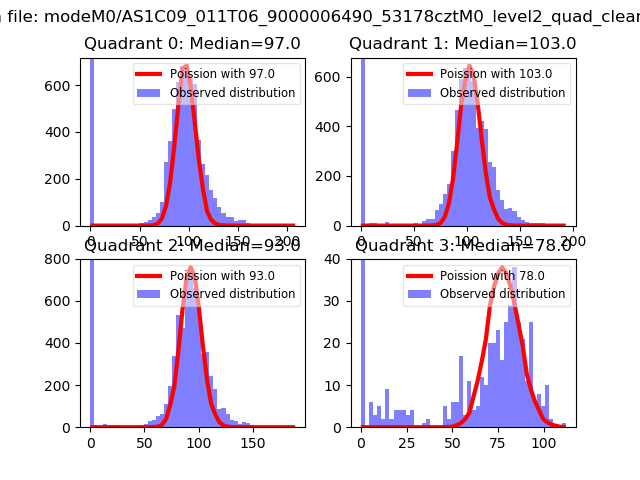 |
 |
| Quadrant-wise count rates Data is divided into 100 sec bins |
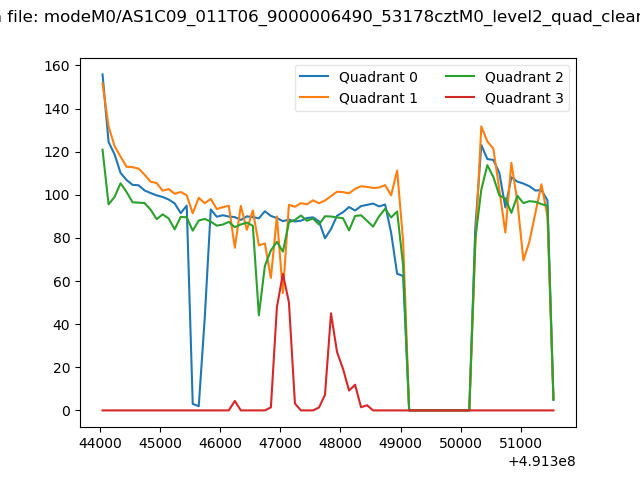 |
|
| Module-wise count rates for Quadrant A Data is divided into 100 sec bins |
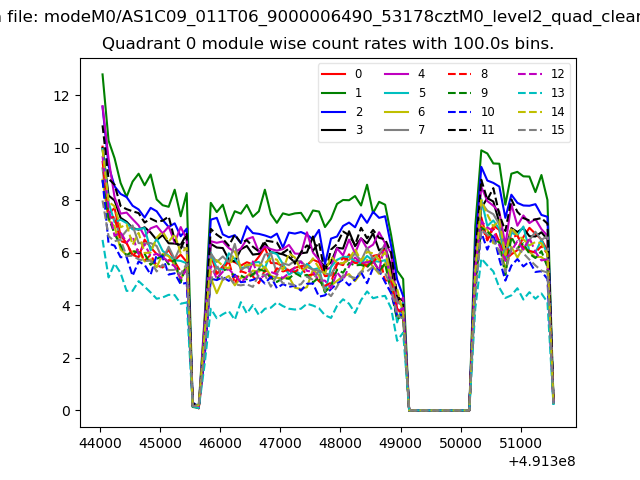 |
 |
| Module-wise count rates for Quadrant B Data is divided into 100 sec bins |
 |
 |
| Module-wise count rates for Quadrant C Data is divided into 100 sec bins |
 |
 |
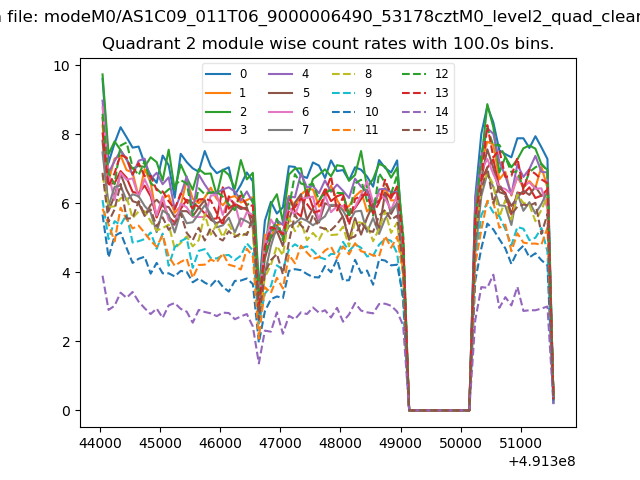
| Module-wise count rates for Quadrant D Data is divided into 100 sec bins |
 |
 |
| Parameter | Plot |
|---|---|
| CZT HV Monitor |  |
| D_VDD | 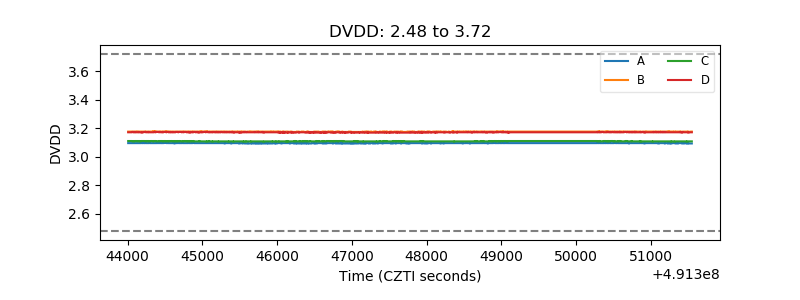 |
| Temperature 1 | 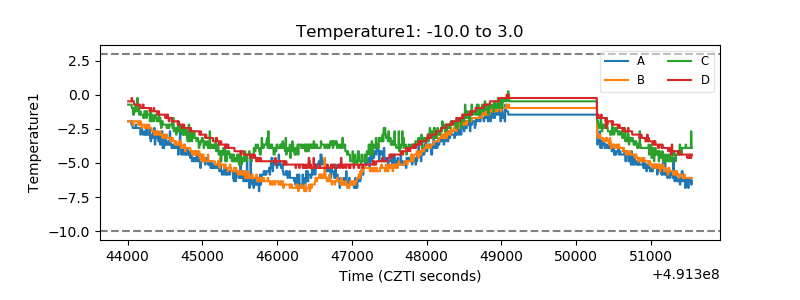 |
| Veto HV Monitor | 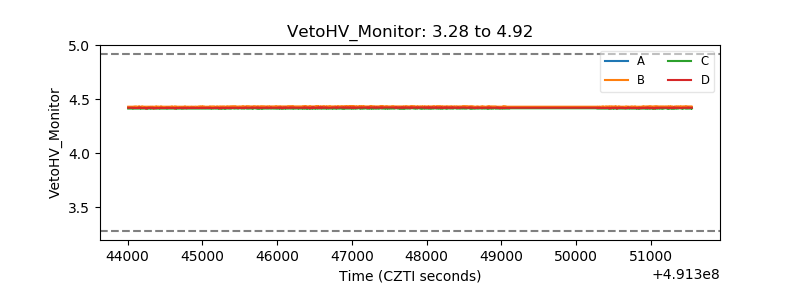 |
| Veto LLD | 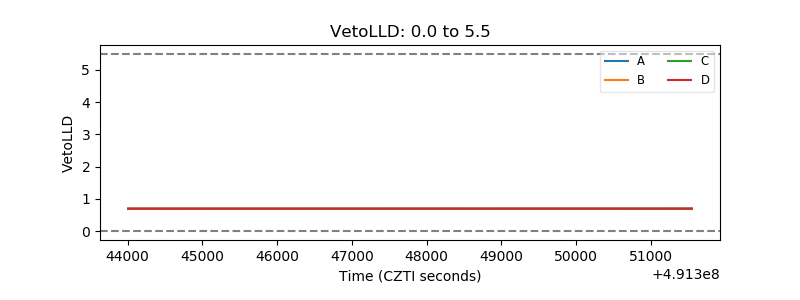 |
| Alpha Counter | 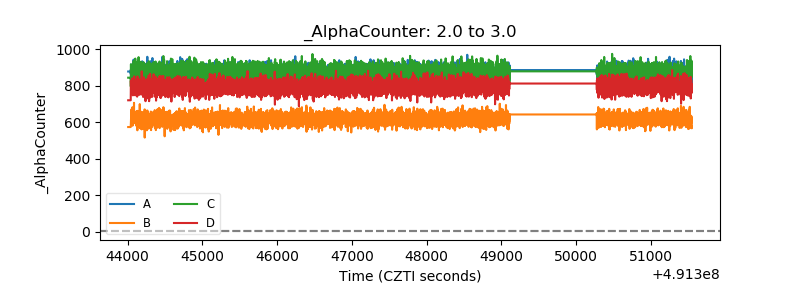 |
| _CPM_Rate | 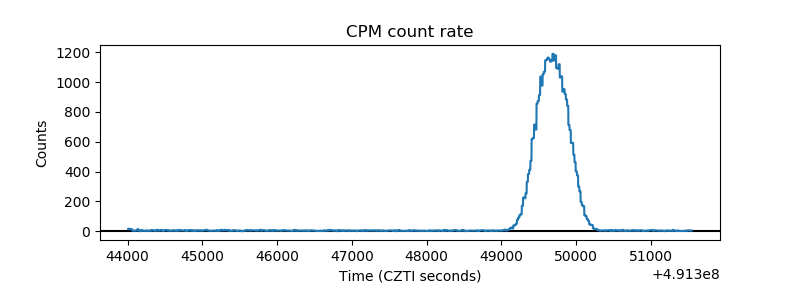 |
| CZT Counter | 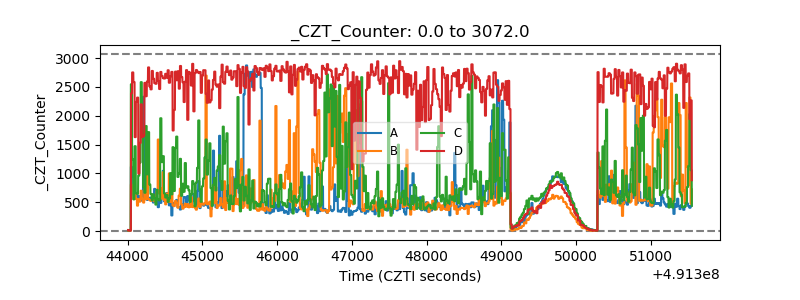 |
| +2.5 Volts monitor |  |
| +5 Volts monitor |  |
| _ROLL_ROT | 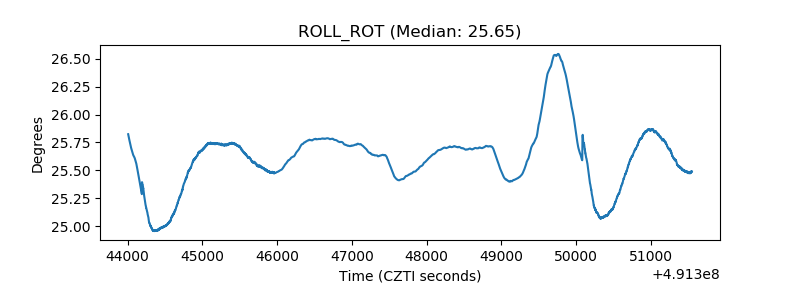 |
| _Roll_DEC | 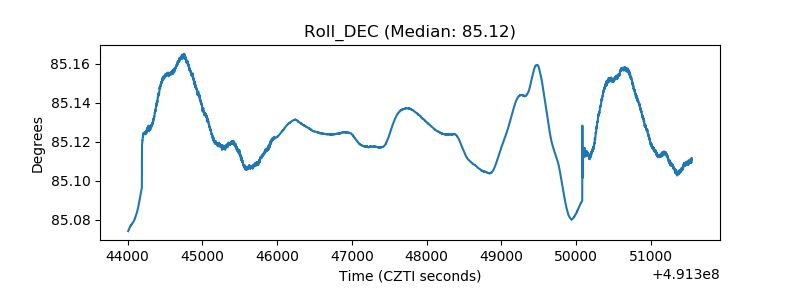 |
| _Roll_RA | 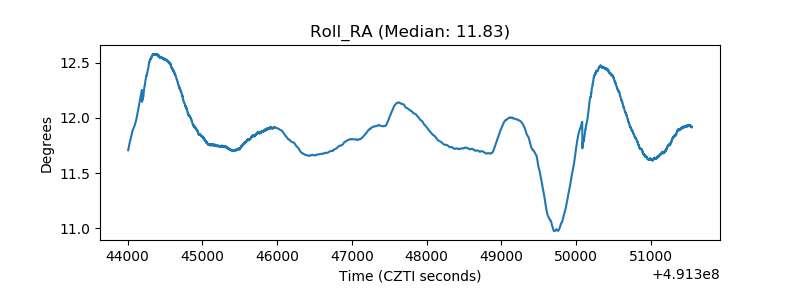 |
| Veto Counter | 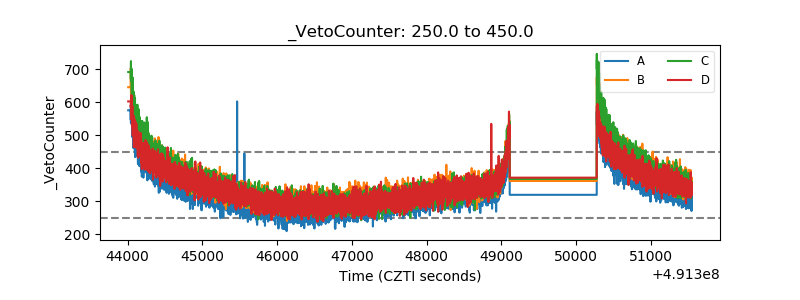 |