| Param | Original file | Final file |
|---|---|---|
| Filename | modeM0/AS1C09_011T06_9000006490_53180cztM0_level2.fits | modeM0/AS1C09_011T06_9000006490_53180cztM0_level2_quad_clean.evt |
| Size (bytes) | 1,610,907,840 | 134,706,240 |
| Size | 1.5 GB | 128.5 MB |
| Events in quadrant A | 6,249,899 | 1,136,098 |
| Events in quadrant B | 9,692,013 | 1,129,424 |
| Events in quadrant C | 12,811,276 | 936,671 |
| Events in quadrant D | 29,977,607 | 69,568 |
| Mode M9 | |||
|---|---|---|---|
| Quadrant | BADHDUFLAG | Total packets | Discarded packets |
| A | 0 | 24 | 0 |
| B | 0 | 25 | 0 |
| C | 0 | 25 | 0 |
| D | 0 | 25 | 0 |
| Mode SS | |||
|---|---|---|---|
| Quadrant | BADHDUFLAG | Total packets | Discarded packets |
| A | 0 | 238 | 0 |
| B | 0 | 238 | 0 |
| C | 0 | 238 | 0 |
| D | 0 | 238 | 0 |
| Mode M0 | |||
|---|---|---|---|
| Quadrant | BADHDUFLAG | Total packets | Discarded packets |
| A | 0 | 26771 | 3 |
| B | 0 | 36941 | 3 |
| C | 0 | 46265 | 3 |
| D | 0 | 97113 | 3 |
| Quadrant | Total seconds | Saturated seconds | Saturation percentage |
|---|---|---|---|
| A | 11654 | 137 | 1.175562% |
| B | 11654 | 1281 | 10.991934% |
| C | 11654 | 1975 | 16.946971% |
| D | 11654 | 11002 | 94.405354% |
Noise dominated data is calculated using 1-second bins in cleaned event files. If a bin has >2000 counts, and if more than 50% of those come from <1% of pixels, then it is considered to be noise-dominated and hence unusable.
| Quadrant | # 1 sec bins | Bins with >0 counts | Bins with >2000 counts | High rate bins dominated by noise | Noise dominated (total time) | Noise dominated (detector-on time) | Marked lightcurve |
|---|---|---|---|---|---|---|---|
| A | 14104 | 11656 | 86 | 86 | 0.61% | 0.74% | 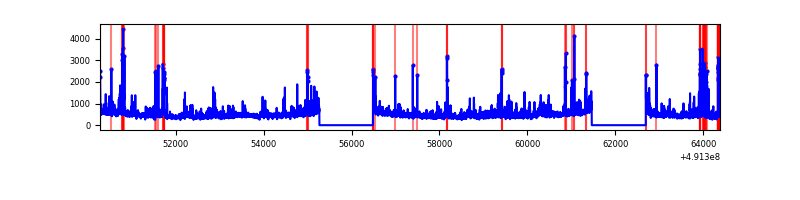 |
| B | 14104 | 11656 | 1032 | 1032 | 7.32% | 8.85% | 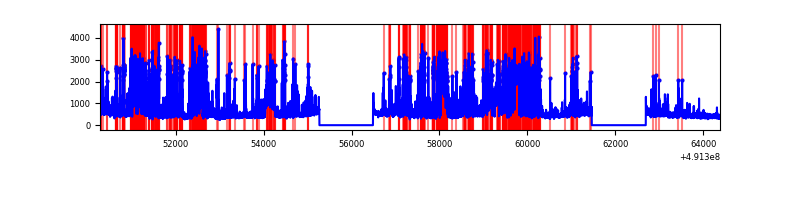 |
| C | 14104 | 11656 | 1934 | 1934 | 13.71% | 16.59% | 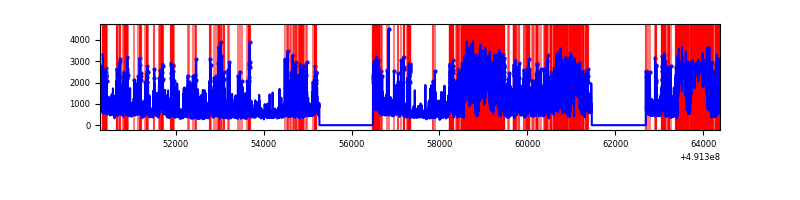 |
| D | 14104 | 11654 | 10874 | 10874 | 77.10% | 93.31% | 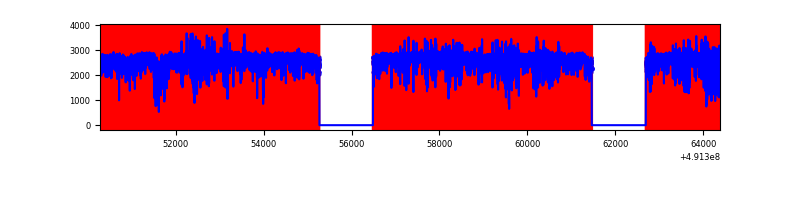 |
Top three noisy pixels from each quadrant. If the there are fewer than three noisy pixels in the level2.evt file, extra rows are filled as -1
| Pixel properties | Quadrant properties | ||||||
|---|---|---|---|---|---|---|---|
| Quadrant | DetID | PixID | Counts | Sigma | Mean | Median | Sigma |
| A | 3 | 14 | 330264 | 1090.07 | 1201 | 1173 | 301.9 |
| A | 8 | 249 | 217741 | 717.35 | 1201 | 1173 | 301.9 |
| A | 0 | 8 | 217467 | 716.44 | 1201 | 1173 | 301.9 |
| B | 10 | 191 | 1747108 | 7231.23 | 1154 | 1117 | 241.5 |
| B | 2 | 249 | 1408228 | 5827.72 | 1154 | 1117 | 241.5 |
| B | 4 | 81 | 1394848 | 5772.3 | 1154 | 1117 | 241.5 |
| C | 0 | 240 | 4601904 | 14950.59 | 1106 | 1098 | 307.7 |
| C | 15 | 224 | 2397491 | 7787.22 | 1106 | 1098 | 307.7 |
| C | 14 | 95 | 350455 | 1135.25 | 1106 | 1098 | 307.7 |
| D | 15 | 125 | 27271773 | 207053.85 | 444 | 423 | 131.7 |
| D | 2 | 249 | 359530 | 2726.47 | 444 | 423 | 131.7 |
| D | 2 | 153 | 117109 | 885.92 | 444 | 423 | 131.7 |
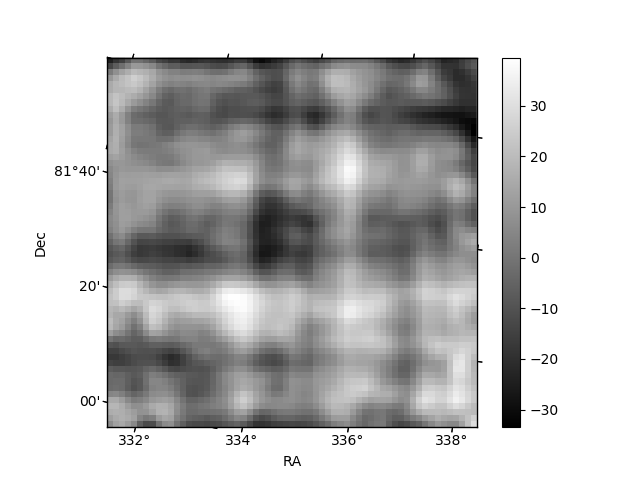
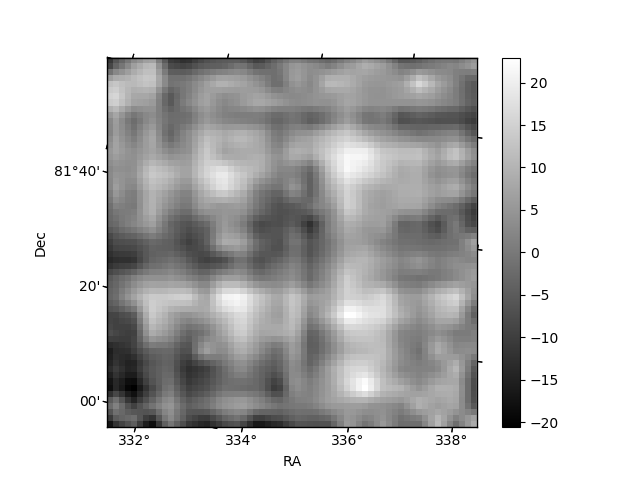
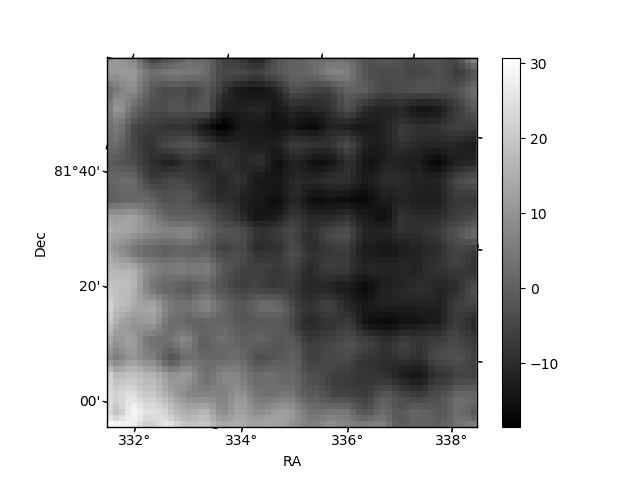
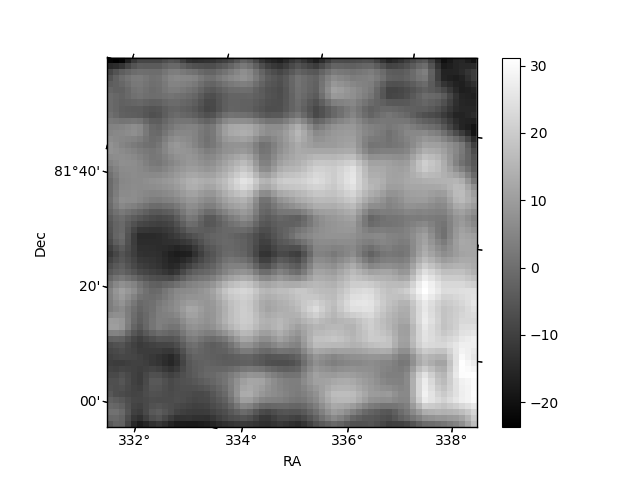
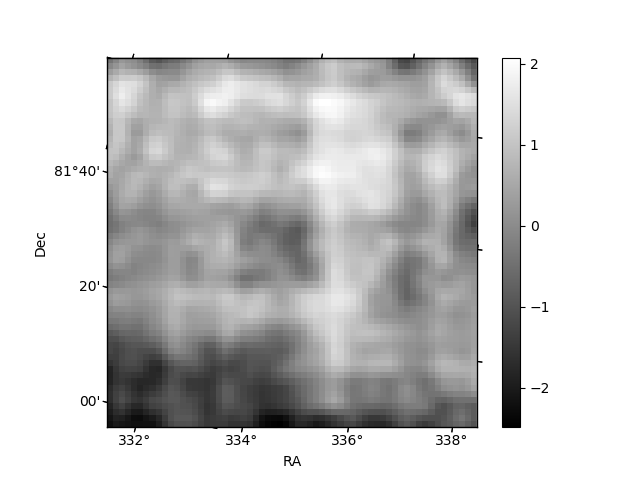
Histogram calculated using DETX and DETY for each event in the final _common_clean file
| Quadrant A | 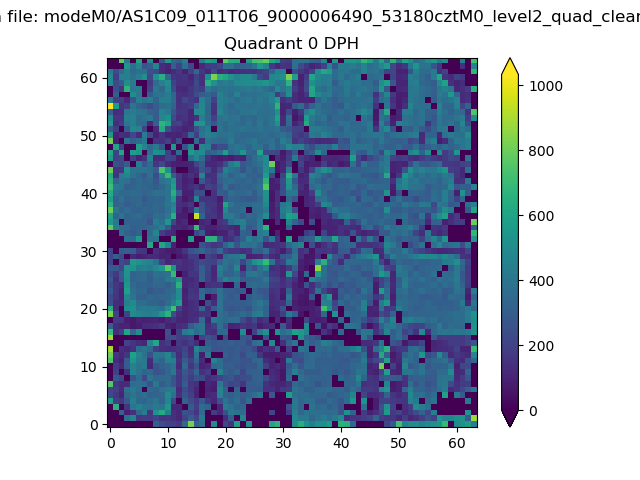 |
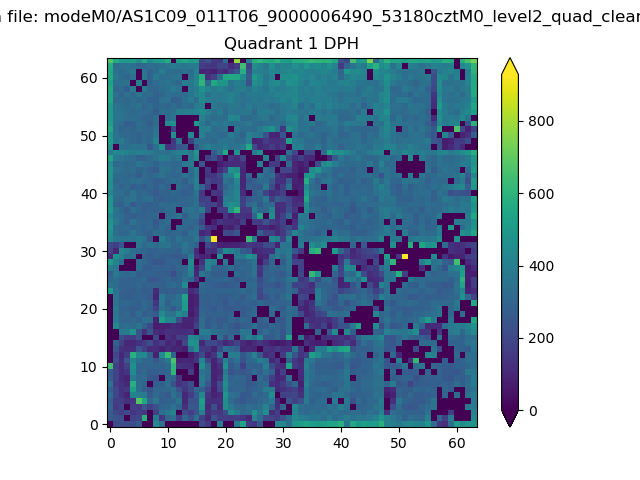 |
Quadrant B |
|---|---|---|---|
| Quadrant D | 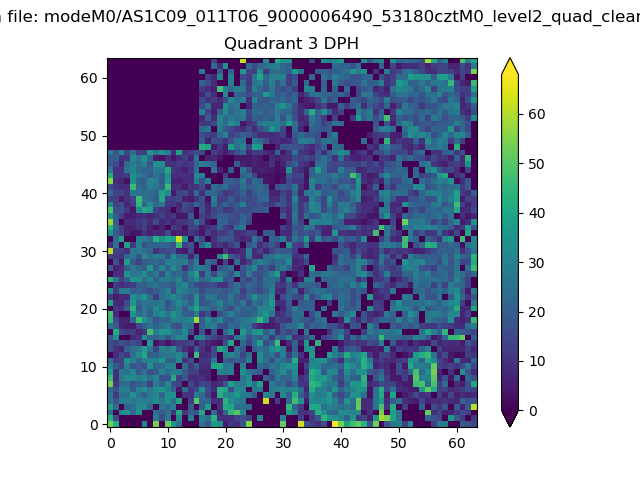 |
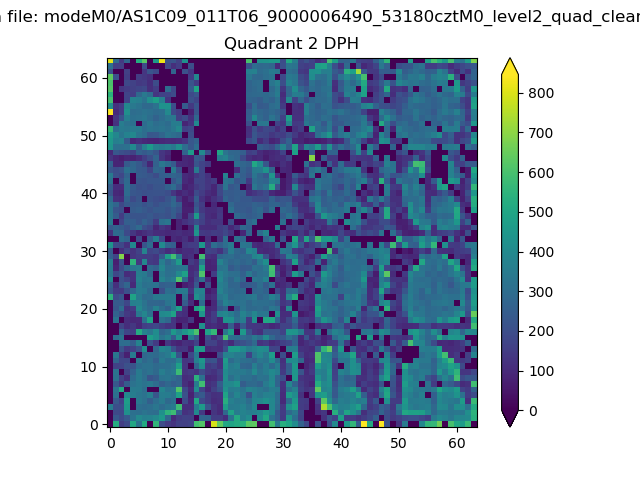 |
Quadrant C |
| Plot type | Count rate plots | Images |
|---|---|---|
| Comparison with Poisson distribution Blue bars denote a histogram of data divided into 1 sec bins. Red curve is a Poisson curve with rate = median count rate of data. |
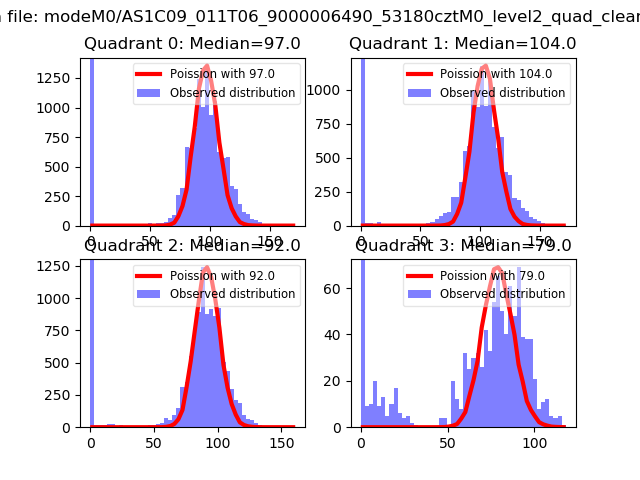 |
 |
| Quadrant-wise count rates Data is divided into 100 sec bins |
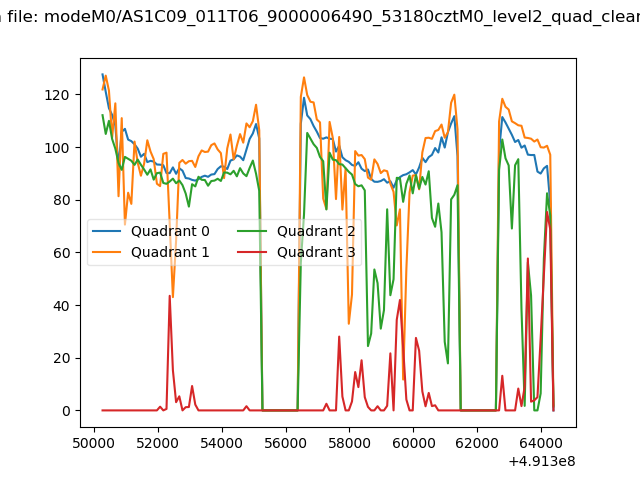 |
|
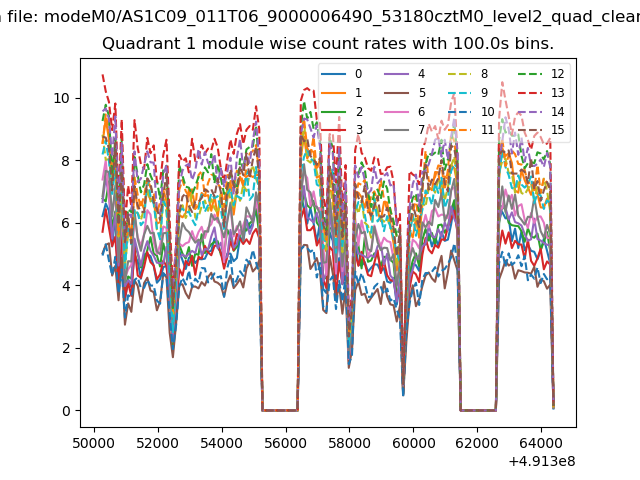
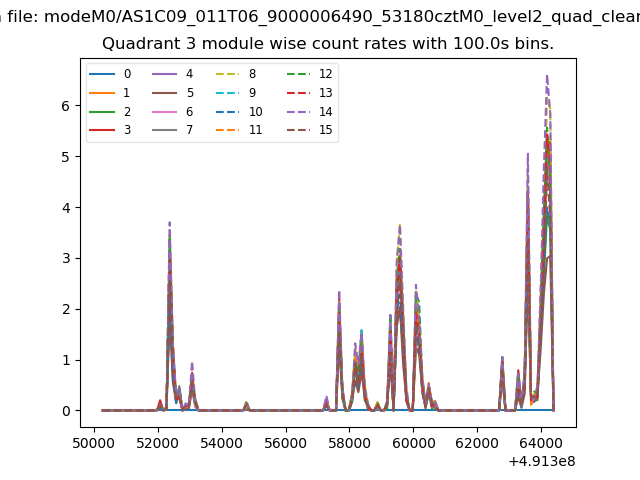
| Module-wise count rates for Quadrant A Data is divided into 100 sec bins |
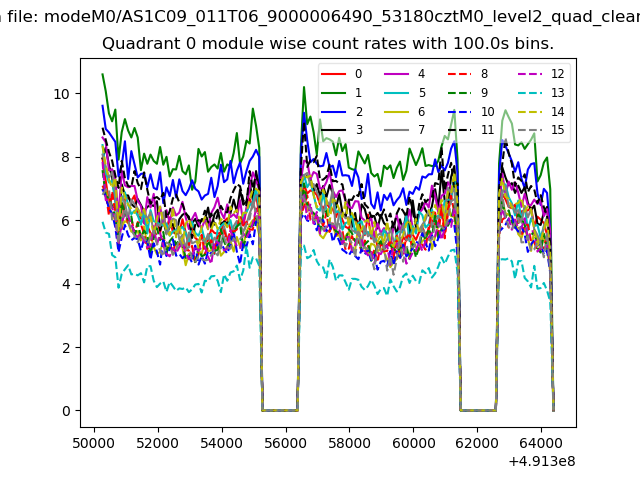 |
 |
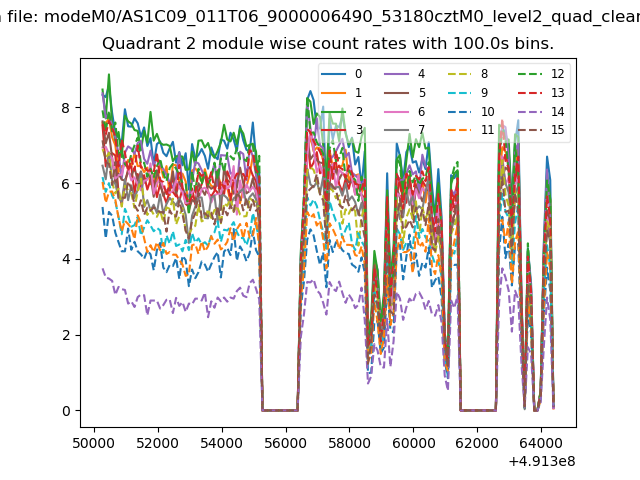
| Module-wise count rates for Quadrant B Data is divided into 100 sec bins |
 |
 |
| Module-wise count rates for Quadrant C Data is divided into 100 sec bins |
 |
 |
| Module-wise count rates for Quadrant D Data is divided into 100 sec bins |
 |
 |
| Parameter | Plot |
|---|---|
| CZT HV Monitor | 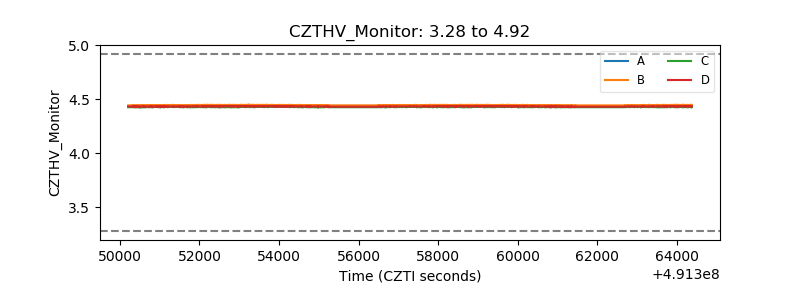 |
| D_VDD | 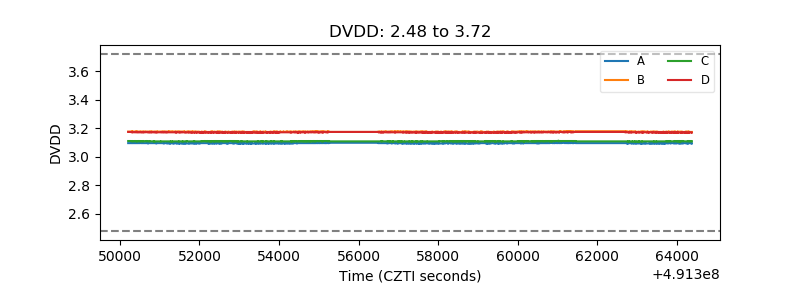 |
| Temperature 1 | 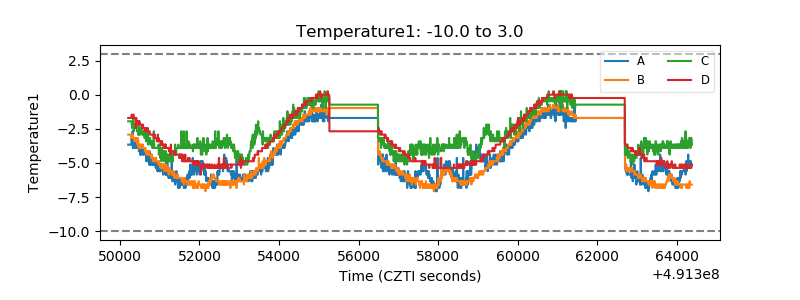 |
| Veto HV Monitor | 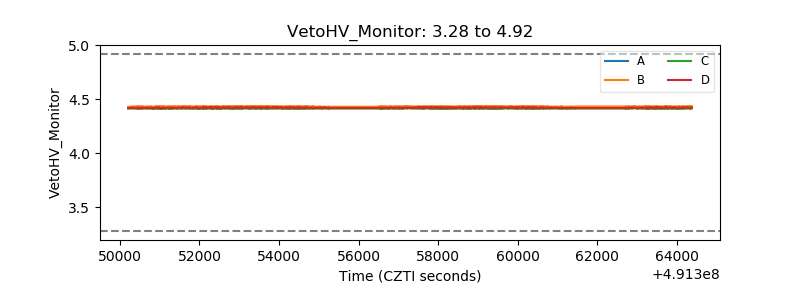 |
| Veto LLD | 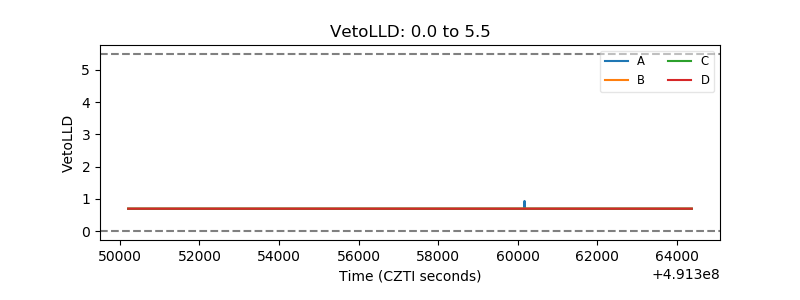 |
| Alpha Counter | 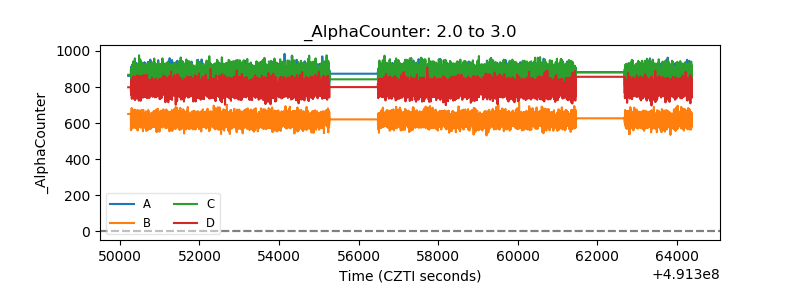 |
| _CPM_Rate | 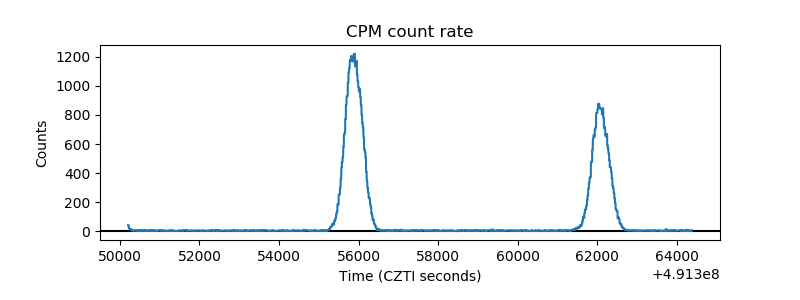 |
| CZT Counter | 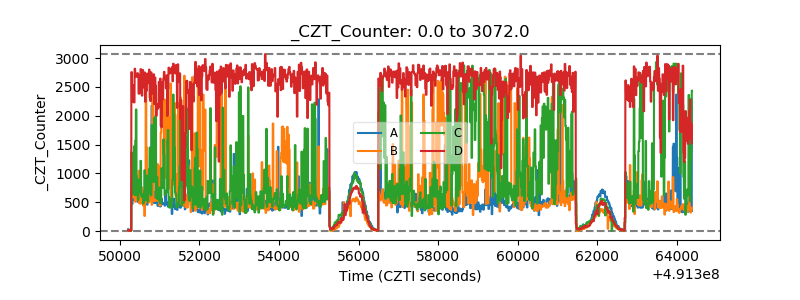 |
| +2.5 Volts monitor |  |
| +5 Volts monitor |  |
| _ROLL_ROT | 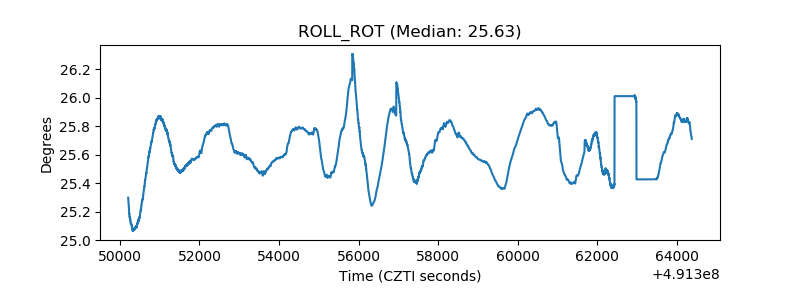 |
| _Roll_DEC | 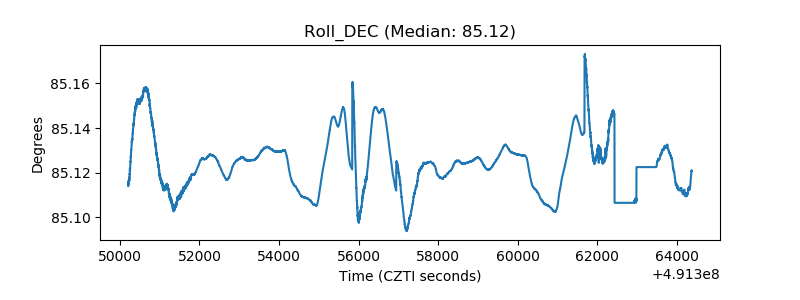 |
| _Roll_RA | 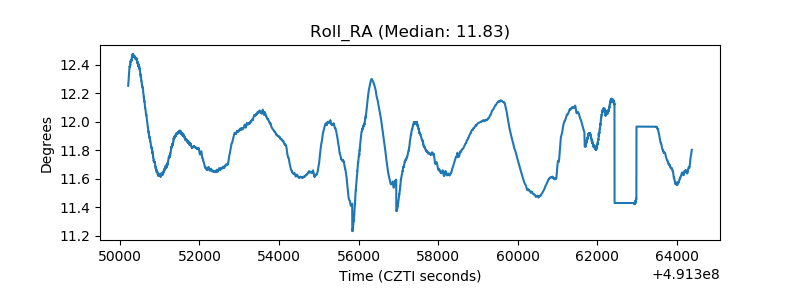 |
| Veto Counter | 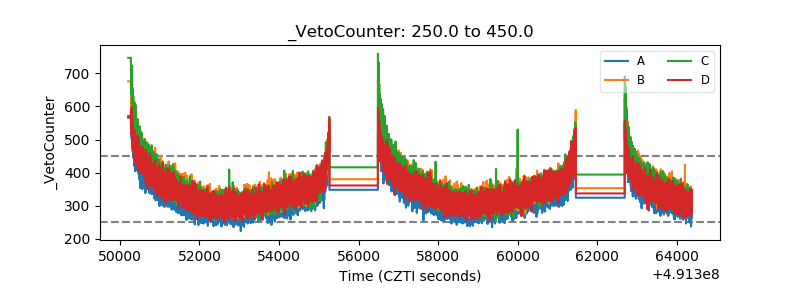 |