| Param | Original file | Final file |
|---|---|---|
| Filename | modeM0/AS1C09_011T06_9000006490_53182cztM0_level2.fits | modeM0/AS1C09_011T06_9000006490_53182cztM0_level2_quad_clean.evt |
| Size (bytes) | 960,505,920 | 70,649,280 |
| Size | 916.0 MB | 67.4 MB |
| Events in quadrant A | 4,385,036 | 591,468 |
| Events in quadrant B | 3,502,678 | 644,016 |
| Events in quadrant C | 10,802,648 | 378,245 |
| Events in quadrant D | 16,363,817 | 73,246 |
| Mode M9 | |||
|---|---|---|---|
| Quadrant | BADHDUFLAG | Total packets | Discarded packets |
| A | 0 | 9 | 0 |
| B | 0 | 9 | 0 |
| C | 0 | 9 | 0 |
| D | 0 | 9 | 0 |
| Mode SS | |||
|---|---|---|---|
| Quadrant | BADHDUFLAG | Total packets | Discarded packets |
| A | 0 | 130 | 0 |
| B | 0 | 130 | 0 |
| C | 0 | 132 | 0 |
| D | 0 | 132 | 0 |
| Mode M0 | |||
|---|---|---|---|
| Quadrant | BADHDUFLAG | Total packets | Discarded packets |
| A | 0 | 17690 | 1 |
| B | 0 | 15132 | 1 |
| C | 0 | 36581 | 1 |
| D | 0 | 53051 | 1 |
| Quadrant | Total seconds | Saturated seconds | Saturation percentage |
|---|---|---|---|
| A | 6478 | 280 | 4.322322% |
| B | 6478 | 151 | 2.330966% |
| C | 6478 | 2572 | 39.703612% |
| D | 6478 | 5732 | 88.484100% |
Noise dominated data is calculated using 1-second bins in cleaned event files. If a bin has >2000 counts, and if more than 50% of those come from <1% of pixels, then it is considered to be noise-dominated and hence unusable.
| Quadrant | # 1 sec bins | Bins with >0 counts | Bins with >2000 counts | High rate bins dominated by noise | Noise dominated (total time) | Noise dominated (detector-on time) | Marked lightcurve |
|---|---|---|---|---|---|---|---|
| A | 7338 | 6479 | 262 | 262 | 3.57% | 4.04% | 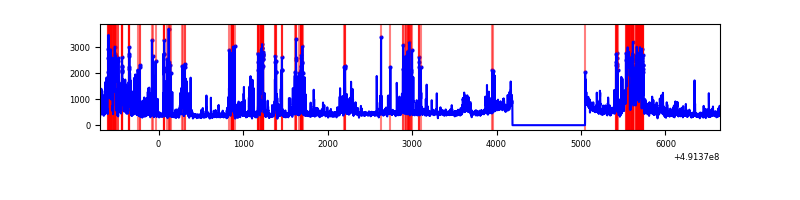 |
| B | 7338 | 6479 | 70 | 70 | 0.95% | 1.08% | 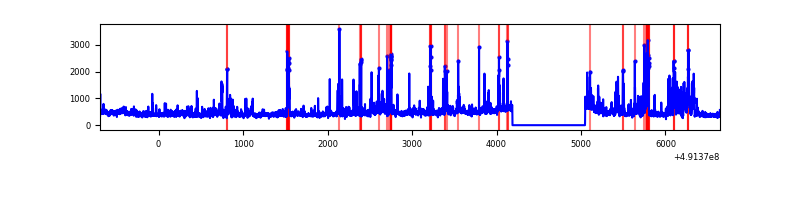 |
| C | 7338 | 6479 | 2536 | 2536 | 34.56% | 39.14% | 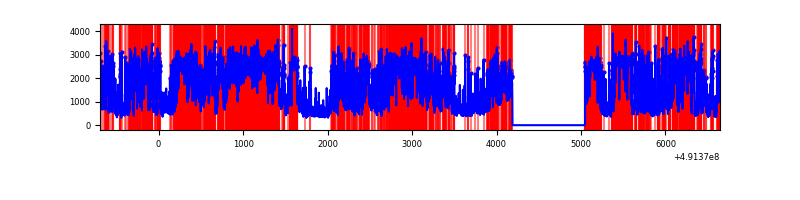 |
| D | 7337 | 6477 | 5815 | 5815 | 79.26% | 89.78% | 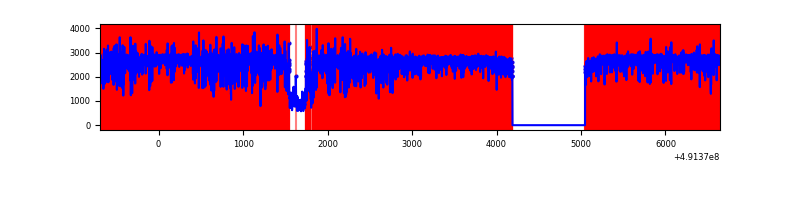 |
Top three noisy pixels from each quadrant. If the there are fewer than three noisy pixels in the level2.evt file, extra rows are filled as -1
| Pixel properties | Quadrant properties | ||||||
|---|---|---|---|---|---|---|---|
| Quadrant | DetID | PixID | Counts | Sigma | Mean | Median | Sigma |
| A | 3 | 62 | 950462 | 5928.33 | 645 | 630 | 160.2 |
| A | 0 | 8 | 346404 | 2158.13 | 645 | 630 | 160.2 |
| A | 3 | 14 | 143351 | 890.79 | 645 | 630 | 160.2 |
| B | 4 | 81 | 381599 | 2744.8 | 649 | 626 | 138.8 |
| B | 2 | 249 | 129469 | 928.28 | 649 | 626 | 138.8 |
| B | 10 | 254 | 78285 | 559.51 | 649 | 626 | 138.8 |
| C | 0 | 240 | 2726064 | 18678.41 | 528 | 523 | 145.9 |
| C | 1 | 241 | 2327197 | 15944.93 | 528 | 523 | 145.9 |
| C | 12 | 250 | 1014573 | 6949.39 | 528 | 523 | 145.9 |
| D | 15 | 125 | 14695929 | 161260.2 | 313 | 298 | 91.1 |
| D | 2 | 153 | 112528 | 1231.54 | 313 | 298 | 91.1 |
| D | 12 | 3 | 79964 | 874.2 | 313 | 298 | 91.1 |
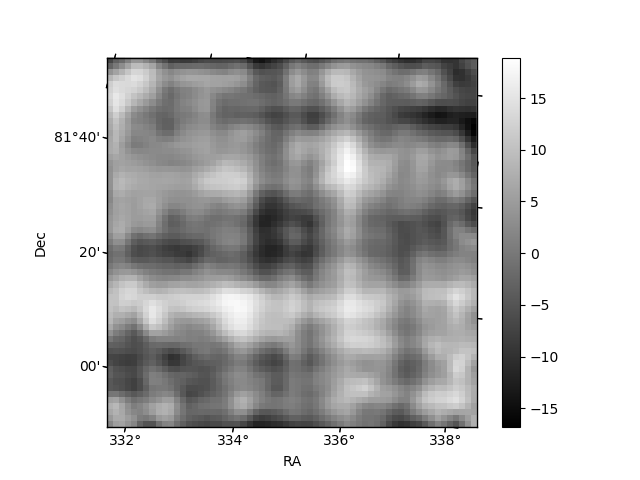
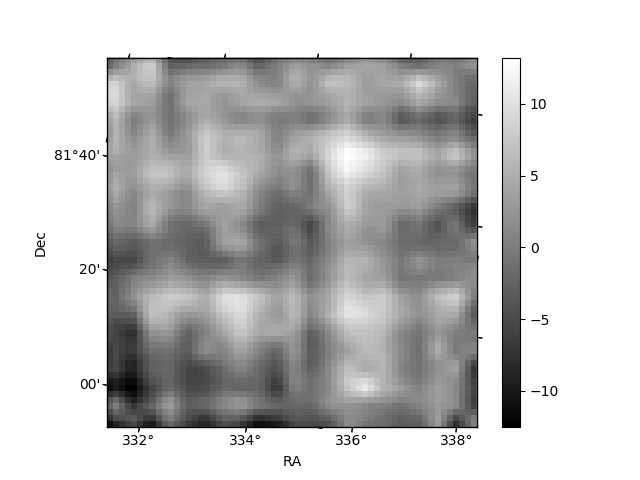
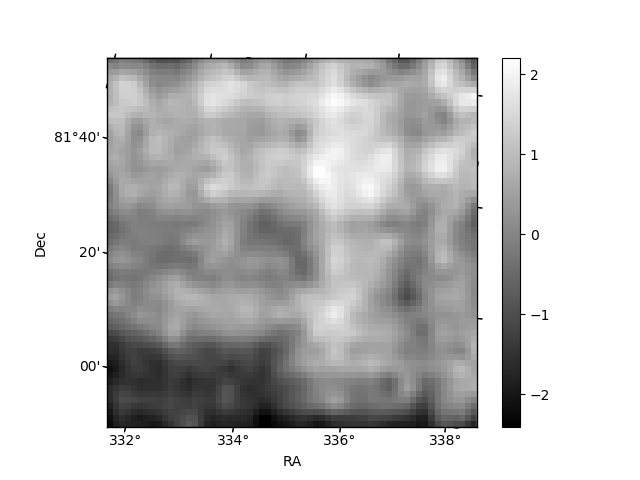
Histogram calculated using DETX and DETY for each event in the final _common_clean file
| Quadrant A | 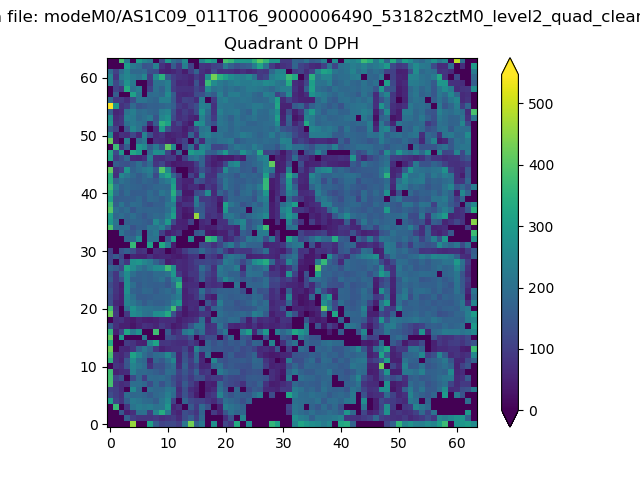 |
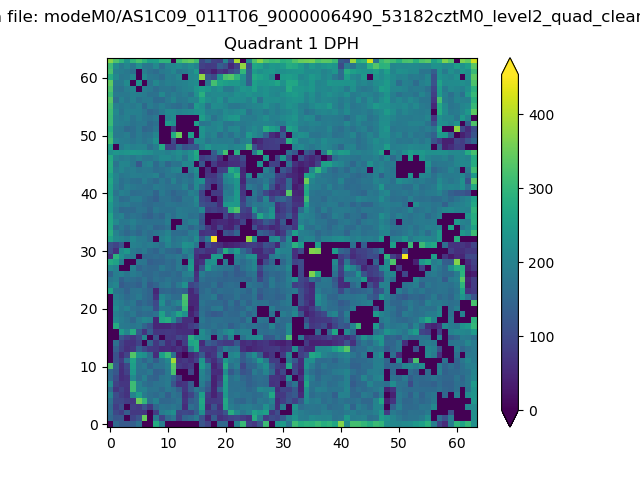 |
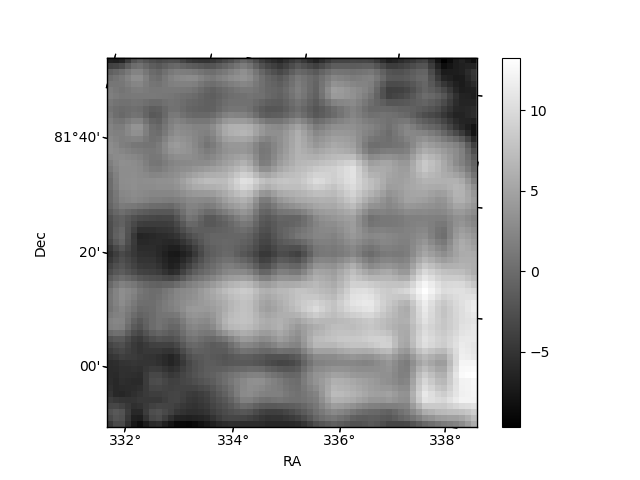
Quadrant B |
|---|---|---|---|
| Quadrant D | 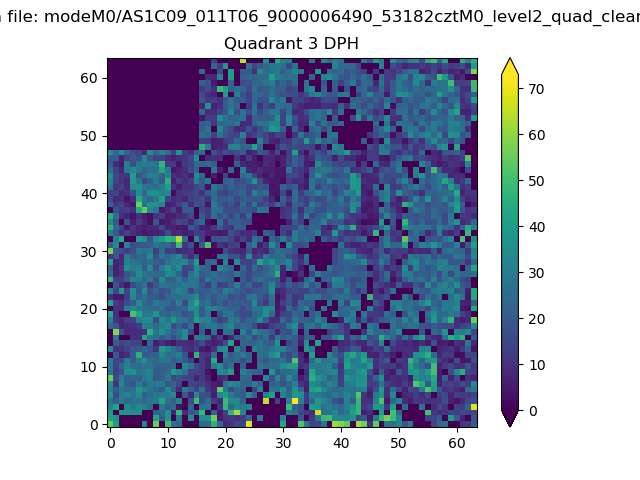 |
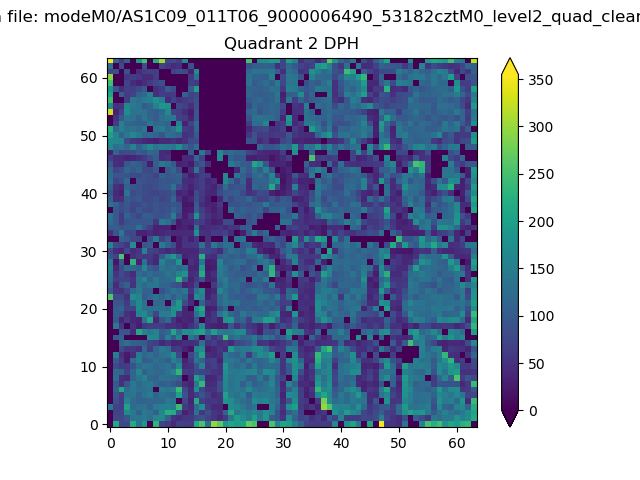 |
Quadrant C |
| Plot type | Count rate plots | Images |
|---|---|---|
| Comparison with Poisson distribution Blue bars denote a histogram of data divided into 1 sec bins. Red curve is a Poisson curve with rate = median count rate of data. |
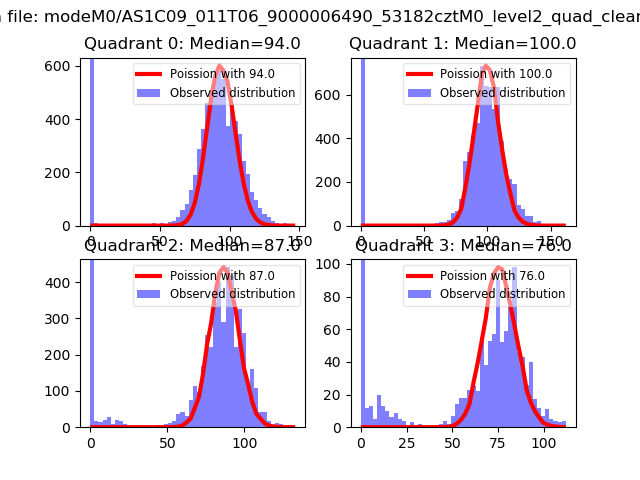 |
 |
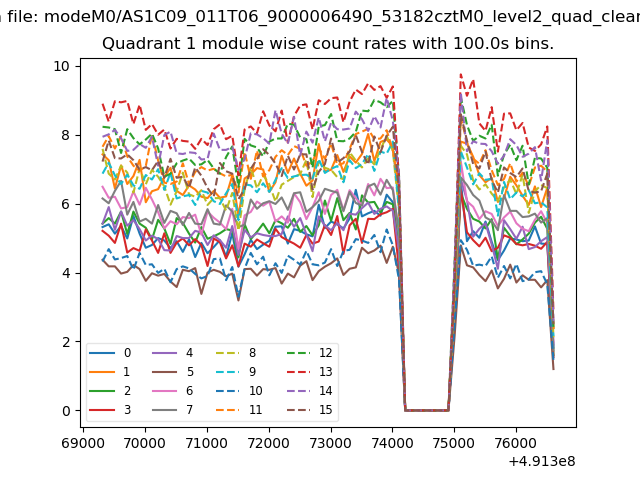
| Quadrant-wise count rates Data is divided into 100 sec bins |
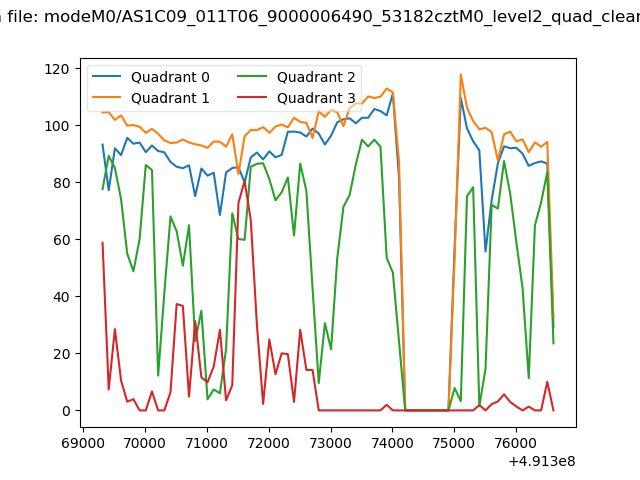 |
|
| Module-wise count rates for Quadrant A Data is divided into 100 sec bins |
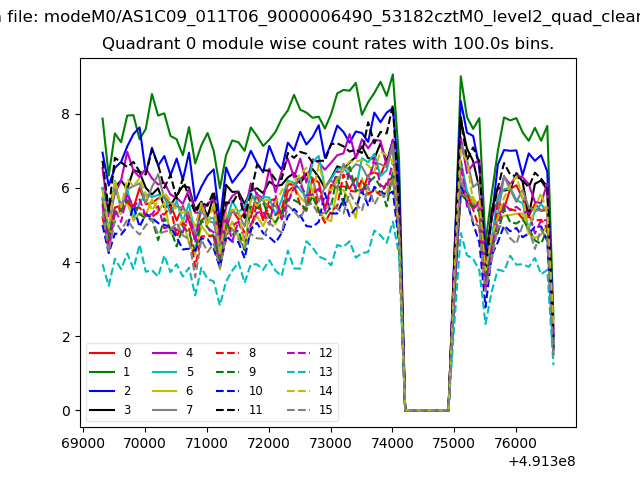 |
 |
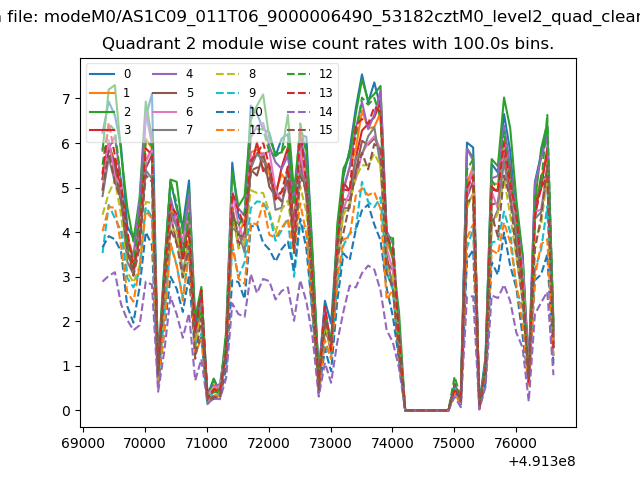
| Module-wise count rates for Quadrant B Data is divided into 100 sec bins |
 |
 |
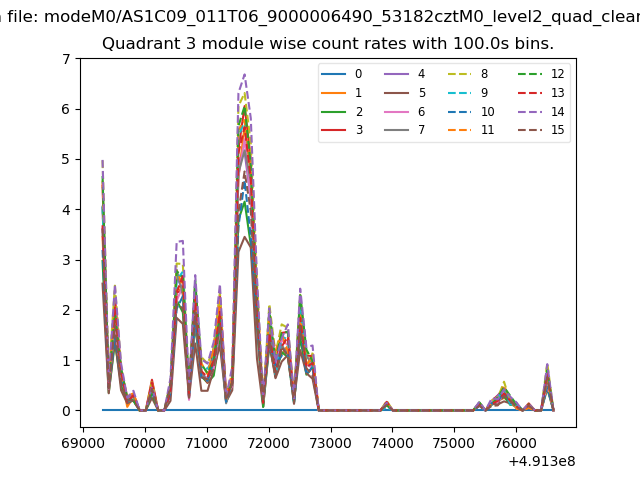
| Module-wise count rates for Quadrant C Data is divided into 100 sec bins |
 |
 |
| Module-wise count rates for Quadrant D Data is divided into 100 sec bins |
 |
 |
| Parameter | Plot |
|---|---|
| CZT HV Monitor | 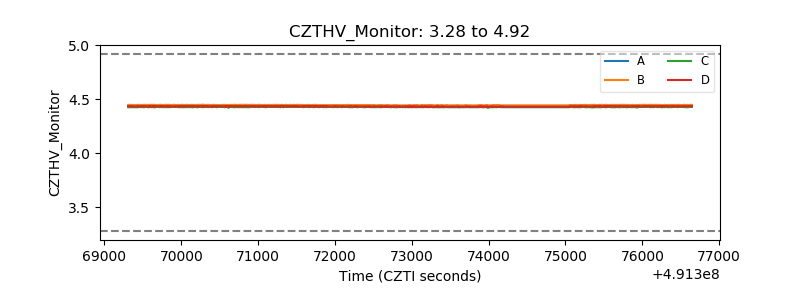 |
| D_VDD | 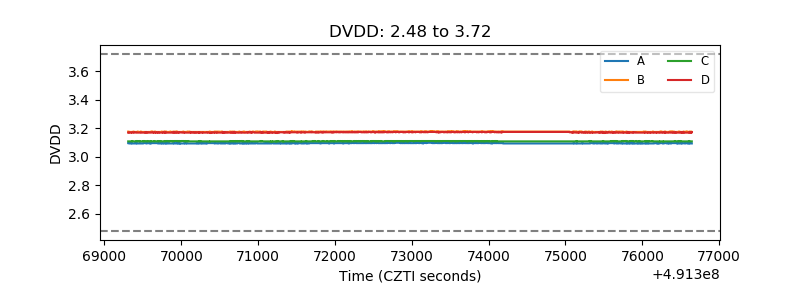 |
| Temperature 1 | 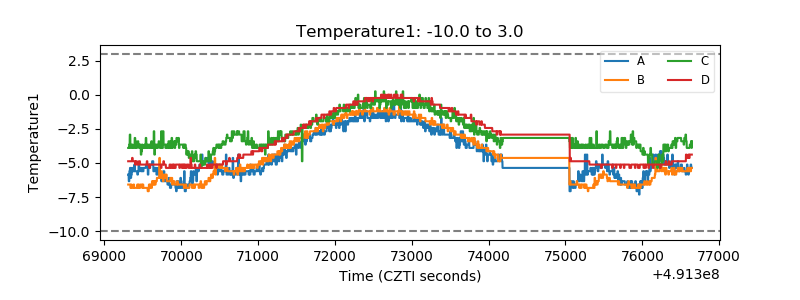 |
| Veto HV Monitor | 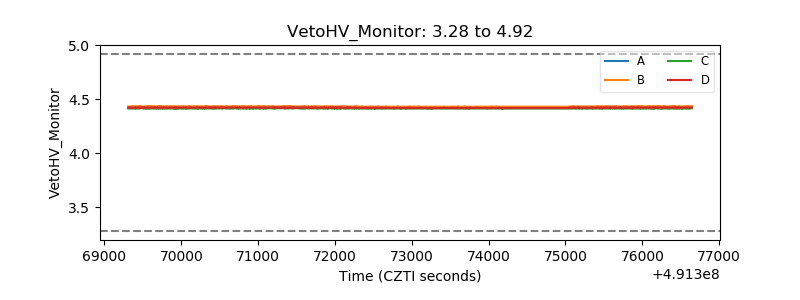 |
| Veto LLD | 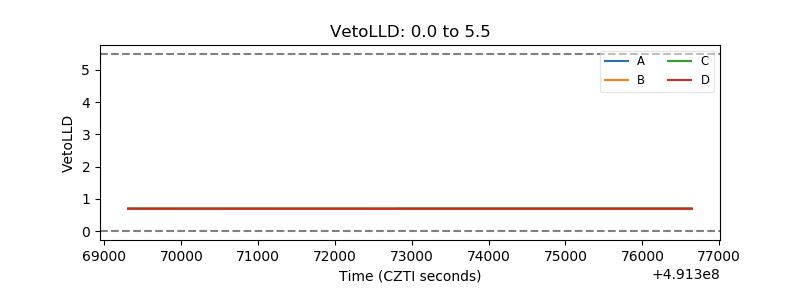 |
| Alpha Counter |  |
| _CPM_Rate | 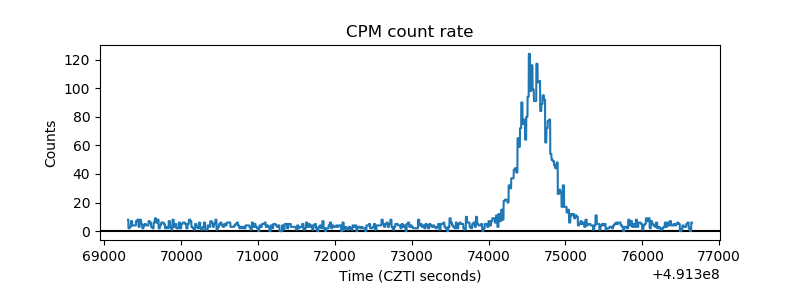 |
| CZT Counter | 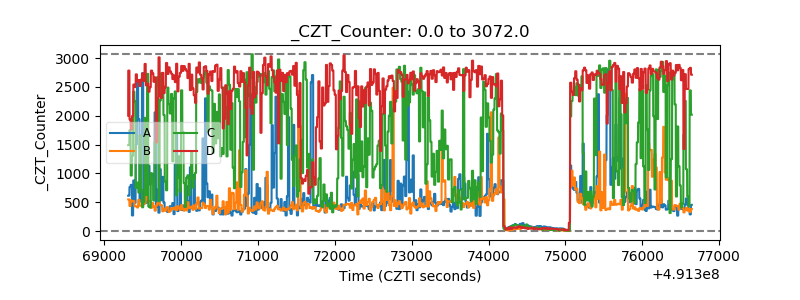 |
| +2.5 Volts monitor |  |
| +5 Volts monitor | 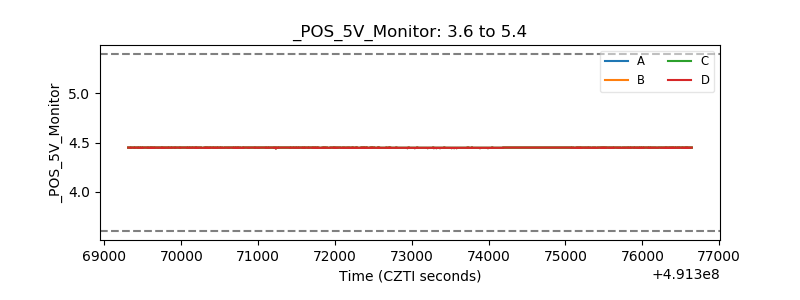 |
| _ROLL_ROT | 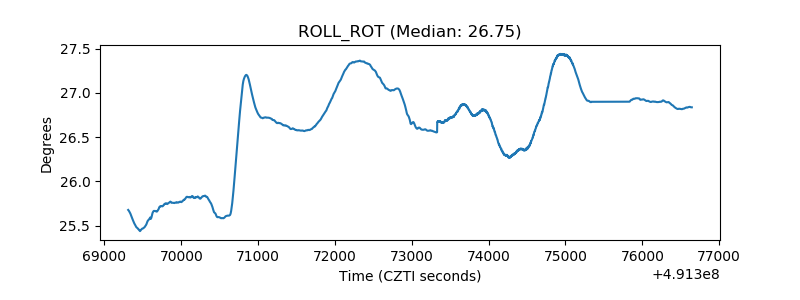 |
| _Roll_DEC | 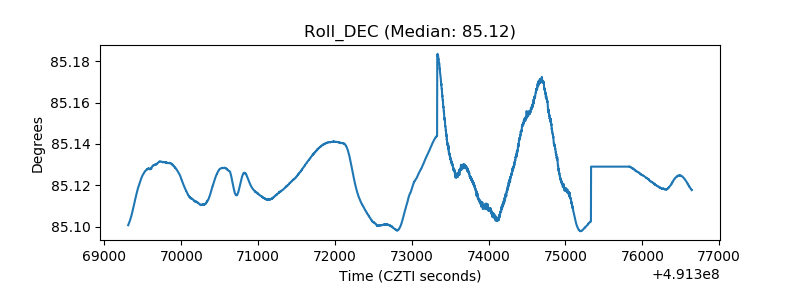 |
| _Roll_RA | 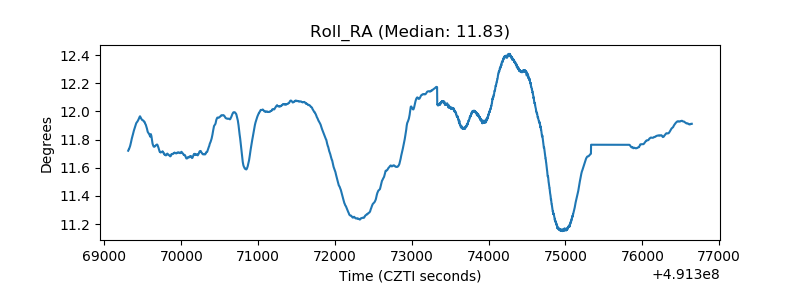 |
| Veto Counter | 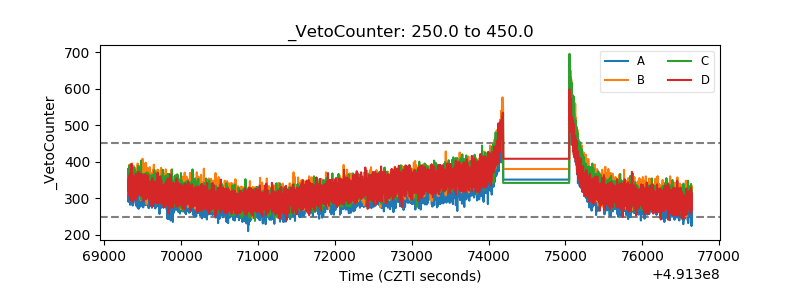 |