| Param | Original file | Final file |
|---|---|---|
| Filename | modeM0/AS1C09_011T06_9000006490_53183cztM0_level2.fits | modeM0/AS1C09_011T06_9000006490_53183cztM0_level2_quad_clean.evt |
| Size (bytes) | 1,034,884,800 | 69,091,200 |
| Size | 986.9 MB | 65.9 MB |
| Events in quadrant A | 4,013,751 | 602,874 |
| Events in quadrant B | 3,775,519 | 661,992 |
| Events in quadrant C | 12,943,194 | 288,010 |
| Events in quadrant D | 17,052,600 | 67,583 |
| Mode M9 | |||
|---|---|---|---|
| Quadrant | BADHDUFLAG | Total packets | Discarded packets |
| A | 0 | 3 | 0 |
| B | 0 | 3 | 0 |
| C | 0 | 3 | 0 |
| D | 0 | 3 | 0 |
| Mode SS | |||
|---|---|---|---|
| Quadrant | BADHDUFLAG | Total packets | Discarded packets |
| A | 0 | 136 | 0 |
| B | 0 | 136 | 0 |
| C | 0 | 136 | 0 |
| D | 0 | 136 | 0 |
| Mode M0 | |||
|---|---|---|---|
| Quadrant | BADHDUFLAG | Total packets | Discarded packets |
| A | 0 | 16965 | 1 |
| B | 0 | 16227 | 1 |
| C | 0 | 43021 | 1 |
| D | 0 | 55362 | 1 |
| Quadrant | Total seconds | Saturated seconds | Saturation percentage |
|---|---|---|---|
| A | 6761 | 391 | 5.783168% |
| B | 6762 | 234 | 3.460515% |
| C | 6762 | 3839 | 56.773144% |
| D | 6762 | 6139 | 90.786749% |
Noise dominated data is calculated using 1-second bins in cleaned event files. If a bin has >2000 counts, and if more than 50% of those come from <1% of pixels, then it is considered to be noise-dominated and hence unusable.
| Quadrant | # 1 sec bins | Bins with >0 counts | Bins with >2000 counts | High rate bins dominated by noise | Noise dominated (total time) | Noise dominated (detector-on time) | Marked lightcurve |
|---|---|---|---|---|---|---|---|
| A | 7031 | 6762 | 250 | 250 | 3.56% | 3.70% | 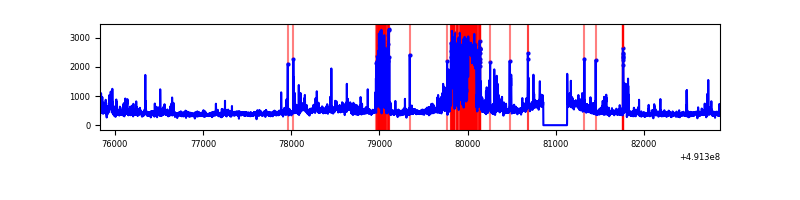 |
| B | 7032 | 6763 | 62 | 62 | 0.88% | 0.92% | 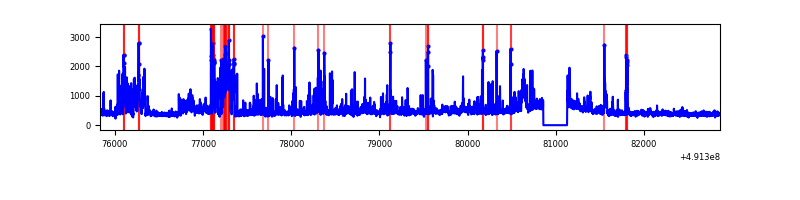 |
| C | 7031 | 6761 | 3775 | 3775 | 53.69% | 55.83% | 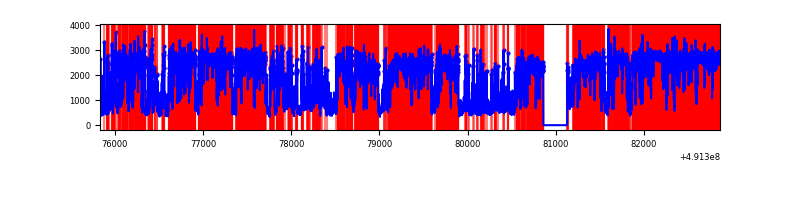 |
| D | 7031 | 6761 | 6065 | 6065 | 86.26% | 89.71% | 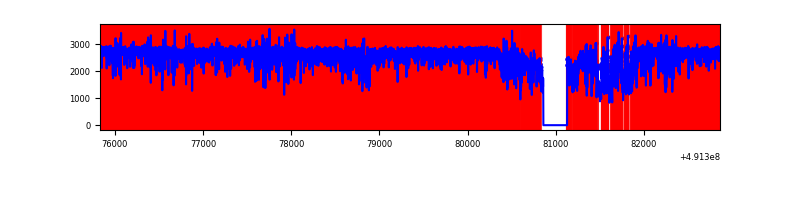 |
Top three noisy pixels from each quadrant. If the there are fewer than three noisy pixels in the level2.evt file, extra rows are filled as -1
| Pixel properties | Quadrant properties | ||||||
|---|---|---|---|---|---|---|---|
| Quadrant | DetID | PixID | Counts | Sigma | Mean | Median | Sigma |
| A | 3 | 62 | 459251 | 2665.94 | 690 | 671 | 172.0 |
| A | 7 | 206 | 280750 | 1628.23 | 690 | 671 | 172.0 |
| A | 15 | 174 | 224922 | 1303.67 | 690 | 671 | 172.0 |
| B | 4 | 81 | 565697 | 3821.09 | 691 | 667 | 147.9 |
| B | 2 | 249 | 135527 | 912.01 | 691 | 667 | 147.9 |
| B | 10 | 28 | 59481 | 397.74 | 691 | 667 | 147.9 |
| C | 0 | 240 | 6614875 | 46172.93 | 519 | 514 | 143.3 |
| C | 1 | 241 | 2398061 | 16736.58 | 519 | 514 | 143.3 |
| C | 15 | 224 | 1005387 | 7014.73 | 519 | 514 | 143.3 |
| D | 15 | 125 | 14940833 | 149531.64 | 345 | 329 | 99.9 |
| D | 2 | 62 | 168913 | 1687.27 | 345 | 329 | 99.9 |
| D | 11 | 245 | 140617 | 1404.07 | 345 | 329 | 99.9 |
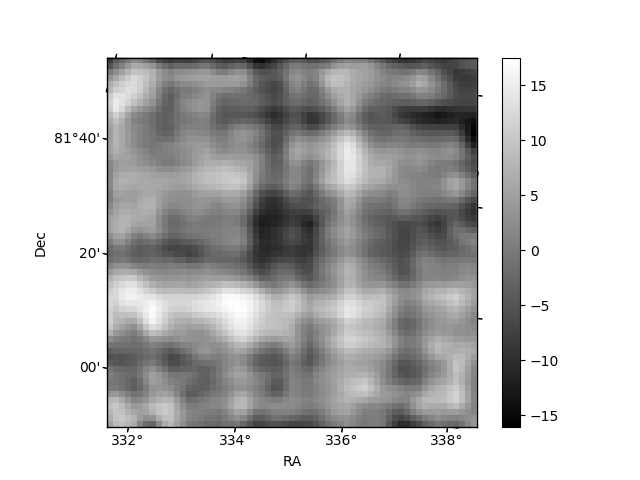
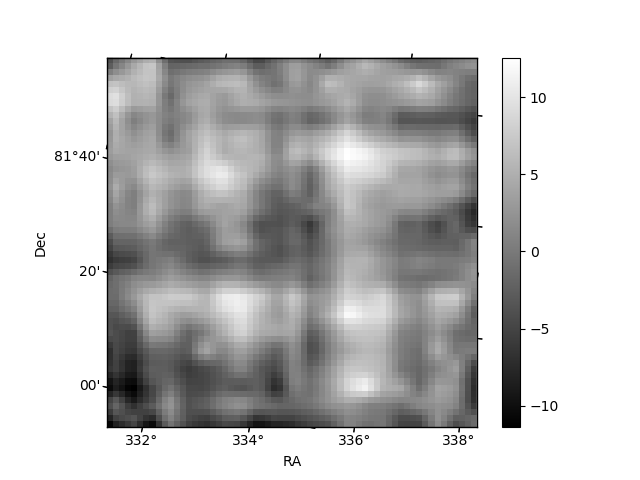
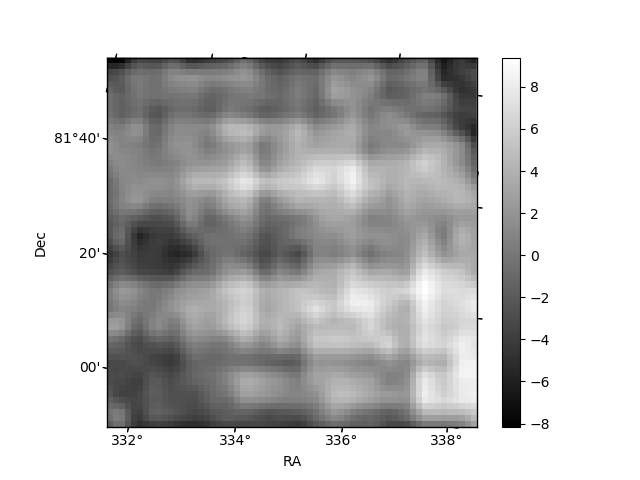
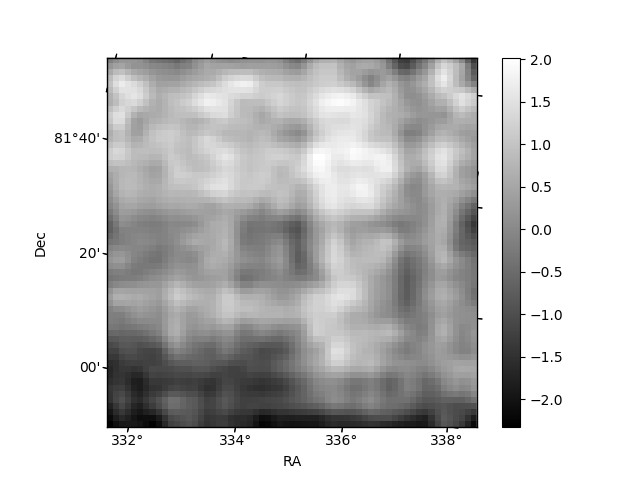
Histogram calculated using DETX and DETY for each event in the final _common_clean file
| Quadrant A | 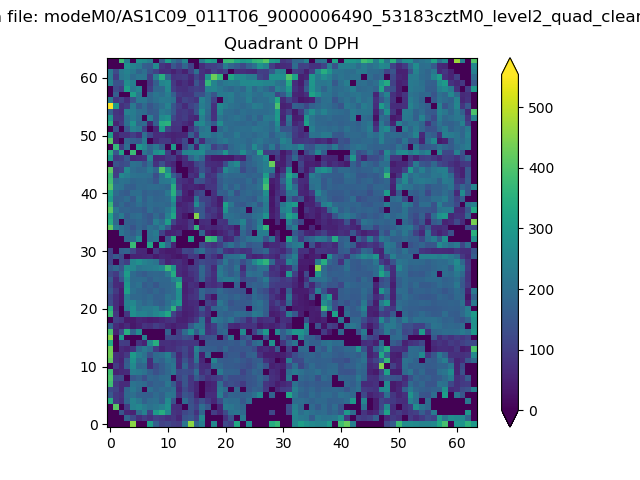 |
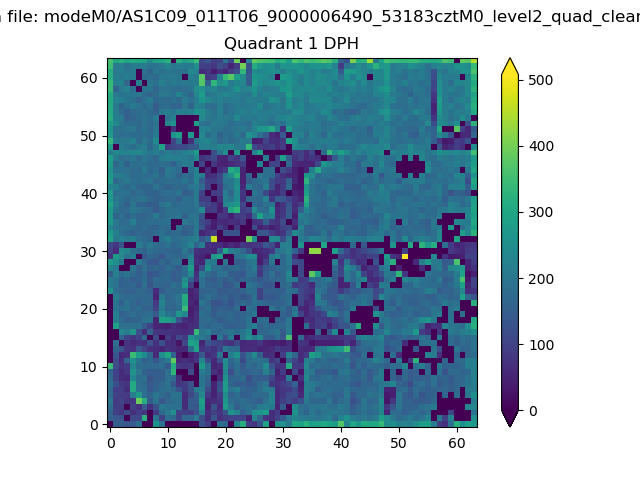 |
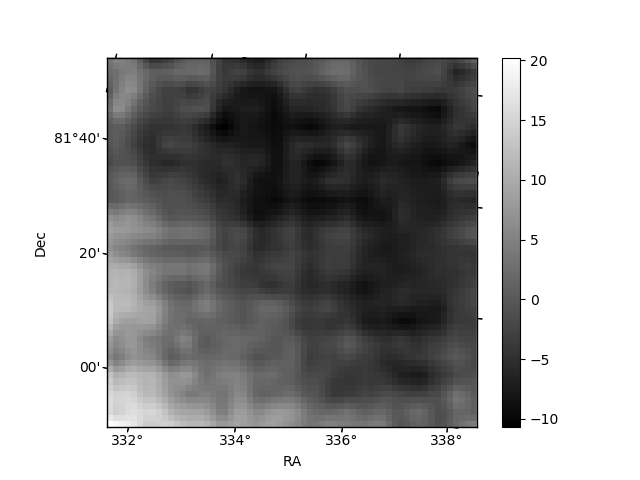
Quadrant B |
|---|---|---|---|
| Quadrant D | 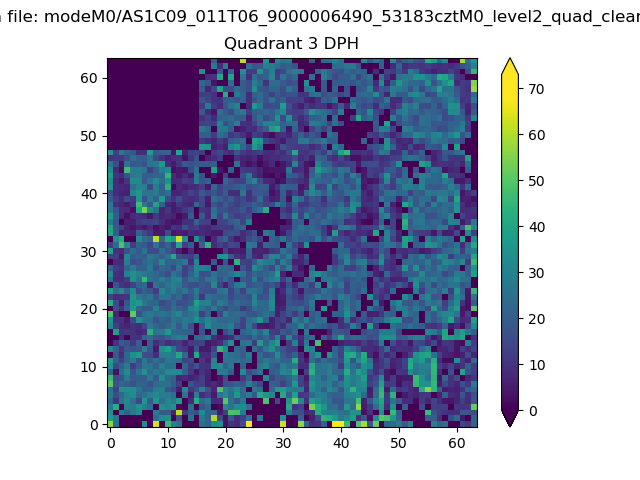 |
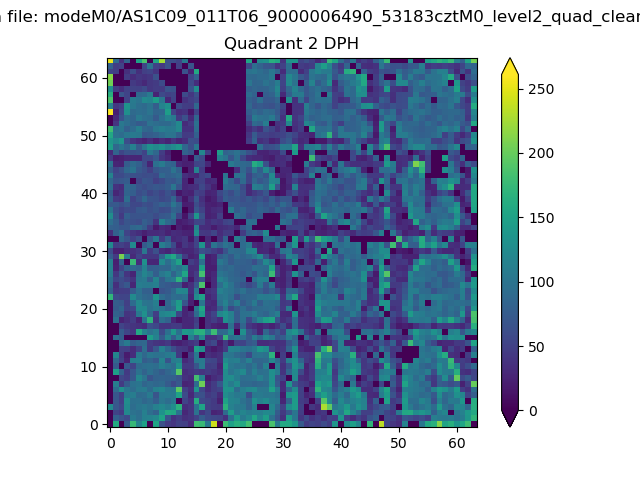 |
Quadrant C |
| Plot type | Count rate plots | Images |
|---|---|---|
| Comparison with Poisson distribution Blue bars denote a histogram of data divided into 1 sec bins. Red curve is a Poisson curve with rate = median count rate of data. |
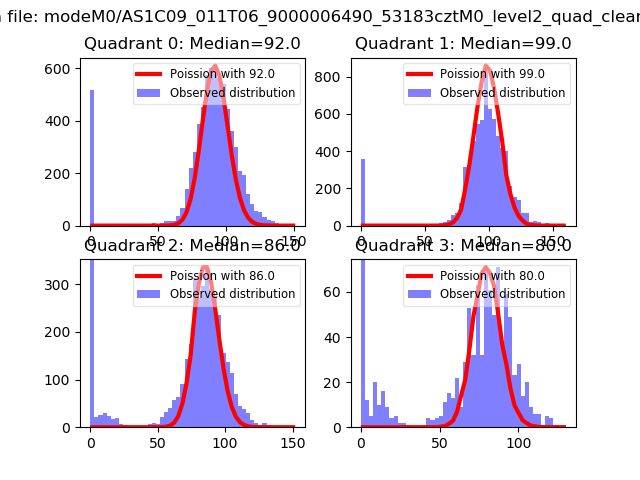 |
 |
| Quadrant-wise count rates Data is divided into 100 sec bins |
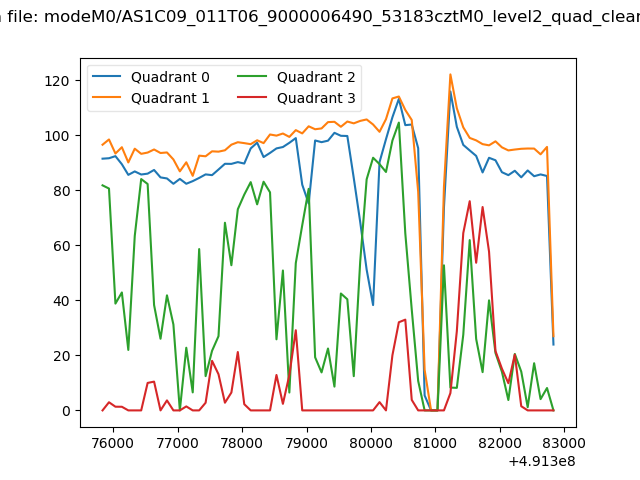 |
|
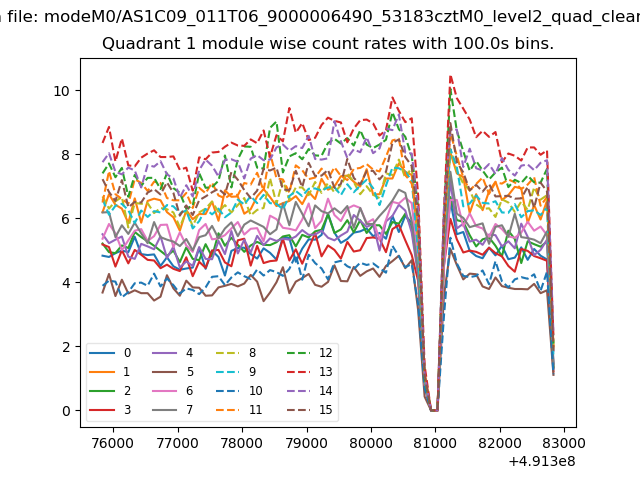
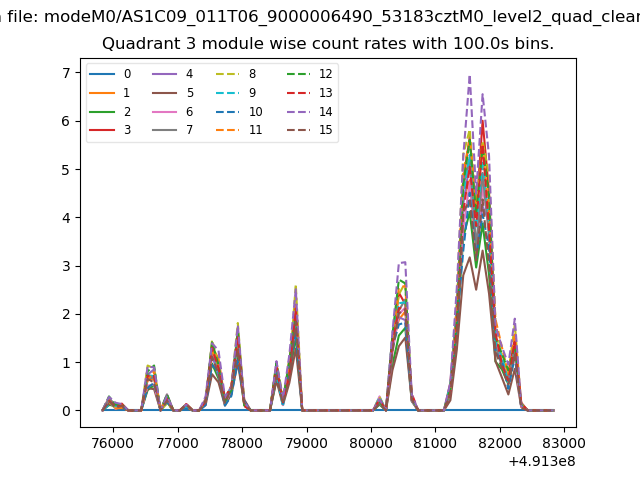
| Module-wise count rates for Quadrant A Data is divided into 100 sec bins |
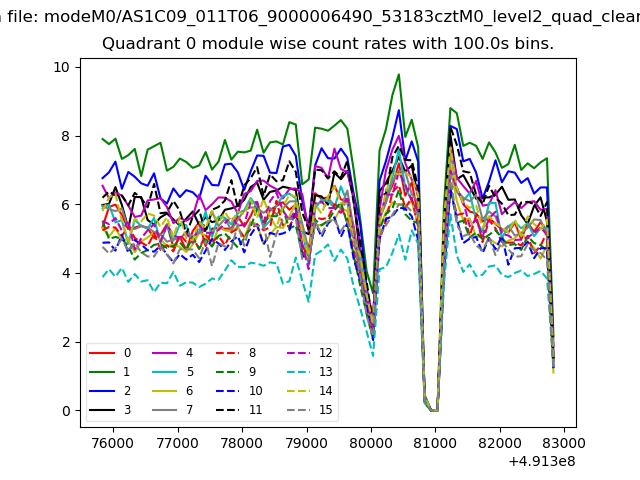 |
 |
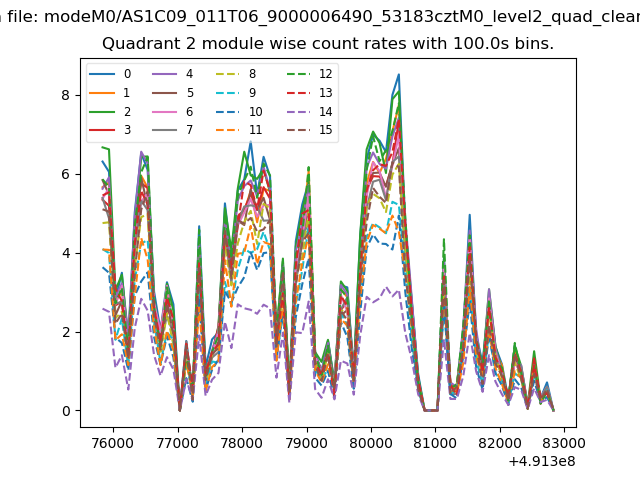
| Module-wise count rates for Quadrant B Data is divided into 100 sec bins |
 |
 |
| Module-wise count rates for Quadrant C Data is divided into 100 sec bins |
 |
 |
| Module-wise count rates for Quadrant D Data is divided into 100 sec bins |
 |
 |
| Parameter | Plot |
|---|---|
| CZT HV Monitor | 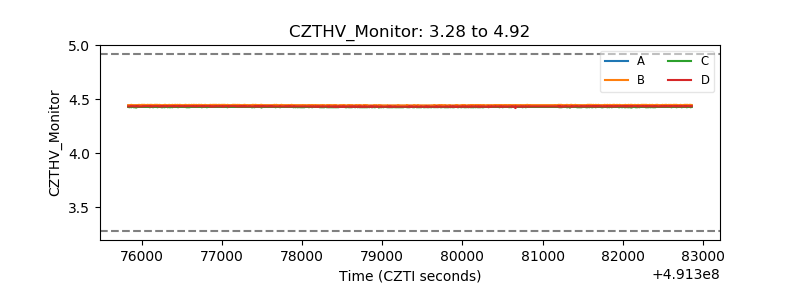 |
| D_VDD | 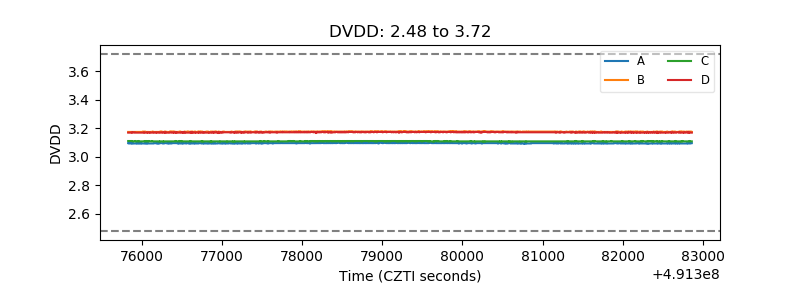 |
| Temperature 1 | 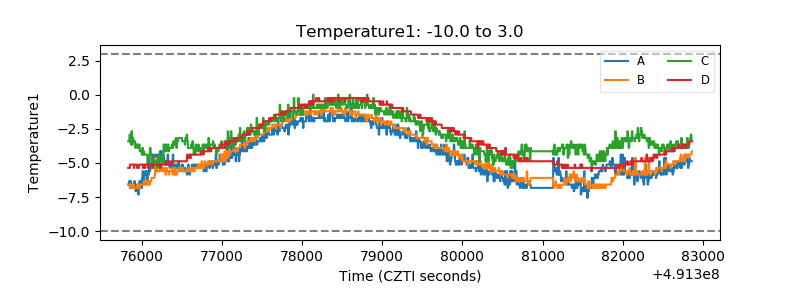 |
| Veto HV Monitor | 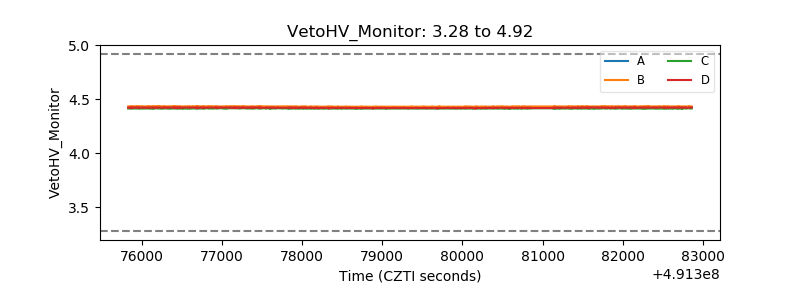 |
| Veto LLD | 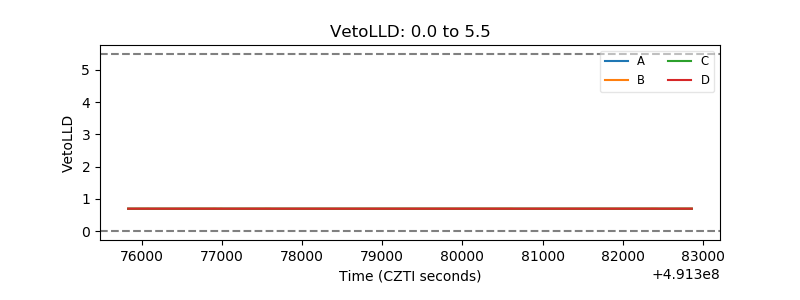 |
| Alpha Counter | 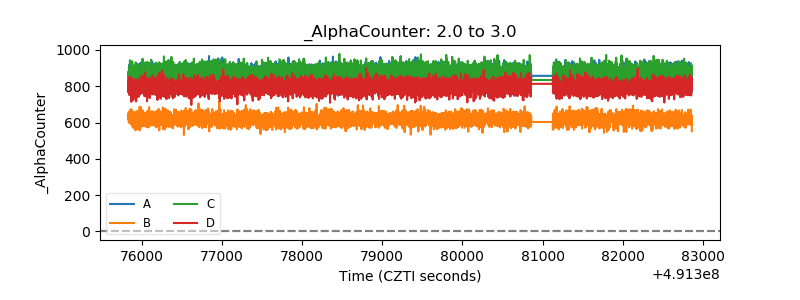 |
| _CPM_Rate | 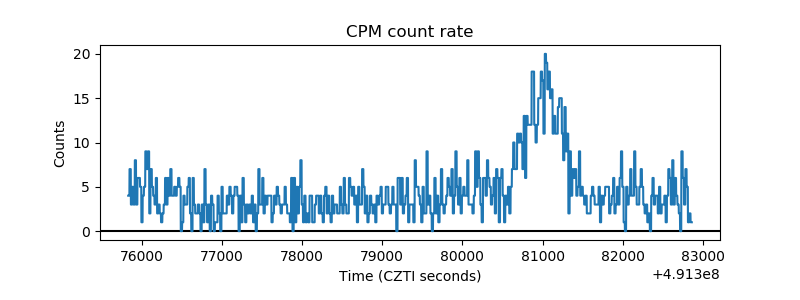 |
| CZT Counter | 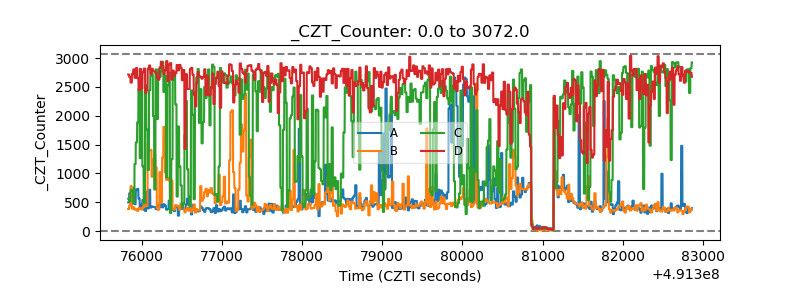 |
| +2.5 Volts monitor |  |
| +5 Volts monitor |  |
| _ROLL_ROT | 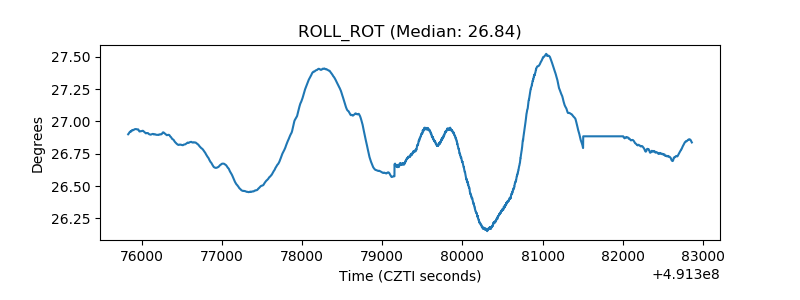 |
| _Roll_DEC | 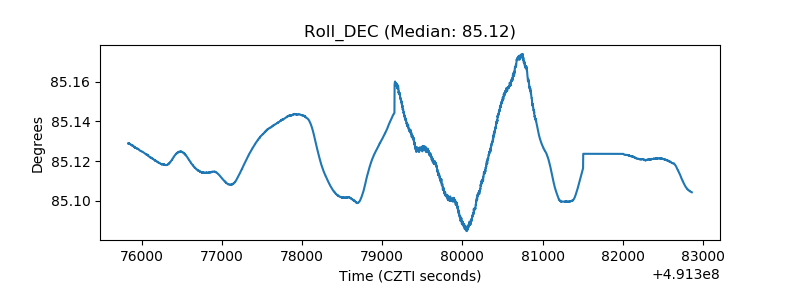 |
| _Roll_RA | 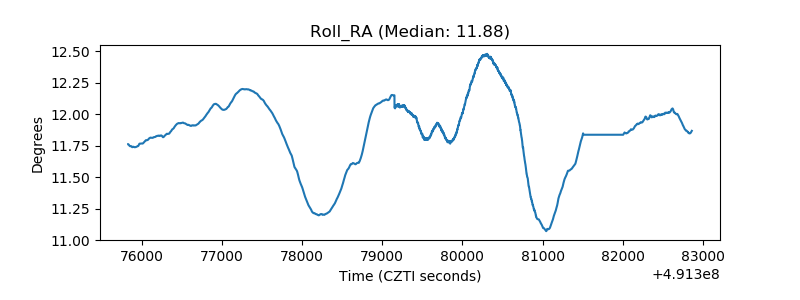 |
| Veto Counter | 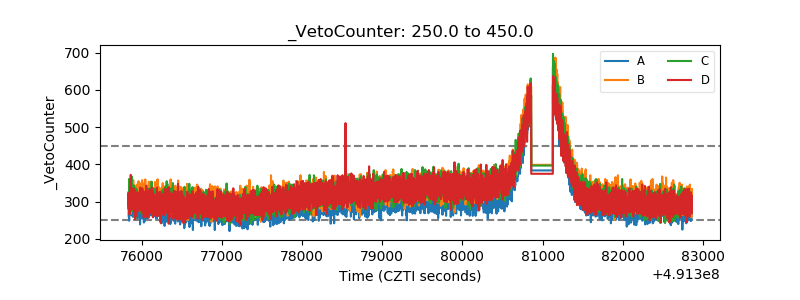 |