| Param | Original file | Final file |
|---|---|---|
| Filename | modeM0/AS1C09_011T06_9000006490_53184cztM0_level2.fits | modeM0/AS1C09_011T06_9000006490_53184cztM0_level2_quad_clean.evt |
| Size (bytes) | 1,060,672,320 | 75,983,040 |
| Size | 1011.5 MB | 72.5 MB |
| Events in quadrant A | 5,592,467 | 628,708 |
| Events in quadrant B | 4,160,555 | 687,973 |
| Events in quadrant C | 10,331,239 | 451,059 |
| Events in quadrant D | 18,625,172 | 34,095 |
| Mode SS | |||
|---|---|---|---|
| Quadrant | BADHDUFLAG | Total packets | Discarded packets |
| A | 0 | 144 | 0 |
| B | 0 | 144 | 0 |
| C | 0 | 144 | 0 |
| D | 0 | 144 | 0 |
| Mode M0 | |||
|---|---|---|---|
| Quadrant | BADHDUFLAG | Total packets | Discarded packets |
| A | 0 | 21911 | 0 |
| B | 0 | 17636 | 0 |
| C | 0 | 35629 | 0 |
| D | 0 | 60304 | 4 |
| Quadrant | Total seconds | Saturated seconds | Saturation percentage |
|---|---|---|---|
| A | 7156 | 473 | 6.609838% |
| B | 7156 | 307 | 4.290106% |
| C | 7157 | 2301 | 32.150342% |
| D | 7156 | 6827 | 95.402459% |
Noise dominated data is calculated using 1-second bins in cleaned event files. If a bin has >2000 counts, and if more than 50% of those come from <1% of pixels, then it is considered to be noise-dominated and hence unusable.
| Quadrant | # 1 sec bins | Bins with >0 counts | Bins with >2000 counts | High rate bins dominated by noise | Noise dominated (total time) | Noise dominated (detector-on time) | Marked lightcurve |
|---|---|---|---|---|---|---|---|
| A | 7156 | 7156 | 376 | 376 | 5.25% | 5.25% | 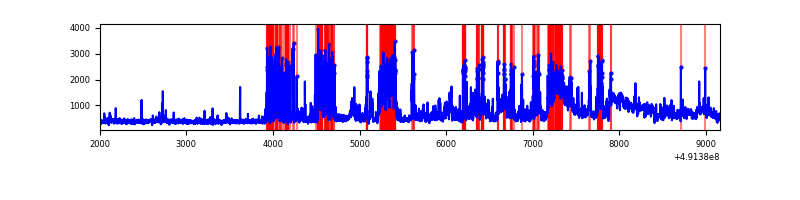 |
| B | 7156 | 7156 | 244 | 244 | 3.41% | 3.41% | 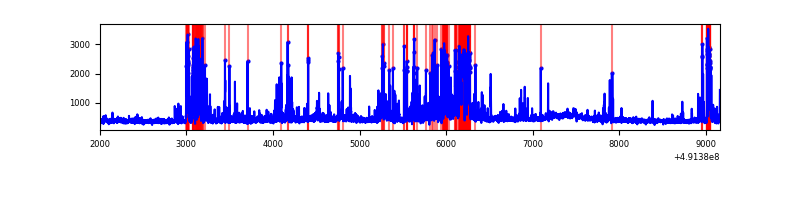 |
| C | 7157 | 7157 | 2287 | 2287 | 31.95% | 31.95% | 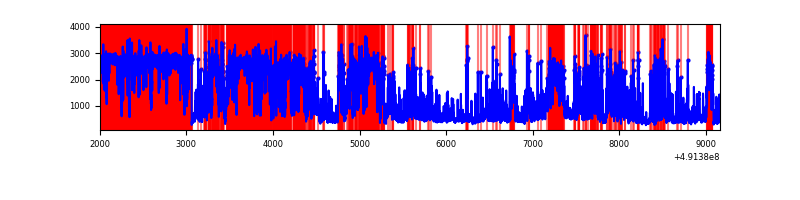 |
| D | 7156 | 7156 | 6837 | 6837 | 95.54% | 95.54% | 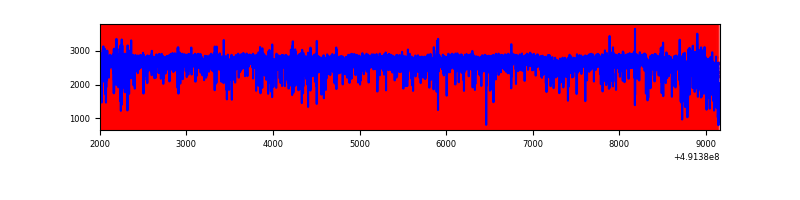 |
Top three noisy pixels from each quadrant. If the there are fewer than three noisy pixels in the level2.evt file, extra rows are filled as -1
| Pixel properties | Quadrant properties | ||||||
|---|---|---|---|---|---|---|---|
| Quadrant | DetID | PixID | Counts | Sigma | Mean | Median | Sigma |
| A | 12 | 80 | 902800 | 5120.28 | 709 | 688 | 176.2 |
| A | 7 | 206 | 650817 | 3690.05 | 709 | 688 | 176.2 |
| A | 3 | 62 | 531929 | 3015.26 | 709 | 688 | 176.2 |
| B | 2 | 249 | 794678 | 5262.16 | 707 | 682 | 150.9 |
| B | 7 | 128 | 134574 | 887.36 | 707 | 682 | 150.9 |
| B | 5 | 185 | 82618 | 543.03 | 707 | 682 | 150.9 |
| C | 0 | 240 | 3153681 | 18811.13 | 609 | 604 | 167.6 |
| C | 1 | 241 | 2393121 | 14273.66 | 609 | 604 | 167.6 |
| C | 15 | 224 | 1588299 | 9472.13 | 609 | 604 | 167.6 |
| D | 15 | 125 | 15854926 | 180623.04 | 297 | 282 | 87.8 |
| D | 3 | 12 | 953709 | 10861.86 | 297 | 282 | 87.8 |
| D | 2 | 62 | 151809 | 1726.26 | 297 | 282 | 87.8 |
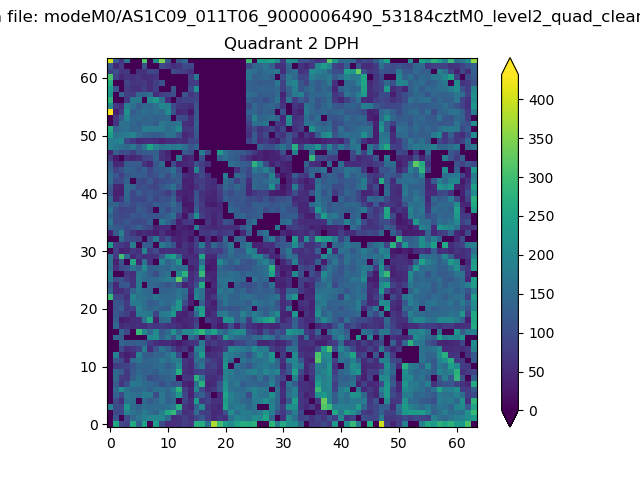
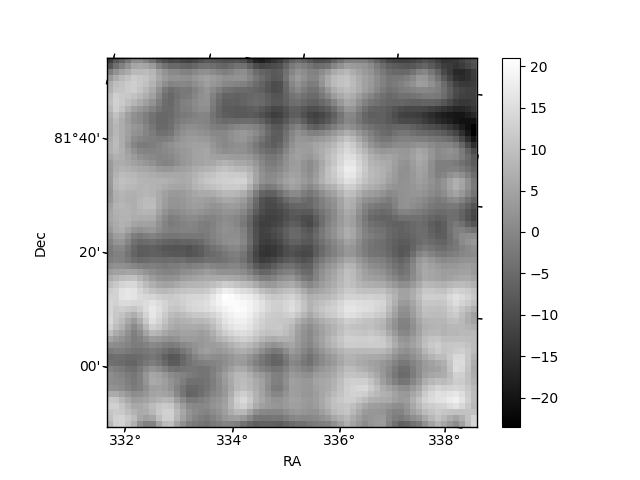
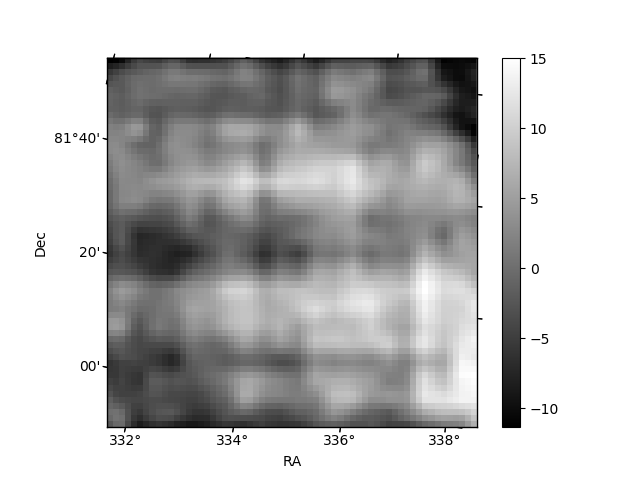
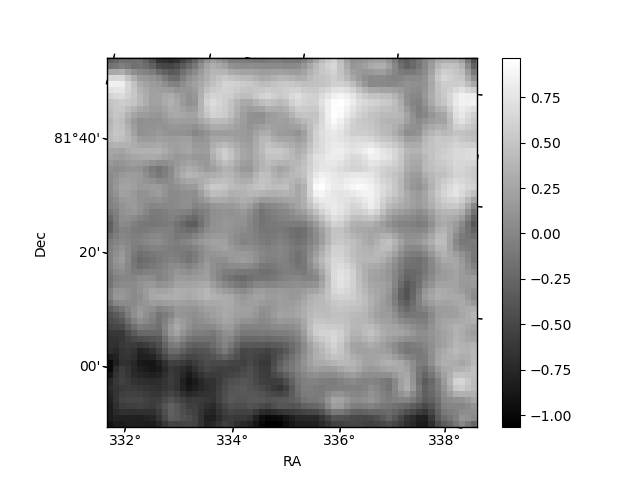
Histogram calculated using DETX and DETY for each event in the final _common_clean file
| Quadrant A | 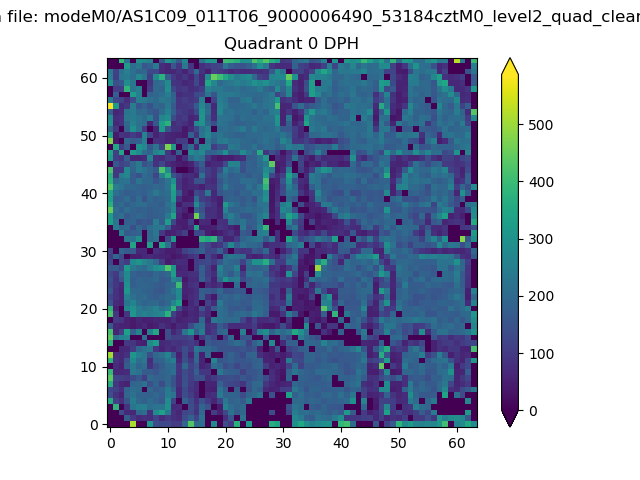 |
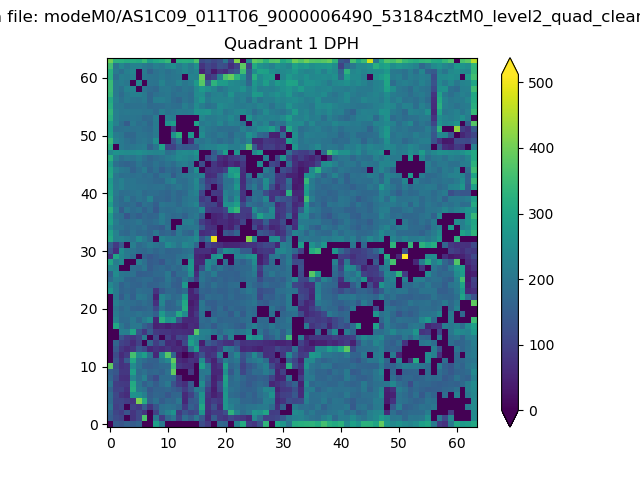 |
Quadrant B |
|---|---|---|---|
| Quadrant D | 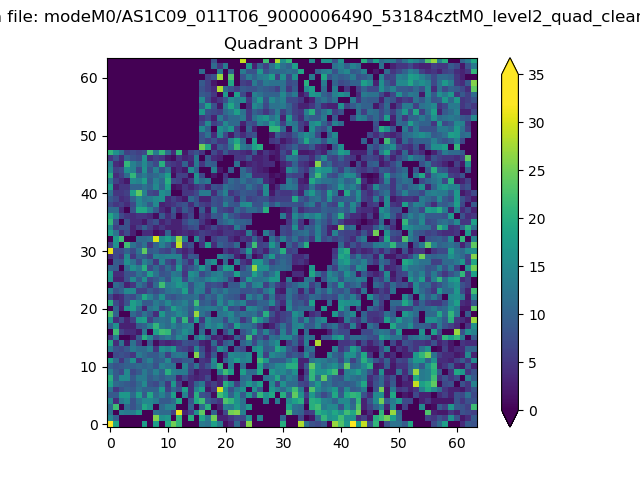 |
 |
Quadrant C |
| Plot type | Count rate plots | Images |
|---|---|---|
| Comparison with Poisson distribution Blue bars denote a histogram of data divided into 1 sec bins. Red curve is a Poisson curve with rate = median count rate of data. |
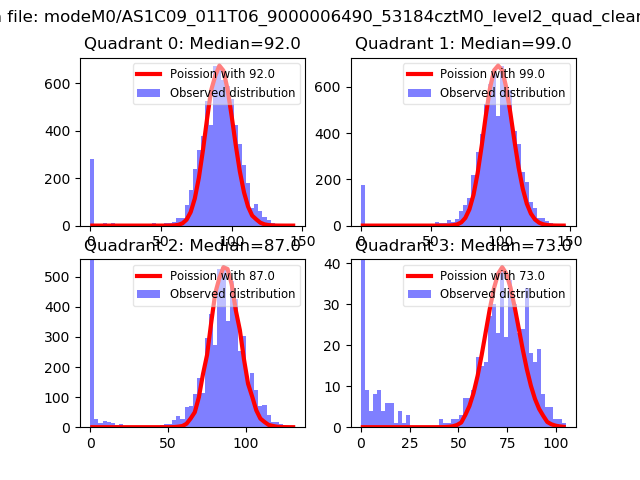 |
 |
| Quadrant-wise count rates Data is divided into 100 sec bins |
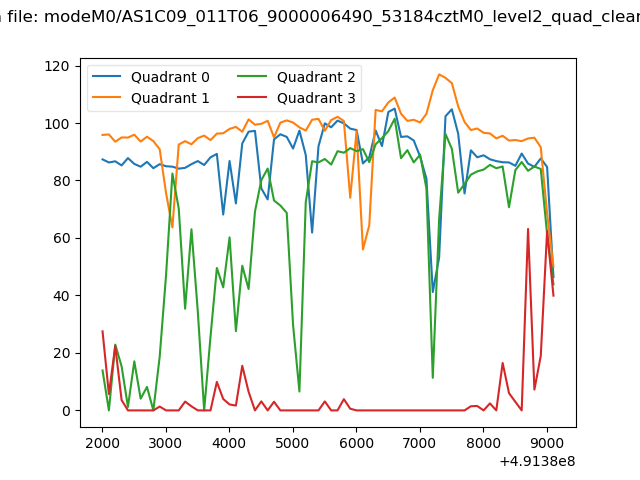 |
|
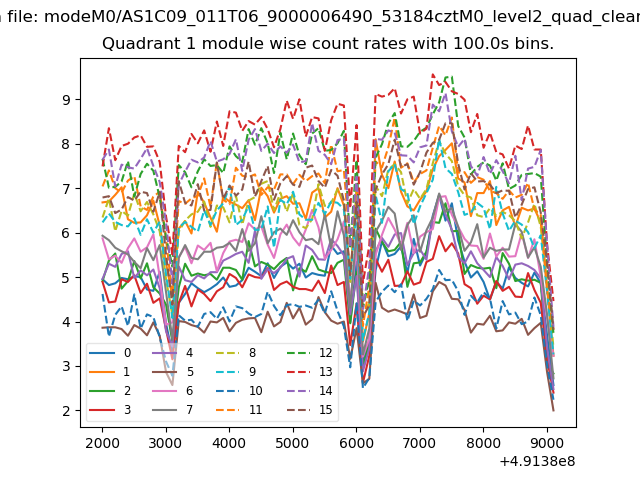
| Module-wise count rates for Quadrant A Data is divided into 100 sec bins |
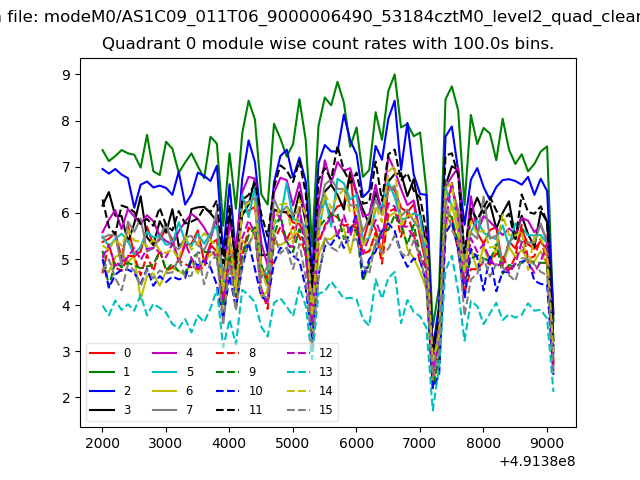 |
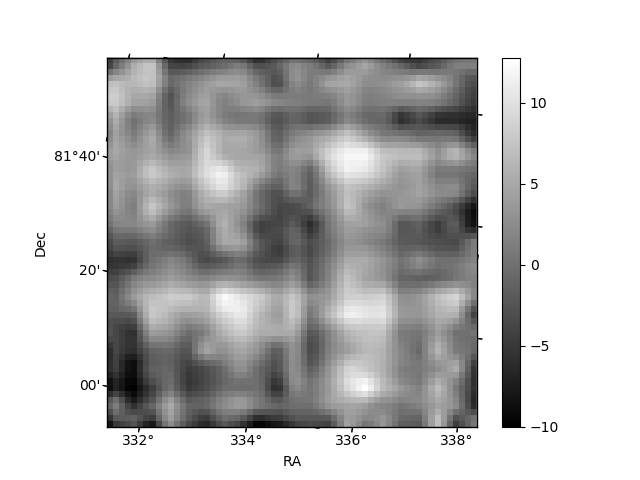 |
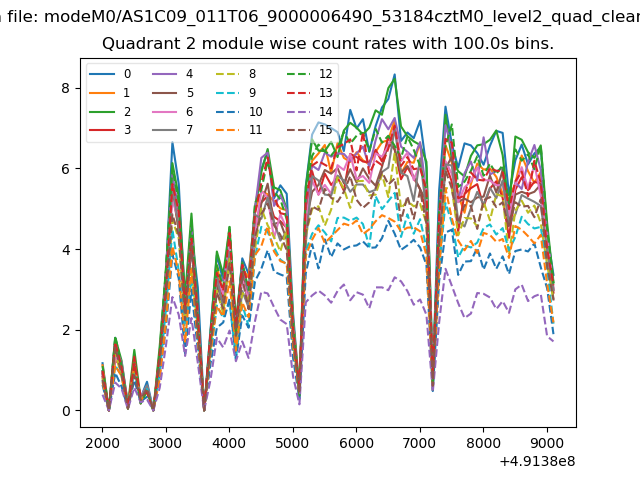
| Module-wise count rates for Quadrant B Data is divided into 100 sec bins |
 |
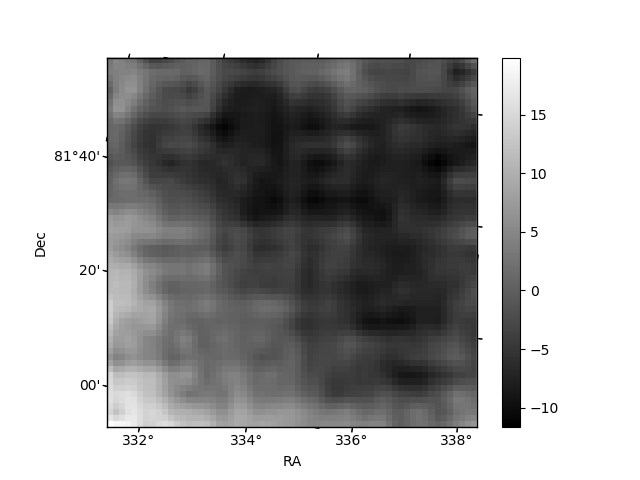 |
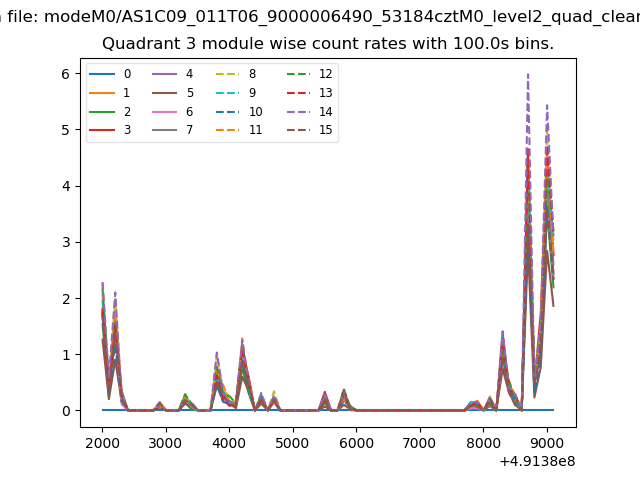
| Module-wise count rates for Quadrant C Data is divided into 100 sec bins |
 |
 |
| Module-wise count rates for Quadrant D Data is divided into 100 sec bins |
 |
 |
| Parameter | Plot |
|---|---|
| CZT HV Monitor | 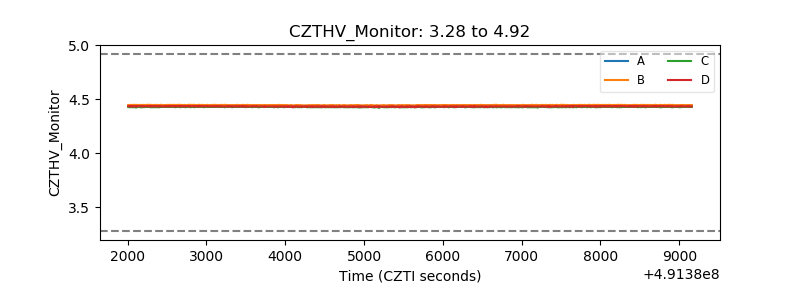 |
| D_VDD | 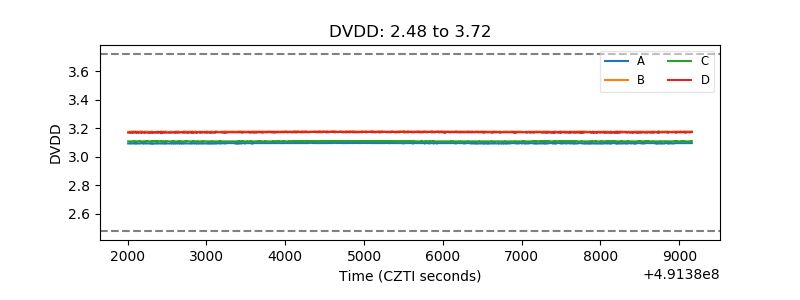 |
| Temperature 1 | 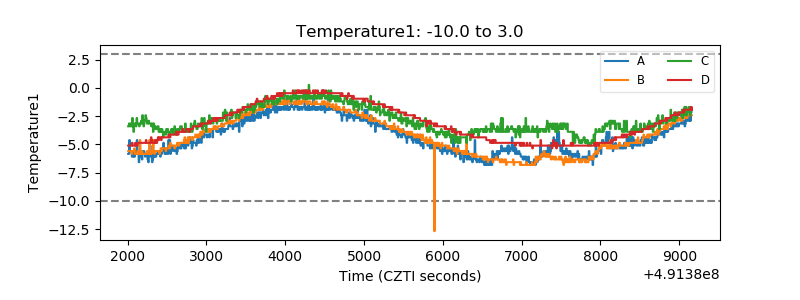 |
| Veto HV Monitor | 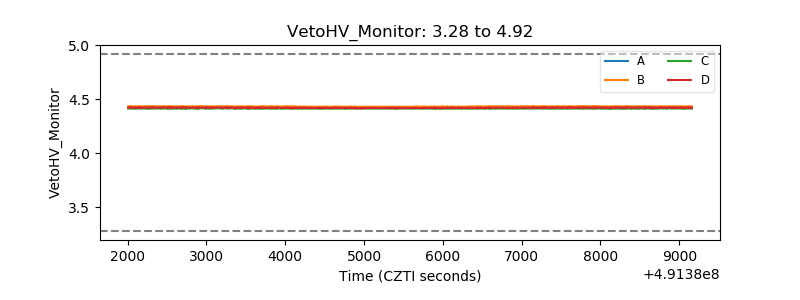 |
| Veto LLD | 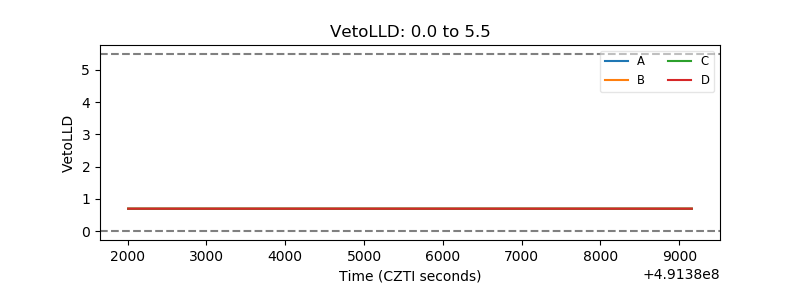 |
| Alpha Counter | 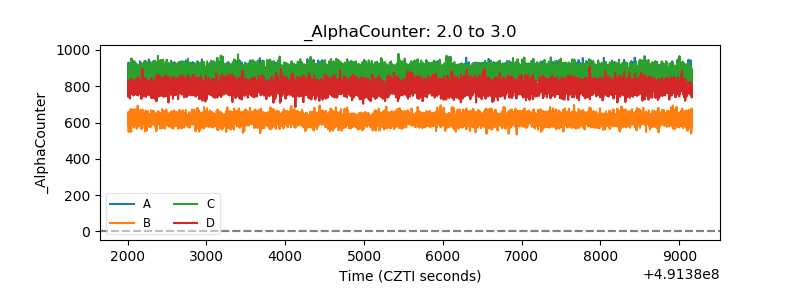 |
| _CPM_Rate | 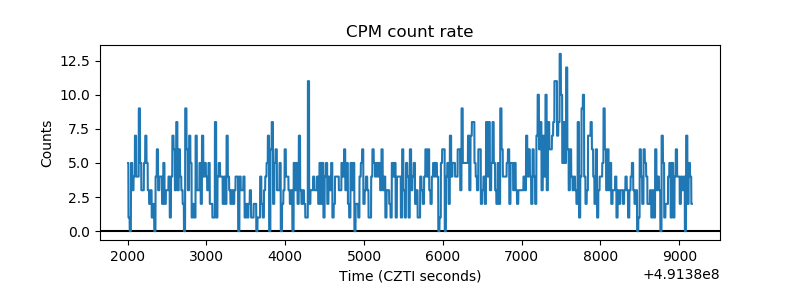 |
| CZT Counter | 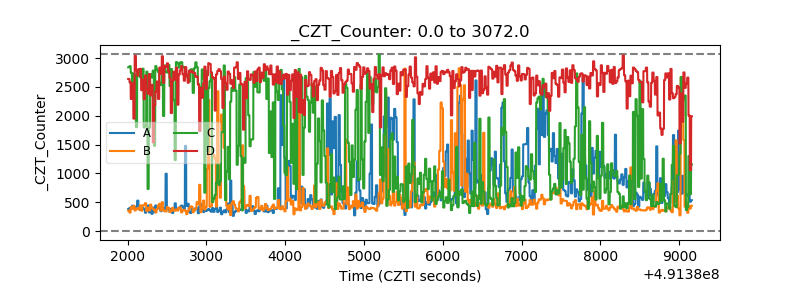 |
| +2.5 Volts monitor | 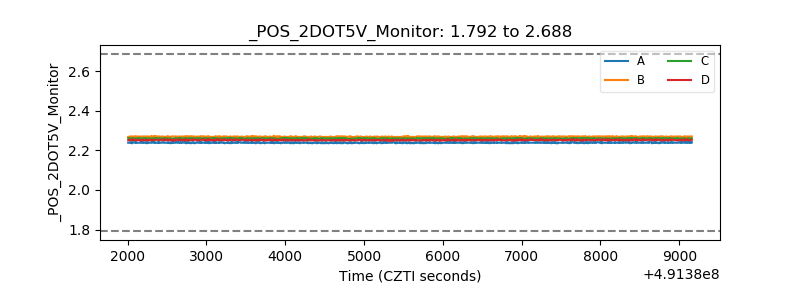 |
| +5 Volts monitor |  |
| _ROLL_ROT | 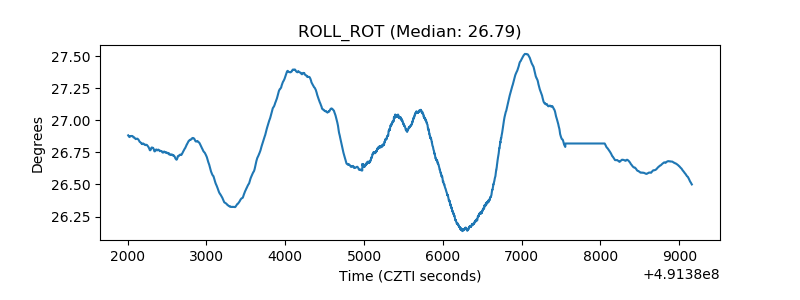 |
| _Roll_DEC | 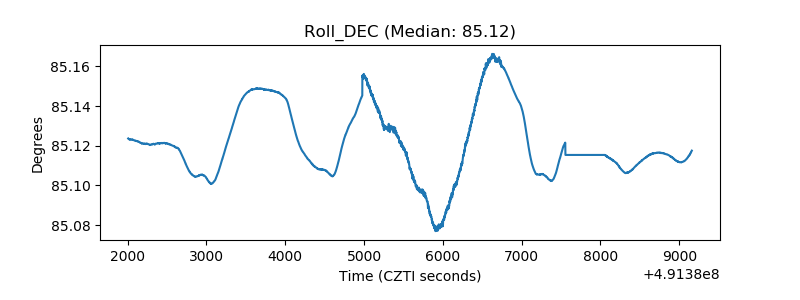 |
| _Roll_RA | 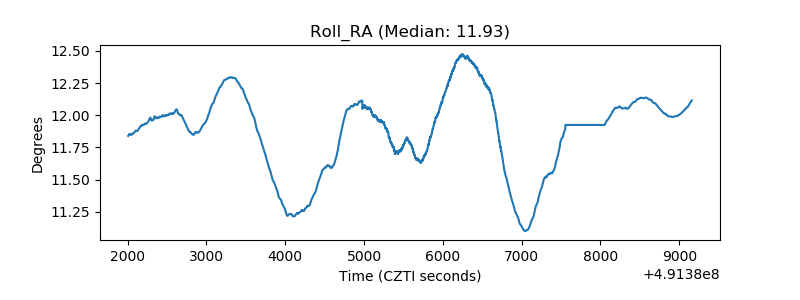 |
| Veto Counter | 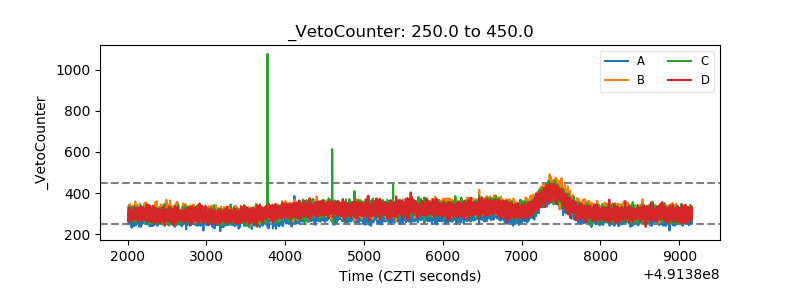 |