| Param | Original file | Final file |
|---|---|---|
| Filename | modeM0/AS1C09_011T06_9000006490_53185cztM0_level2.fits | modeM0/AS1C09_011T06_9000006490_53185cztM0_level2_quad_clean.evt |
| Size (bytes) | 1,003,570,560 | 83,678,400 |
| Size | 957.1 MB | 79.8 MB |
| Events in quadrant A | 5,839,308 | 660,750 |
| Events in quadrant B | 5,917,610 | 648,487 |
| Events in quadrant C | 6,545,959 | 602,004 |
| Events in quadrant D | 18,276,591 | 109,096 |
| Mode SS | |||
|---|---|---|---|
| Quadrant | BADHDUFLAG | Total packets | Discarded packets |
| A | 0 | 148 | 0 |
| B | 0 | 148 | 0 |
| C | 0 | 148 | 0 |
| D | 0 | 148 | 0 |
| Mode M0 | |||
|---|---|---|---|
| Quadrant | BADHDUFLAG | Total packets | Discarded packets |
| A | 0 | 22463 | 0 |
| B | 0 | 22953 | 0 |
| C | 0 | 24645 | 0 |
| D | 0 | 59400 | 0 |
| Quadrant | Total seconds | Saturated seconds | Saturation percentage |
|---|---|---|---|
| A | 7364 | 283 | 3.843020% |
| B | 7365 | 999 | 13.564155% |
| C | 7365 | 637 | 8.649016% |
| D | 7365 | 6292 | 85.431093% |
Noise dominated data is calculated using 1-second bins in cleaned event files. If a bin has >2000 counts, and if more than 50% of those come from <1% of pixels, then it is considered to be noise-dominated and hence unusable.
| Quadrant | # 1 sec bins | Bins with >0 counts | Bins with >2000 counts | High rate bins dominated by noise | Noise dominated (total time) | Noise dominated (detector-on time) | Marked lightcurve |
|---|---|---|---|---|---|---|---|
| A | 7364 | 7364 | 252 | 252 | 3.42% | 3.42% | 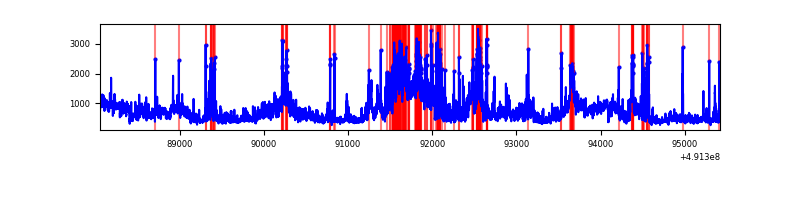 |
| B | 7365 | 7365 | 764 | 764 | 10.37% | 10.37% | 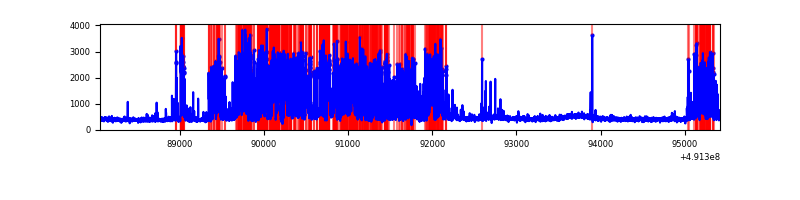 |
| C | 7365 | 7365 | 567 | 567 | 7.70% | 7.70% | 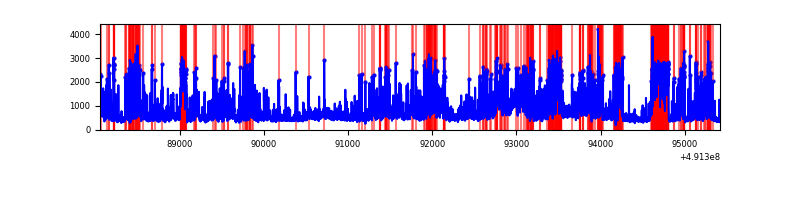 |
| D | 7365 | 7365 | 6392 | 6392 | 86.79% | 86.79% | 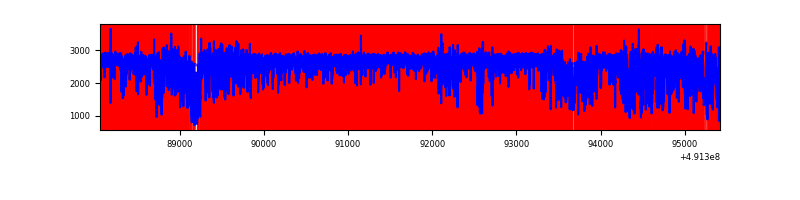 |
Top three noisy pixels from each quadrant. If the there are fewer than three noisy pixels in the level2.evt file, extra rows are filled as -1
| Pixel properties | Quadrant properties | ||||||
|---|---|---|---|---|---|---|---|
| Quadrant | DetID | PixID | Counts | Sigma | Mean | Median | Sigma |
| A | 12 | 80 | 1748510 | 9564.53 | 737 | 719 | 182.7 |
| A | 0 | 8 | 274340 | 1497.35 | 737 | 719 | 182.7 |
| A | 7 | 206 | 267313 | 1458.9 | 737 | 719 | 182.7 |
| B | 2 | 249 | 2724923 | 18335.05 | 696 | 672 | 148.6 |
| B | 10 | 247 | 92462 | 617.77 | 696 | 672 | 148.6 |
| B | 10 | 28 | 70979 | 473.19 | 696 | 672 | 148.6 |
| C | 15 | 224 | 1819070 | 9747.53 | 687 | 683 | 186.5 |
| C | 4 | 5 | 795763 | 4262.06 | 687 | 683 | 186.5 |
| C | 10 | 22 | 220316 | 1177.35 | 687 | 683 | 186.5 |
| D | 15 | 125 | 15425193 | 138579.58 | 383 | 364 | 111.3 |
| D | 3 | 12 | 570802 | 5124.92 | 383 | 364 | 111.3 |
| D | 1 | 0 | 139359 | 1248.76 | 383 | 364 | 111.3 |
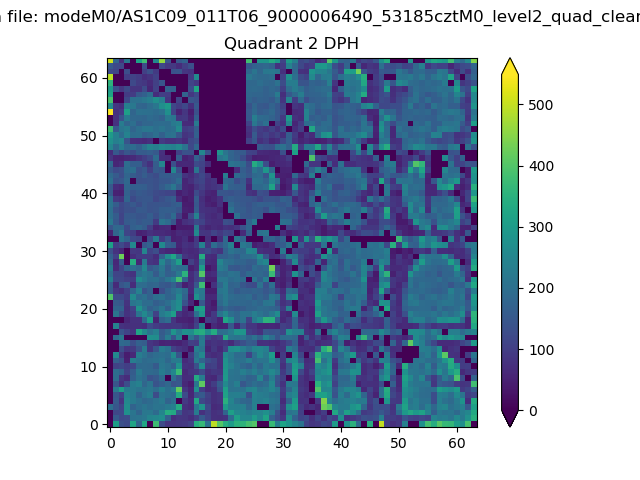
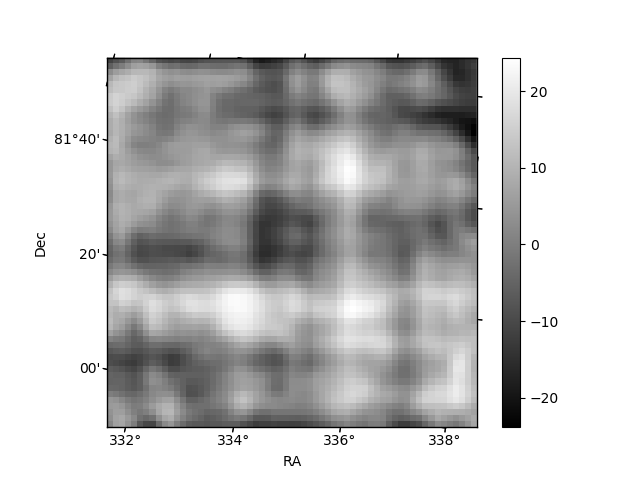
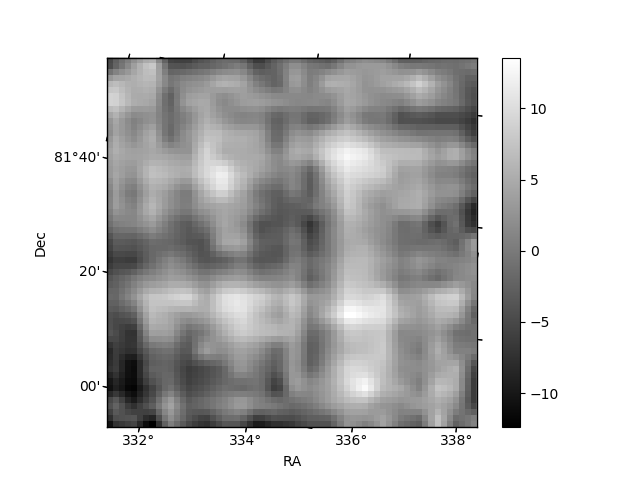
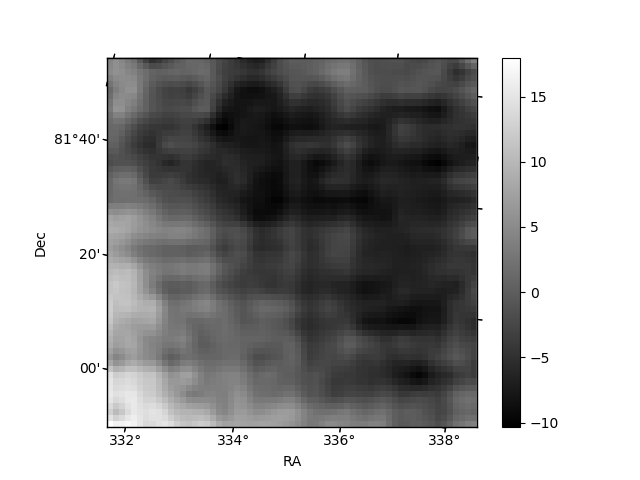
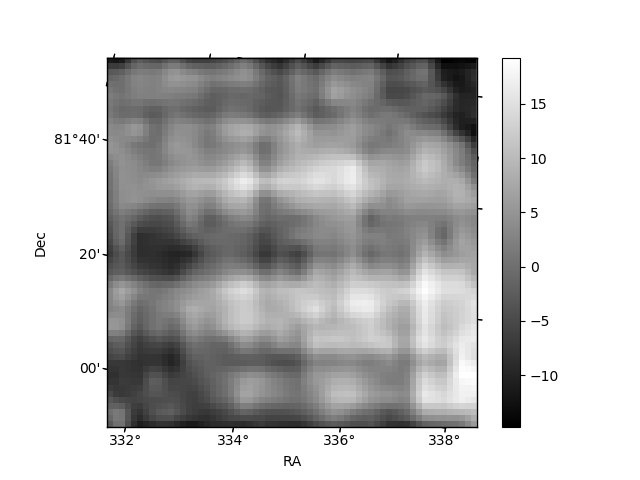
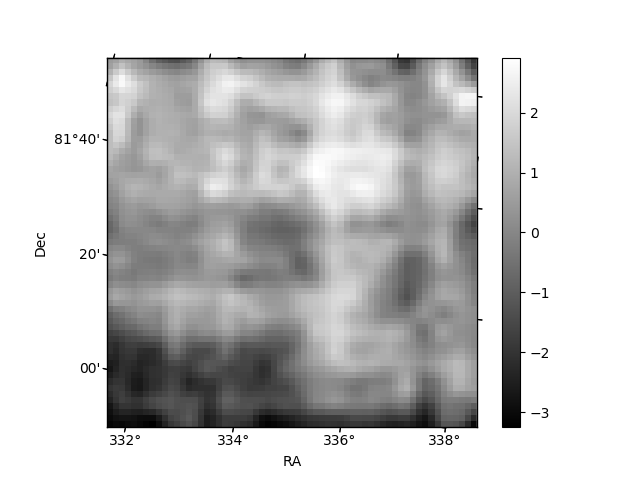
Histogram calculated using DETX and DETY for each event in the final _common_clean file
| Quadrant A | 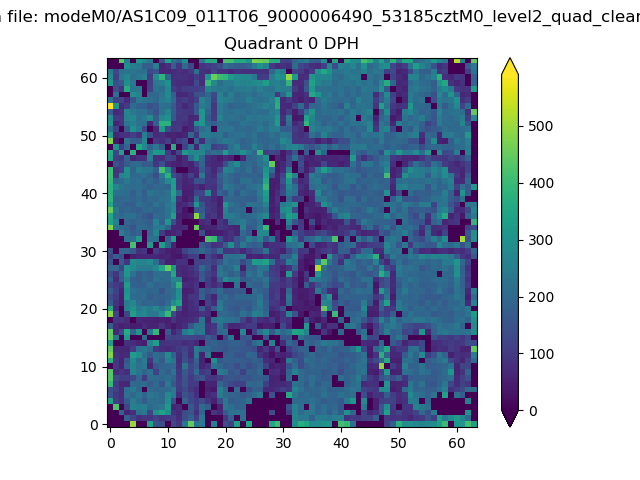 |
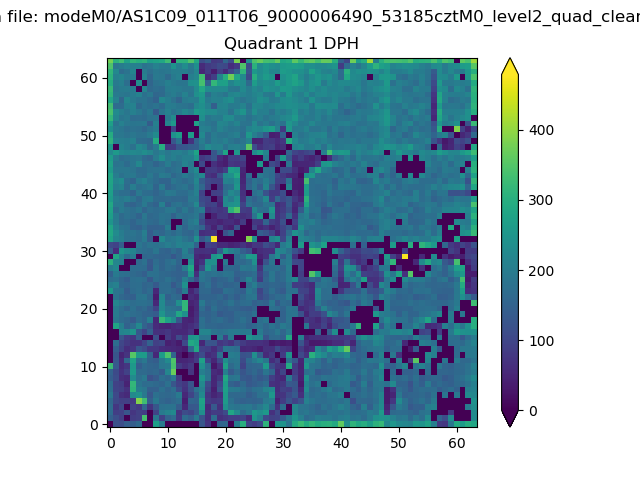 |
Quadrant B |
|---|---|---|---|
| Quadrant D | 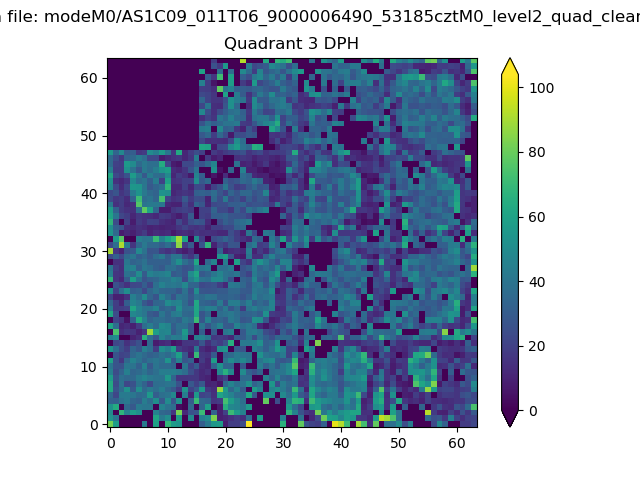 |
 |
Quadrant C |
| Plot type | Count rate plots | Images |
|---|---|---|
| Comparison with Poisson distribution Blue bars denote a histogram of data divided into 1 sec bins. Red curve is a Poisson curve with rate = median count rate of data. |
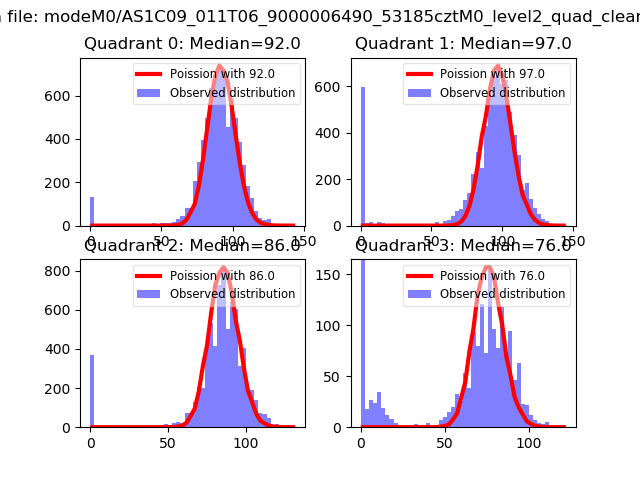 |
 |
| Quadrant-wise count rates Data is divided into 100 sec bins |
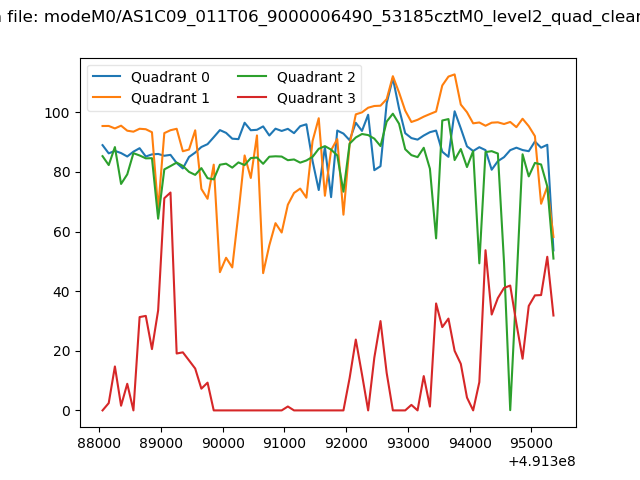 |
|
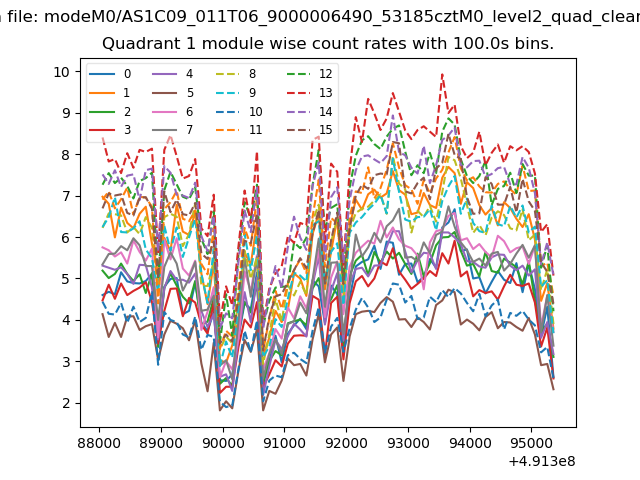
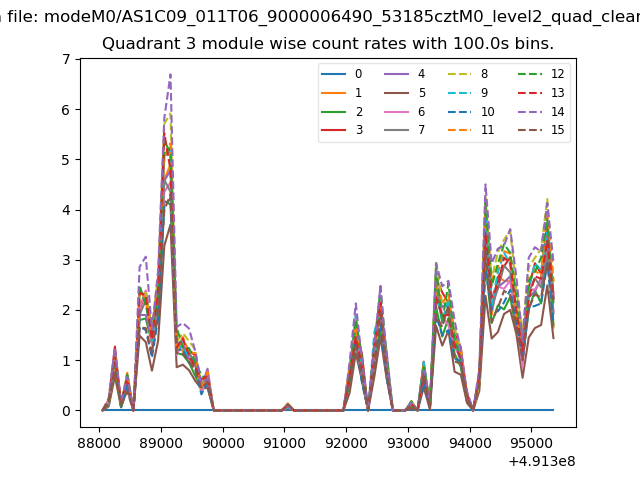
| Module-wise count rates for Quadrant A Data is divided into 100 sec bins |
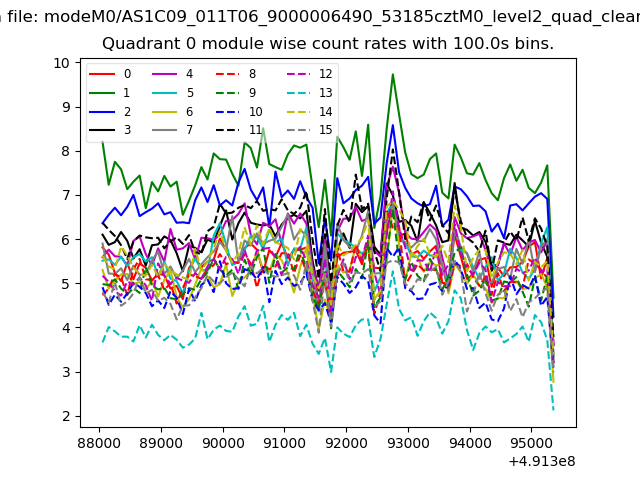 |
 |
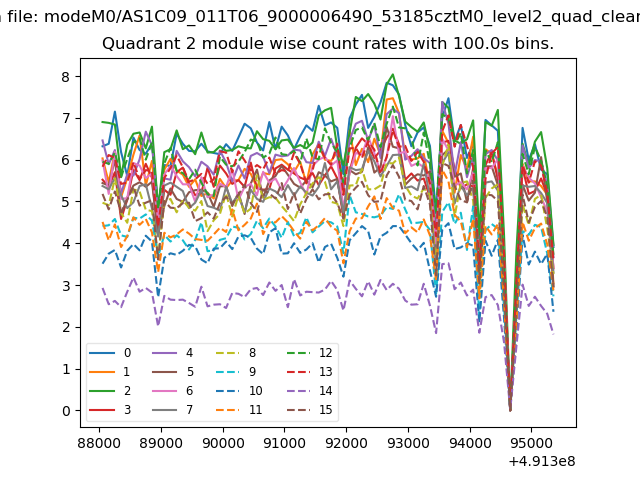
| Module-wise count rates for Quadrant B Data is divided into 100 sec bins |
 |
 |
| Module-wise count rates for Quadrant C Data is divided into 100 sec bins |
 |
 |
| Module-wise count rates for Quadrant D Data is divided into 100 sec bins |
 |
 |
| Parameter | Plot |
|---|---|
| CZT HV Monitor | 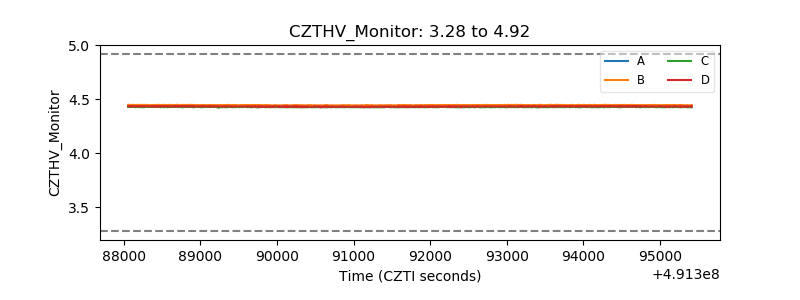 |
| D_VDD | 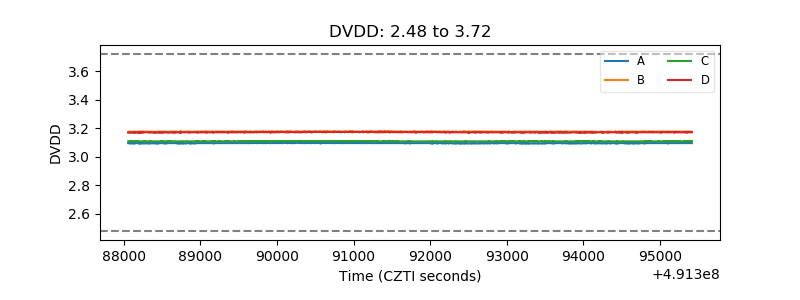 |
| Temperature 1 | 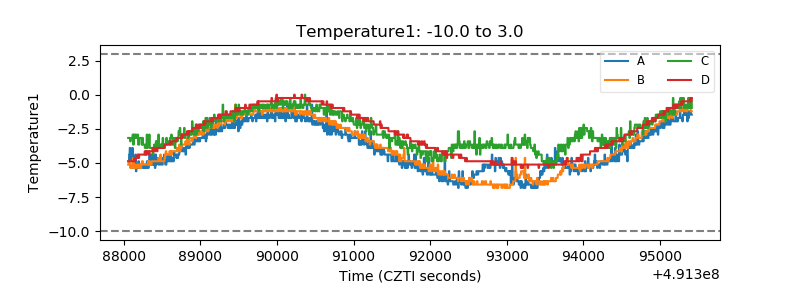 |
| Veto HV Monitor | 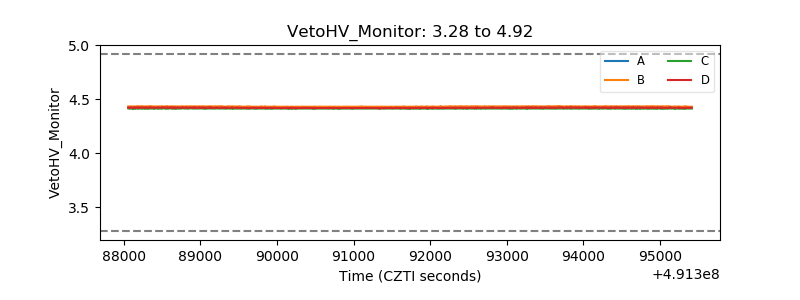 |
| Veto LLD | 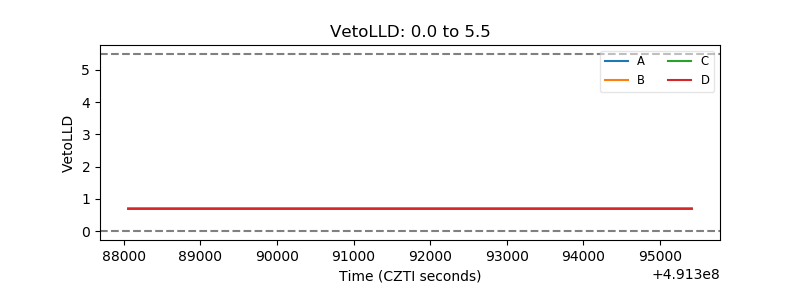 |
| Alpha Counter |  |
| _CPM_Rate | 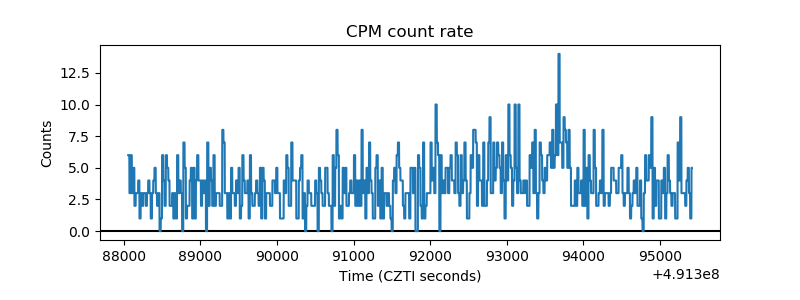 |
| CZT Counter | 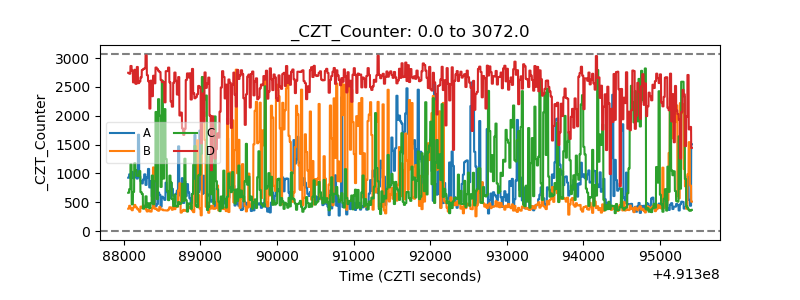 |
| +2.5 Volts monitor |  |
| +5 Volts monitor |  |
| _ROLL_ROT | 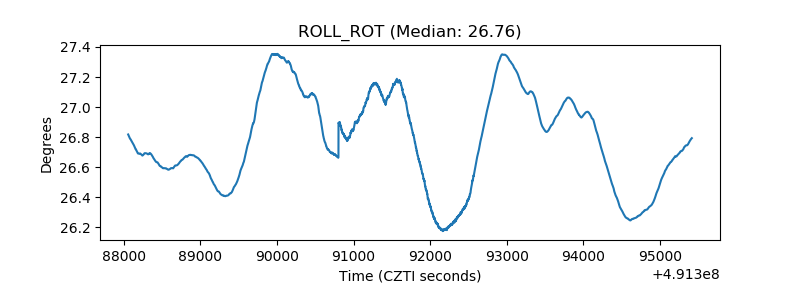 |
| _Roll_DEC | 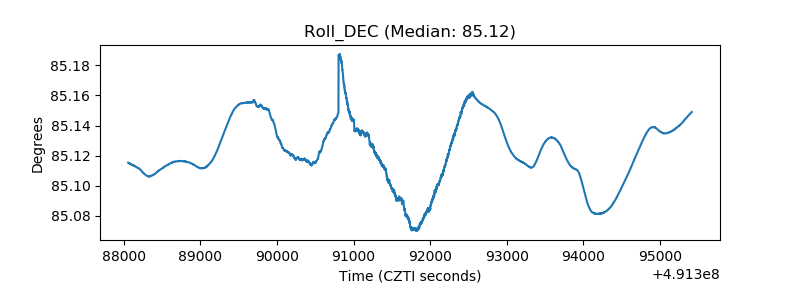 |
| _Roll_RA | 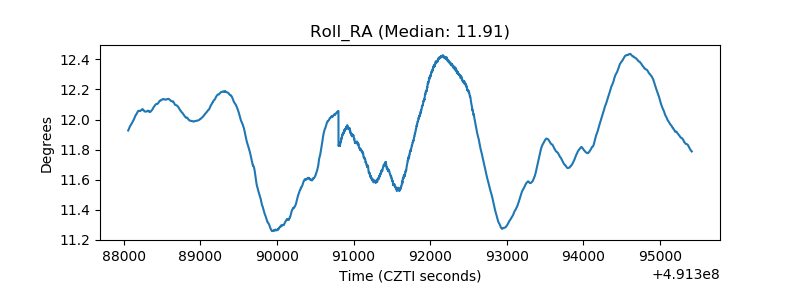 |
| Veto Counter | 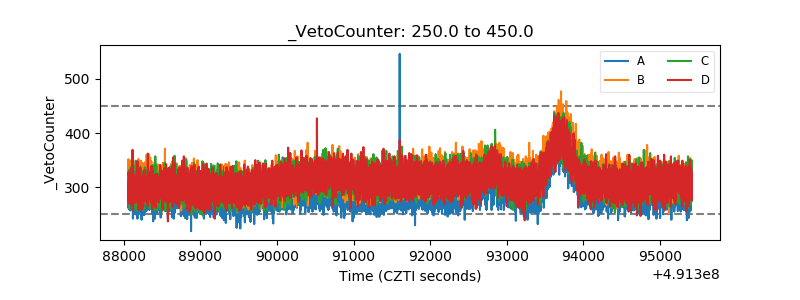 |