| Param | Original file | Final file |
|---|---|---|
| Filename | modeM0/AS1C09_011T06_9000006490_53188cztM0_level2.fits | modeM0/AS1C09_011T06_9000006490_53188cztM0_level2_quad_clean.evt |
| Size (bytes) | 2,599,482,240 | 206,040,960 |
| Size | 2.4 GB | 196.5 MB |
| Events in quadrant A | 11,757,865 | 1,711,184 |
| Events in quadrant B | 15,374,537 | 1,678,011 |
| Events in quadrant C | 19,388,575 | 1,409,021 |
| Events in quadrant D | 48,238,461 | 129,586 |
| Mode M9 | |||
|---|---|---|---|
| Quadrant | BADHDUFLAG | Total packets | Discarded packets |
| A | 0 | 10 | 0 |
| B | 0 | 10 | 0 |
| C | 0 | 10 | 0 |
| D | 0 | 10 | 0 |
| Mode SS | |||
|---|---|---|---|
| Quadrant | BADHDUFLAG | Total packets | Discarded packets |
| A | 0 | 384 | 0 |
| B | 0 | 384 | 0 |
| C | 0 | 384 | 0 |
| D | 0 | 384 | 0 |
| Mode M0 | |||
|---|---|---|---|
| Quadrant | BADHDUFLAG | Total packets | Discarded packets |
| A | 0 | 48291 | 2 |
| B | 0 | 59215 | 2 |
| C | 0 | 70928 | 2 |
| D | 0 | 156384 | 10 |
| Quadrant | Total seconds | Saturated seconds | Saturation percentage |
|---|---|---|---|
| A | 18999 | 703 | 3.700195% |
| B | 19000 | 2364 | 12.442105% |
| C | 19000 | 2877 | 15.142105% |
| D | 18999 | 17731 | 93.325965% |
Noise dominated data is calculated using 1-second bins in cleaned event files. If a bin has >2000 counts, and if more than 50% of those come from <1% of pixels, then it is considered to be noise-dominated and hence unusable.
| Quadrant | # 1 sec bins | Bins with >0 counts | Bins with >2000 counts | High rate bins dominated by noise | Noise dominated (total time) | Noise dominated (detector-on time) | Marked lightcurve |
|---|---|---|---|---|---|---|---|
| A | 19919 | 18999 | 527 | 527 | 2.65% | 2.77% | 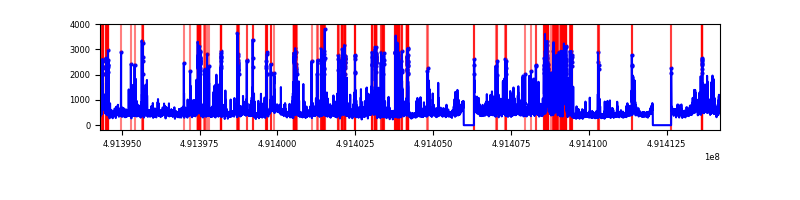 |
| B | 19920 | 19001 | 1705 | 1705 | 8.56% | 8.97% | 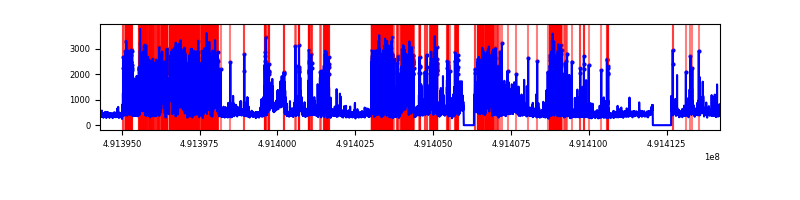 |
| C | 19920 | 19000 | 2471 | 2471 | 12.40% | 13.01% | 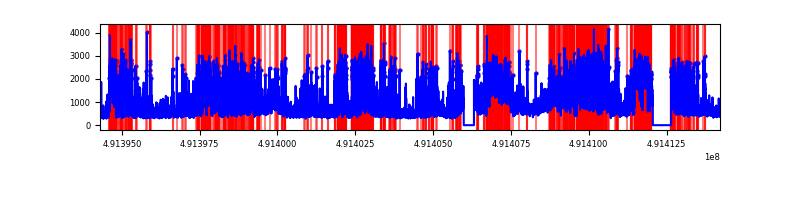 |
| D | 19918 | 18998 | 17356 | 17356 | 87.14% | 91.36% | 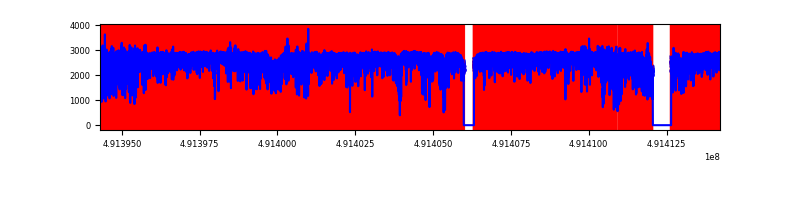 |
Top three noisy pixels from each quadrant. If the there are fewer than three noisy pixels in the level2.evt file, extra rows are filled as -1
| Pixel properties | Quadrant properties | ||||||
|---|---|---|---|---|---|---|---|
| Quadrant | DetID | PixID | Counts | Sigma | Mean | Median | Sigma |
| A | 7 | 206 | 1446594 | 2986.84 | 1967 | 1917 | 483.7 |
| A | 8 | 249 | 543793 | 1120.32 | 1967 | 1917 | 483.7 |
| A | 4 | 249 | 347994 | 715.51 | 1967 | 1917 | 483.7 |
| B | 2 | 249 | 4758510 | 12053.63 | 1875 | 1809 | 394.6 |
| B | 4 | 81 | 1630550 | 4127.28 | 1875 | 1809 | 394.6 |
| B | 10 | 28 | 440821 | 1112.47 | 1875 | 1809 | 394.6 |
| C | 10 | 22 | 3989450 | 7855.89 | 1824 | 1804 | 507.6 |
| C | 15 | 224 | 3232894 | 6365.43 | 1824 | 1804 | 507.6 |
| C | 0 | 240 | 1413970 | 2782.05 | 1824 | 1804 | 507.6 |
| D | 15 | 125 | 43302978 | 192540.37 | 778 | 741 | 224.9 |
| D | 11 | 245 | 460006 | 2042.09 | 778 | 741 | 224.9 |
| D | 2 | 249 | 223865 | 992.11 | 778 | 741 | 224.9 |
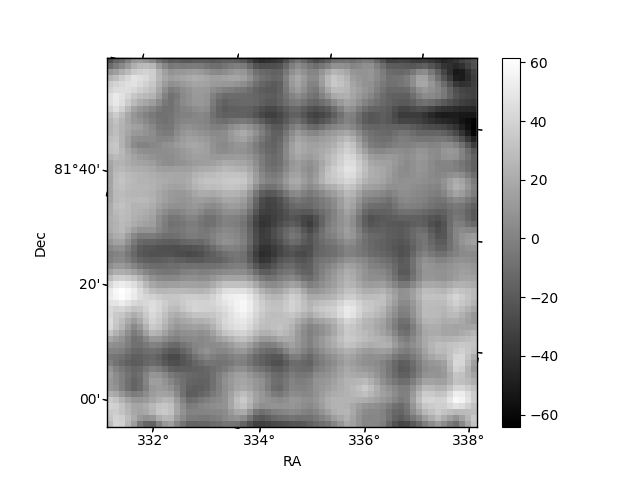
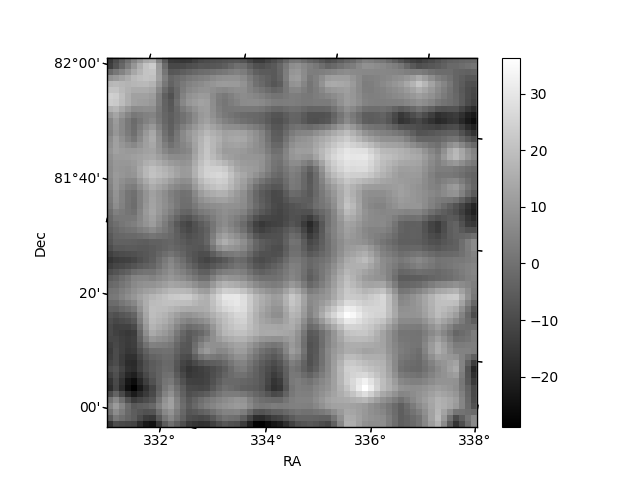
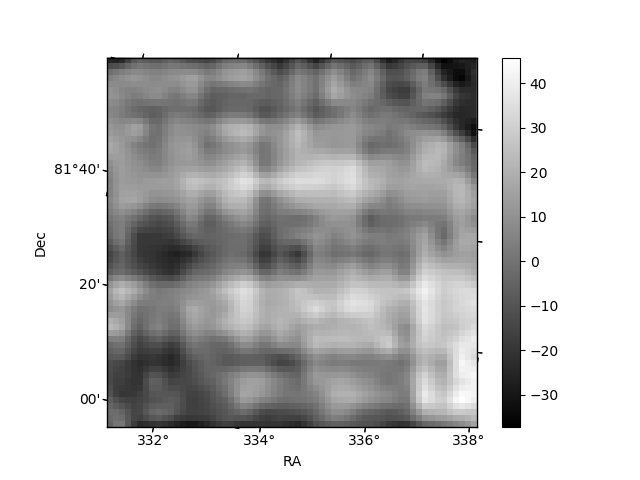
Histogram calculated using DETX and DETY for each event in the final _common_clean file
| Quadrant A | 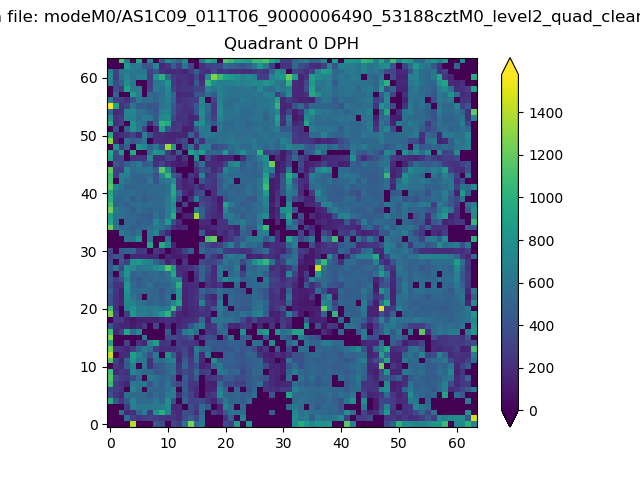 |
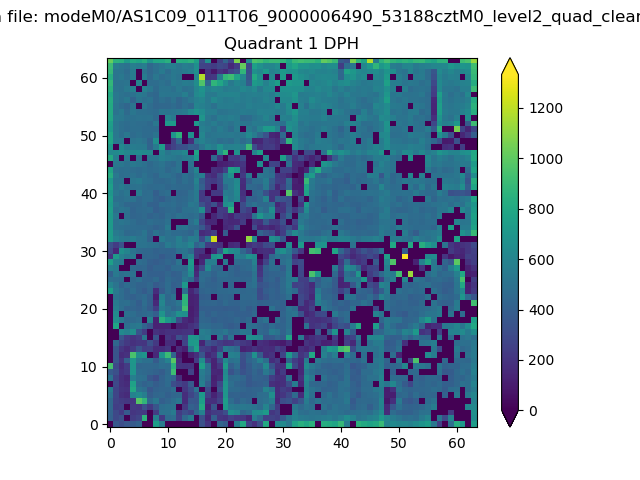 |
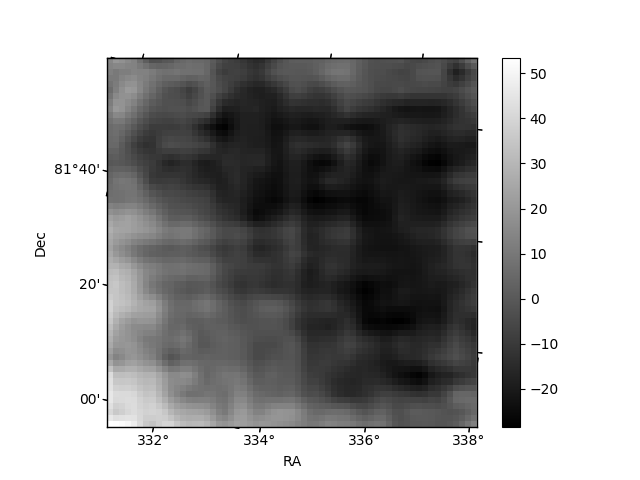
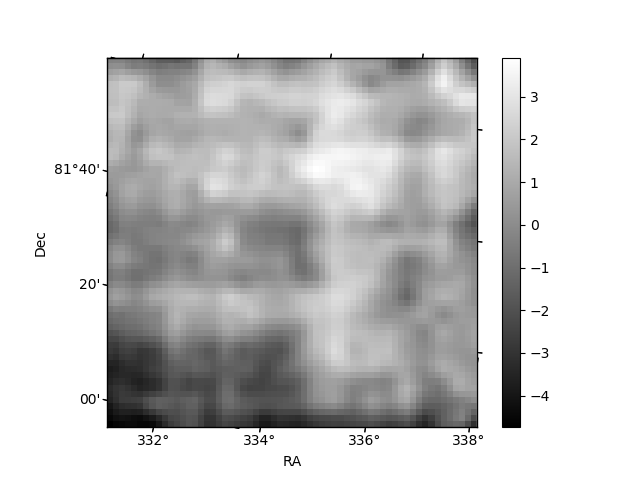
Quadrant B |
|---|---|---|---|
| Quadrant D | 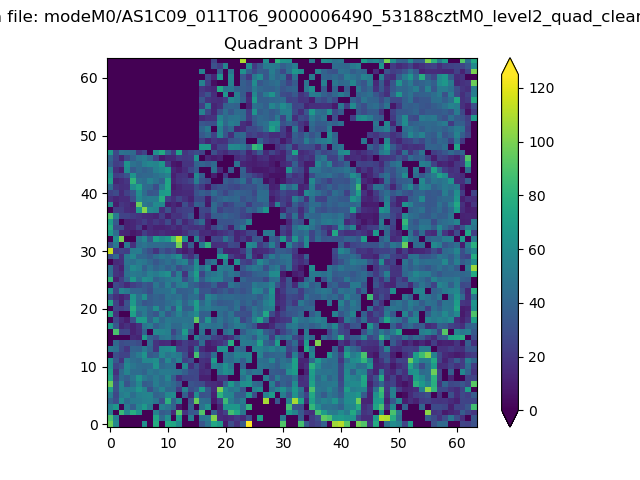 |
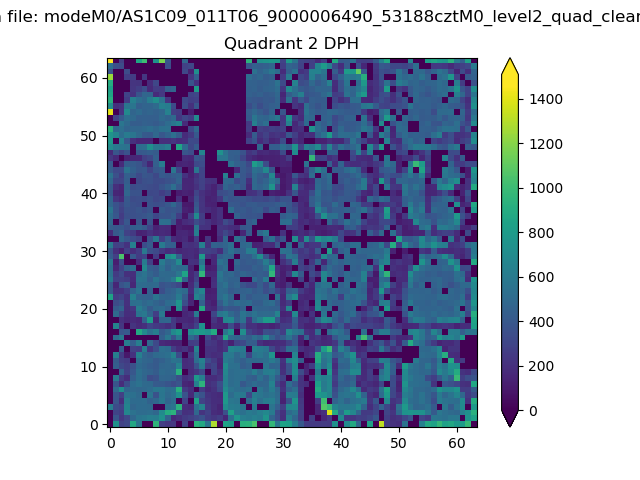 |
Quadrant C |
| Plot type | Count rate plots | Images |
|---|---|---|
| Comparison with Poisson distribution Blue bars denote a histogram of data divided into 1 sec bins. Red curve is a Poisson curve with rate = median count rate of data. |
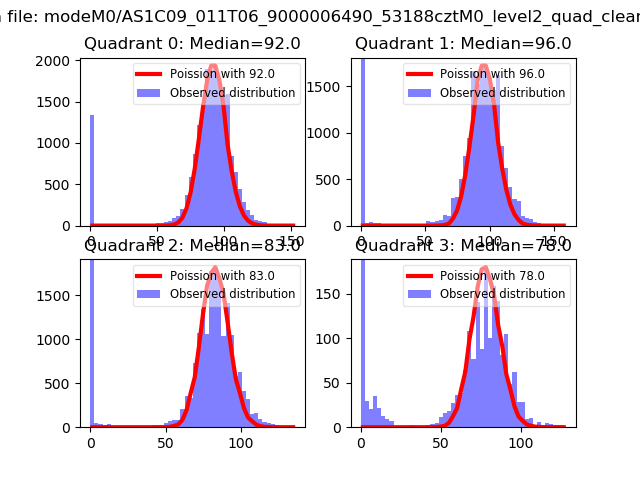 |
 |
| Quadrant-wise count rates Data is divided into 100 sec bins |
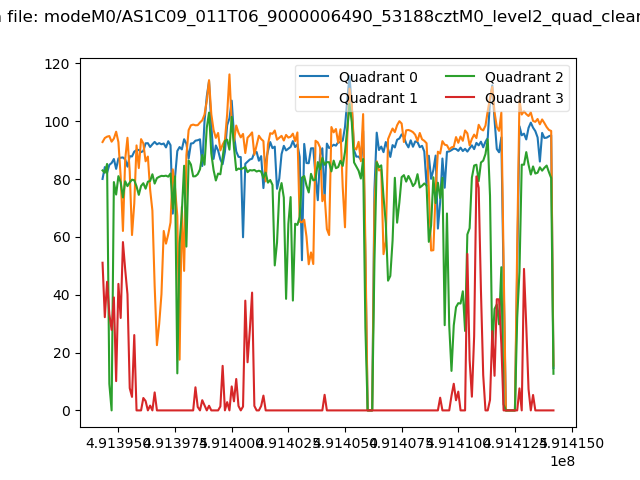 |
|
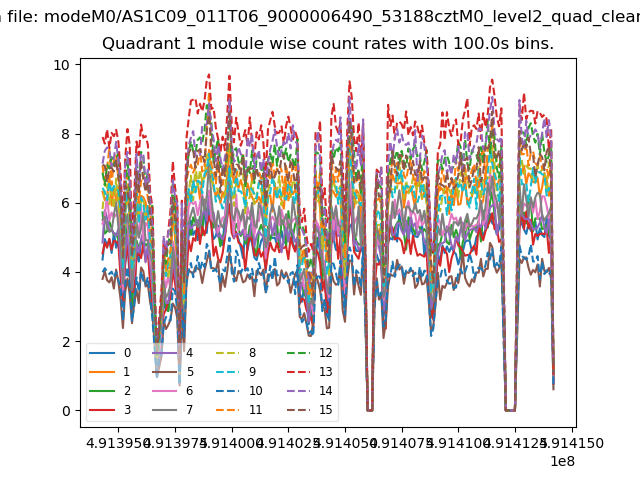
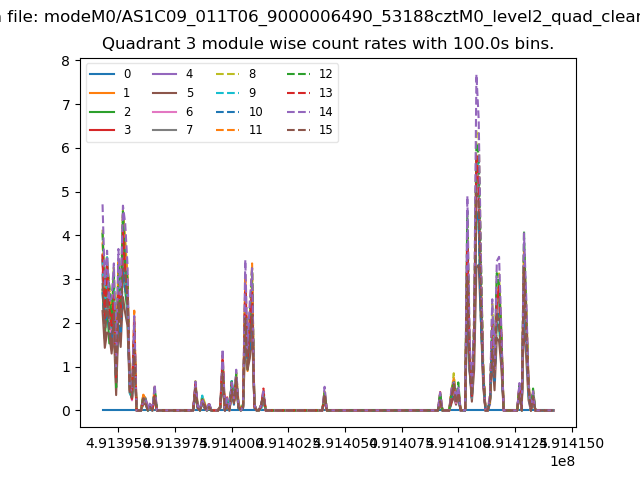
| Module-wise count rates for Quadrant A Data is divided into 100 sec bins |
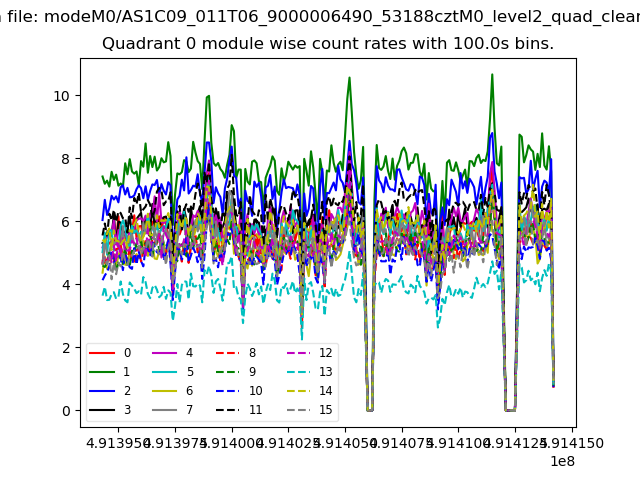 |
 |
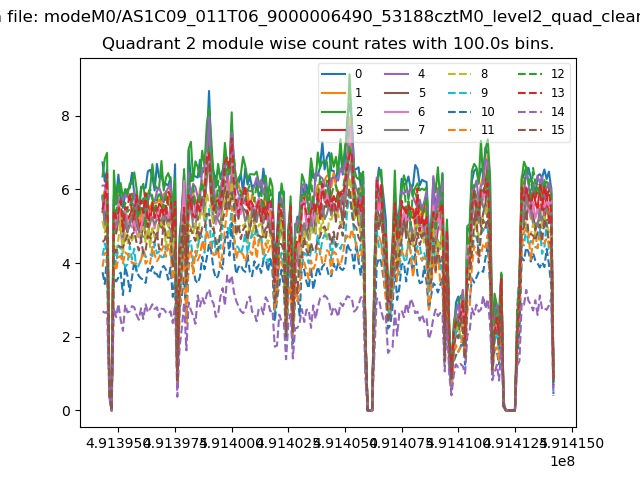
| Module-wise count rates for Quadrant B Data is divided into 100 sec bins |
 |
 |
| Module-wise count rates for Quadrant C Data is divided into 100 sec bins |
 |
 |
| Module-wise count rates for Quadrant D Data is divided into 100 sec bins |
 |
 |
| Parameter | Plot |
|---|---|
| CZT HV Monitor | 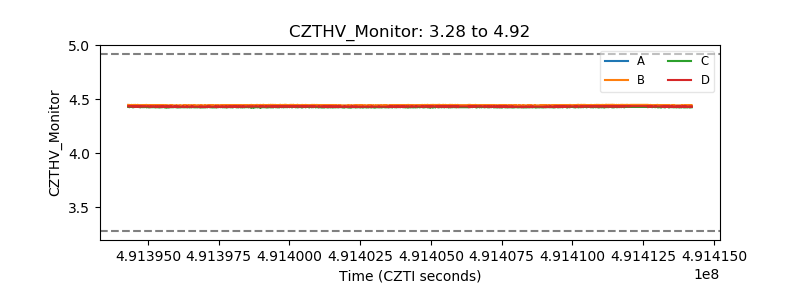 |
| D_VDD | 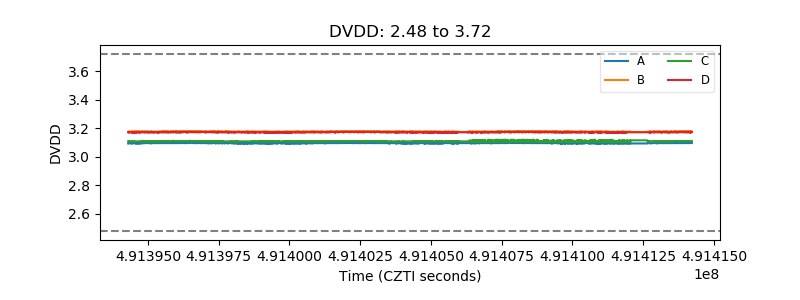 |
| Temperature 1 | 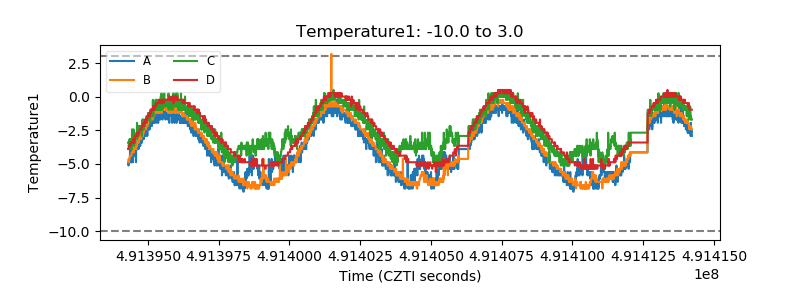 |
| Veto HV Monitor | 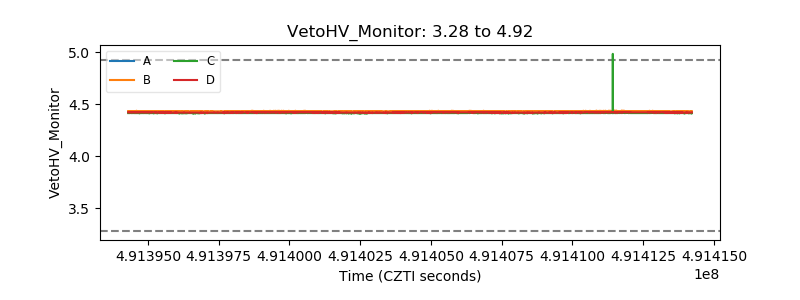 |
| Veto LLD | 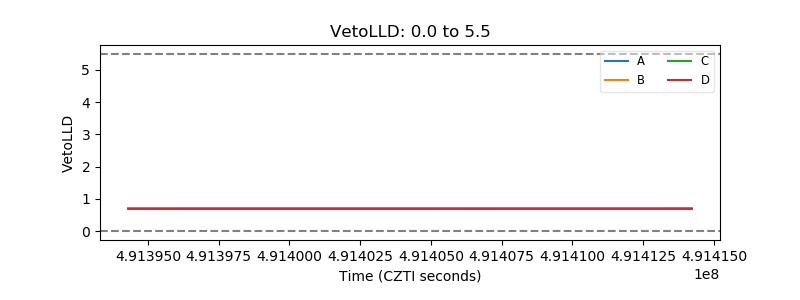 |
| Alpha Counter | 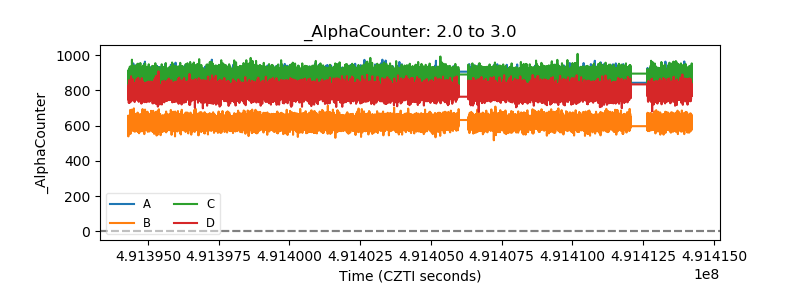 |
| _CPM_Rate | 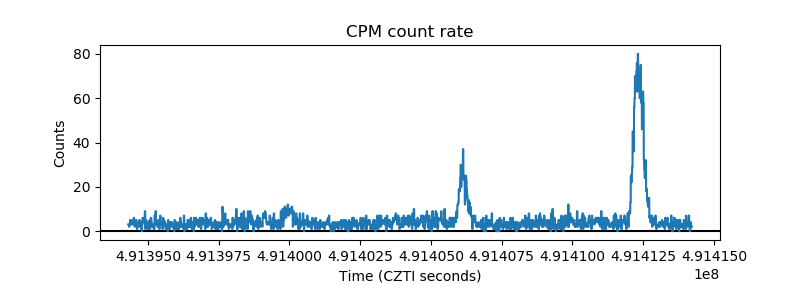 |
| CZT Counter | 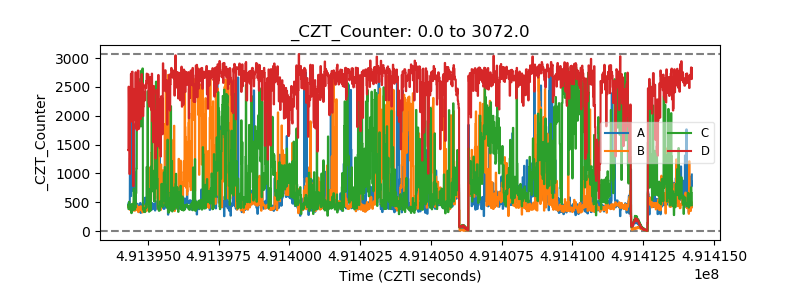 |
| +2.5 Volts monitor |  |
| +5 Volts monitor | 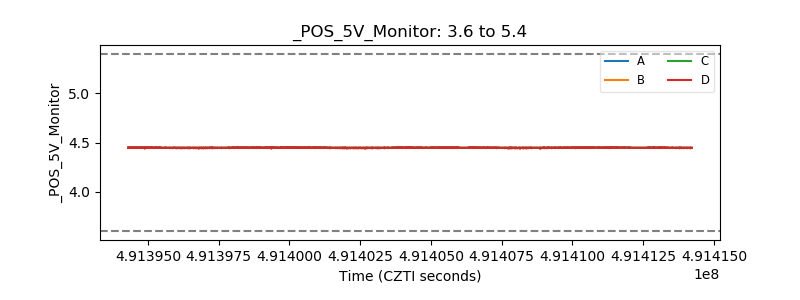 |
| _ROLL_ROT | 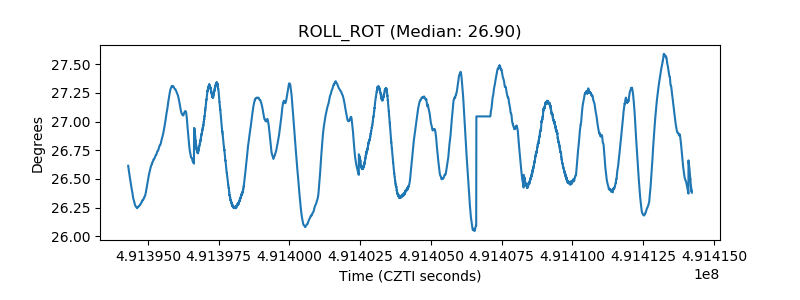 |
| _Roll_DEC | 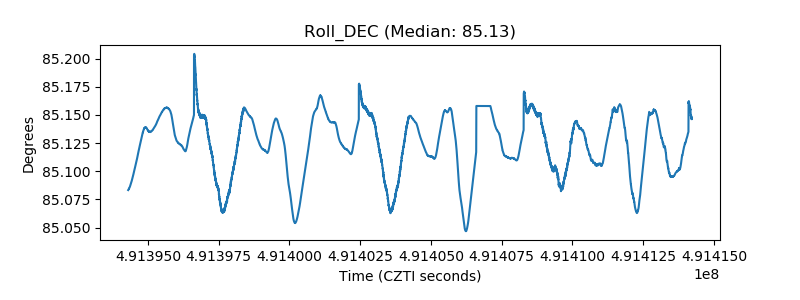 |
| _Roll_RA | 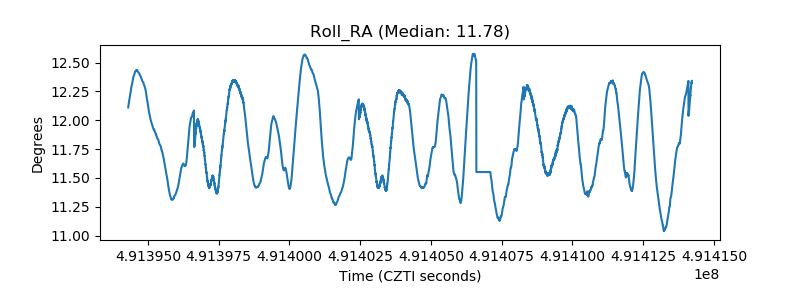 |
| Veto Counter | 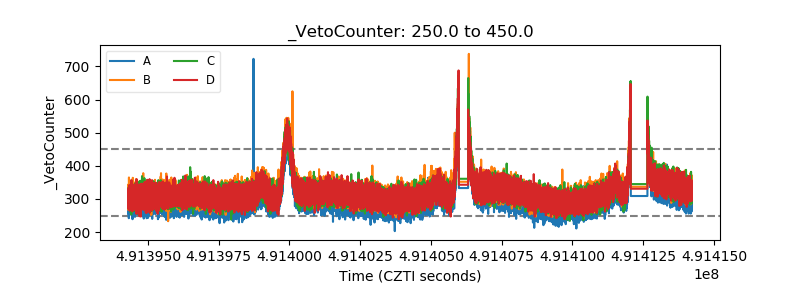 |