| Param | Original file | Final file |
|---|---|---|
| Filename | modeM0/AS1C09_011T06_9000006490_53189cztM0_level2.fits | modeM0/AS1C09_011T06_9000006490_53189cztM0_level2_quad_clean.evt |
| Size (bytes) | 784,742,400 | 73,955,520 |
| Size | 748.4 MB | 70.5 MB |
| Events in quadrant A | 3,907,175 | 578,824 |
| Events in quadrant B | 3,994,534 | 612,723 |
| Events in quadrant C | 5,013,800 | 533,621 |
| Events in quadrant D | 15,651,787 | 80,634 |
| Mode M9 | |||
|---|---|---|---|
| Quadrant | BADHDUFLAG | Total packets | Discarded packets |
| A | 0 | 8 | 0 |
| B | 0 | 8 | 0 |
| C | 0 | 8 | 0 |
| D | 0 | 8 | 0 |
| Mode SS | |||
|---|---|---|---|
| Quadrant | BADHDUFLAG | Total packets | Discarded packets |
| A | 0 | 126 | 0 |
| B | 0 | 126 | 0 |
| C | 0 | 126 | 0 |
| D | 0 | 126 | 0 |
| Mode M0 | |||
|---|---|---|---|
| Quadrant | BADHDUFLAG | Total packets | Discarded packets |
| A | 0 | 16012 | 1 |
| B | 0 | 16307 | 1 |
| C | 0 | 19202 | 1 |
| D | 0 | 50756 | 9 |
| Quadrant | Total seconds | Saturated seconds | Saturation percentage |
|---|---|---|---|
| A | 6207 | 149 | 2.400516% |
| B | 6207 | 160 | 2.577735% |
| C | 6208 | 329 | 5.299613% |
| D | 6207 | 5461 | 87.981311% |
Noise dominated data is calculated using 1-second bins in cleaned event files. If a bin has >2000 counts, and if more than 50% of those come from <1% of pixels, then it is considered to be noise-dominated and hence unusable.
| Quadrant | # 1 sec bins | Bins with >0 counts | Bins with >2000 counts | High rate bins dominated by noise | Noise dominated (total time) | Noise dominated (detector-on time) | Marked lightcurve |
|---|---|---|---|---|---|---|---|
| A | 7027 | 6208 | 114 | 114 | 1.62% | 1.84% | 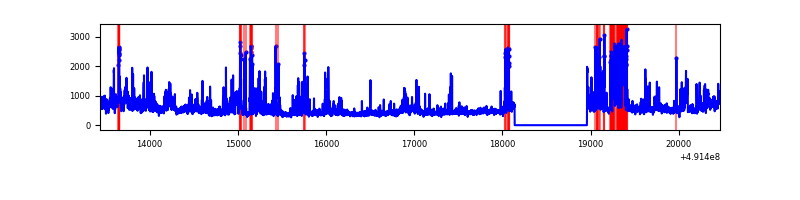 |
| B | 7027 | 6207 | 95 | 95 | 1.35% | 1.53% | 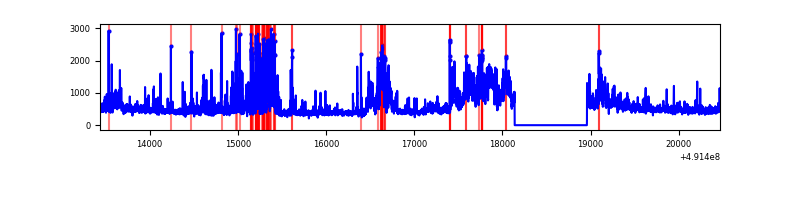 |
| C | 7028 | 6209 | 282 | 282 | 4.01% | 4.54% | 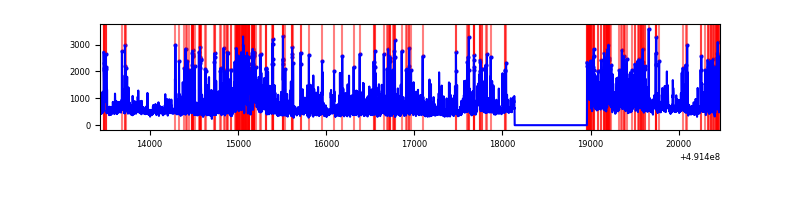 |
| D | 7026 | 6206 | 5643 | 5643 | 80.32% | 90.93% | 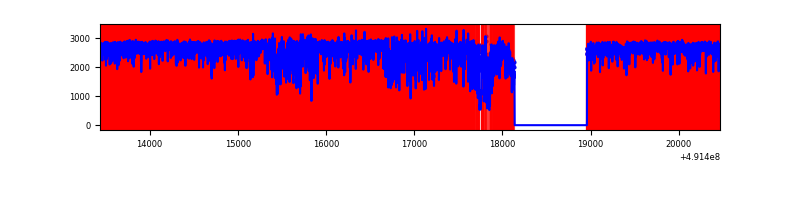 |
Top three noisy pixels from each quadrant. If the there are fewer than three noisy pixels in the level2.evt file, extra rows are filled as -1
| Pixel properties | Quadrant properties | ||||||
|---|---|---|---|---|---|---|---|
| Quadrant | DetID | PixID | Counts | Sigma | Mean | Median | Sigma |
| A | 3 | 14 | 403683 | 2515.01 | 638 | 624 | 160.3 |
| A | 0 | 8 | 260185 | 1619.61 | 638 | 624 | 160.3 |
| A | 3 | 62 | 199433 | 1240.53 | 638 | 624 | 160.3 |
| B | 10 | 254 | 927361 | 6900.56 | 631 | 609 | 134.3 |
| B | 2 | 249 | 233991 | 1737.75 | 631 | 609 | 134.3 |
| B | 7 | 128 | 66390 | 489.8 | 631 | 609 | 134.3 |
| C | 15 | 224 | 1363175 | 7999.95 | 616 | 610 | 170.3 |
| C | 10 | 22 | 354443 | 2077.44 | 616 | 610 | 170.3 |
| C | 4 | 5 | 229327 | 1342.85 | 616 | 610 | 170.3 |
| D | 15 | 125 | 13752407 | 148293.32 | 313 | 297 | 92.7 |
| D | 0 | 18 | 245008 | 2638.8 | 313 | 297 | 92.7 |
| D | 4 | 7 | 61058 | 655.2 | 313 | 297 | 92.7 |
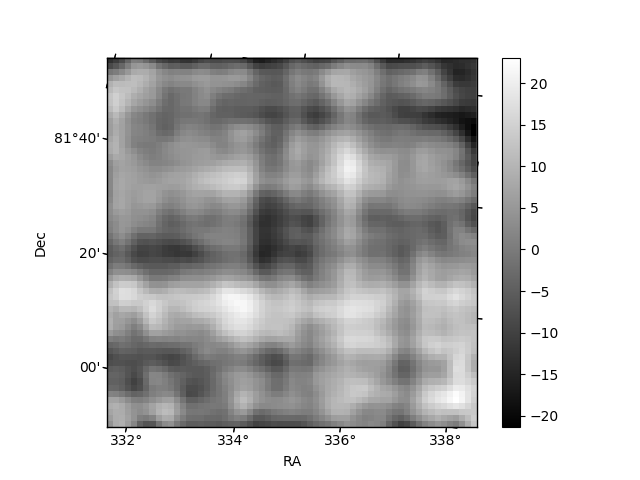
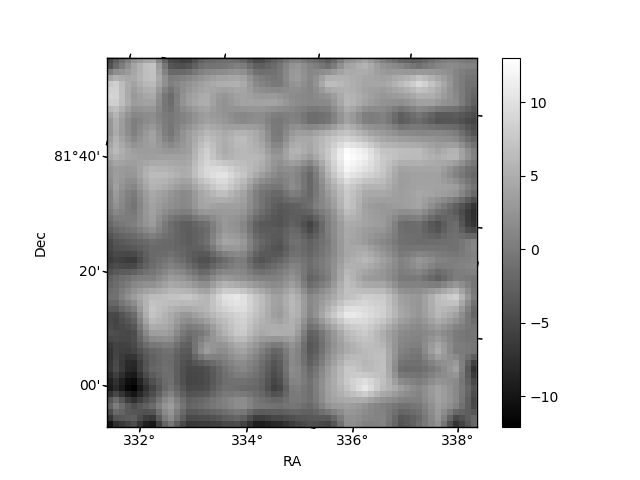
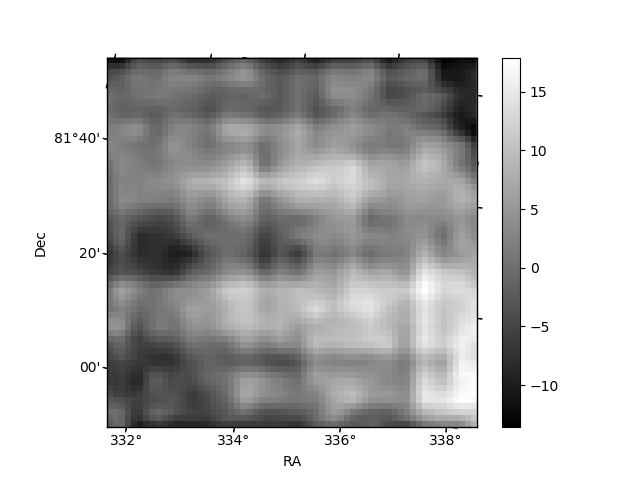
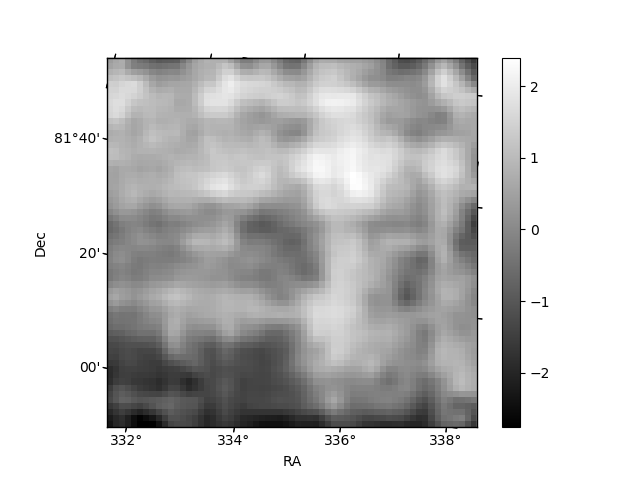
Histogram calculated using DETX and DETY for each event in the final _common_clean file
| Quadrant A | 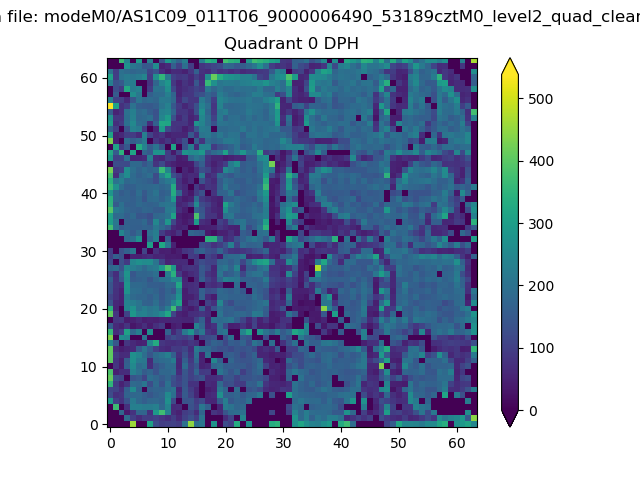 |
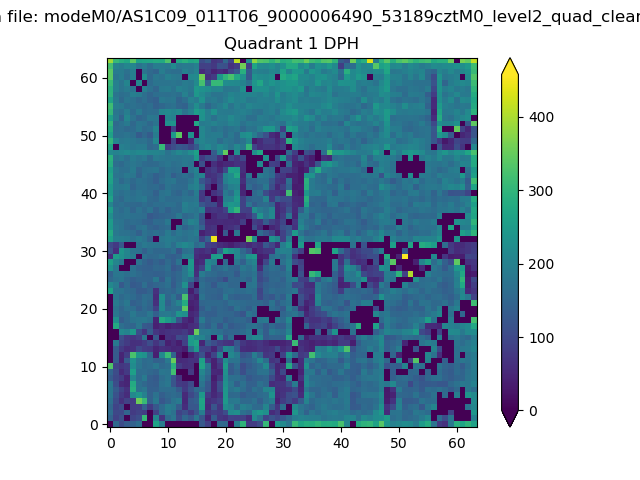 |
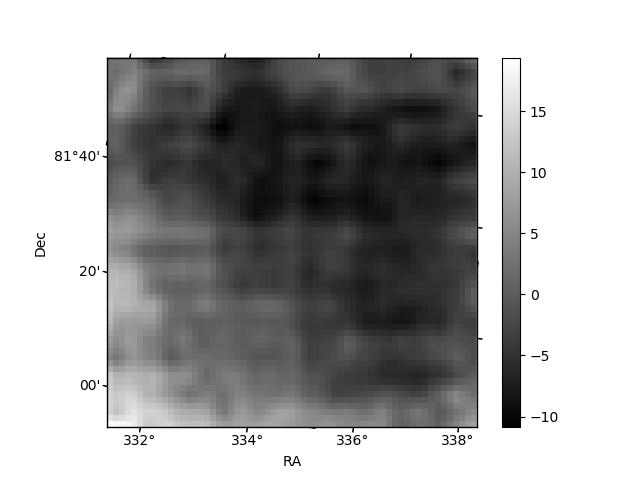
Quadrant B |
|---|---|---|---|
| Quadrant D | 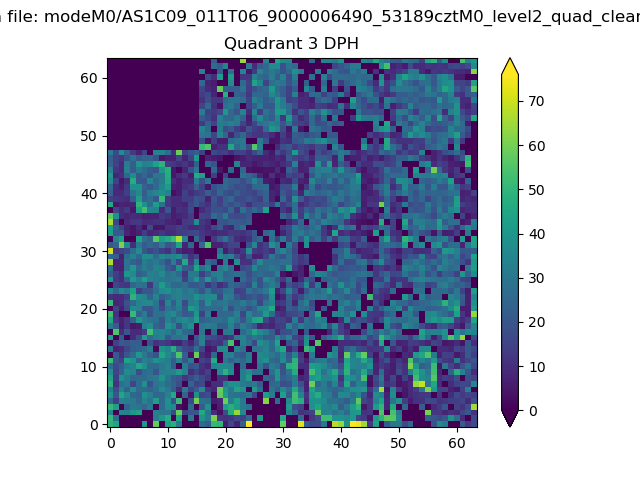 |
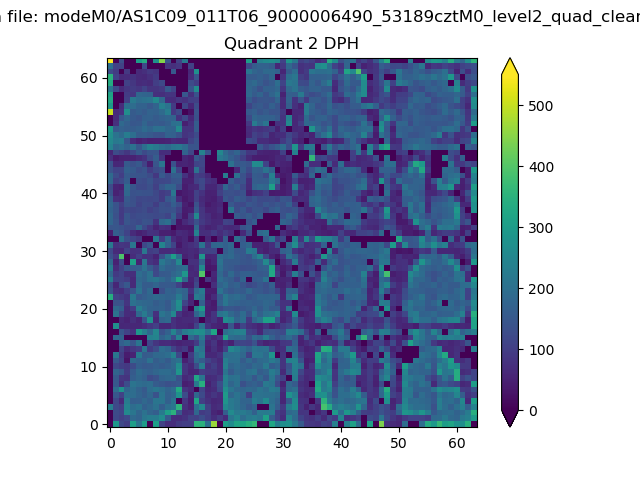 |
Quadrant C |
| Plot type | Count rate plots | Images |
|---|---|---|
| Comparison with Poisson distribution Blue bars denote a histogram of data divided into 1 sec bins. Red curve is a Poisson curve with rate = median count rate of data. |
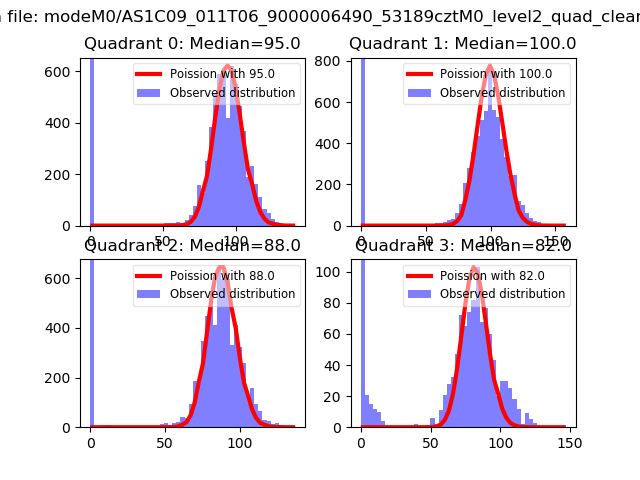 |
 |
| Quadrant-wise count rates Data is divided into 100 sec bins |
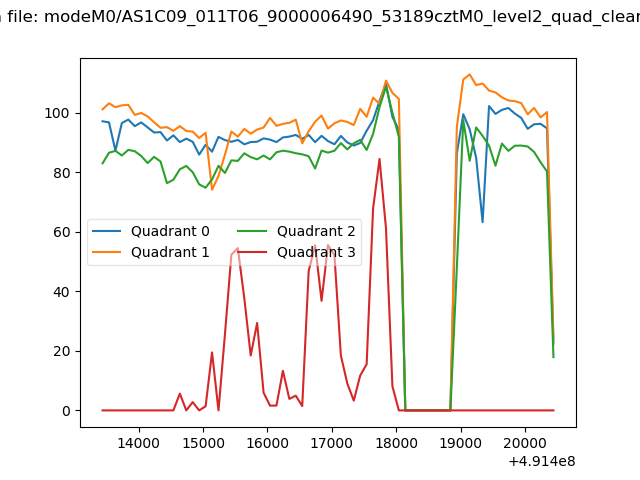 |
|
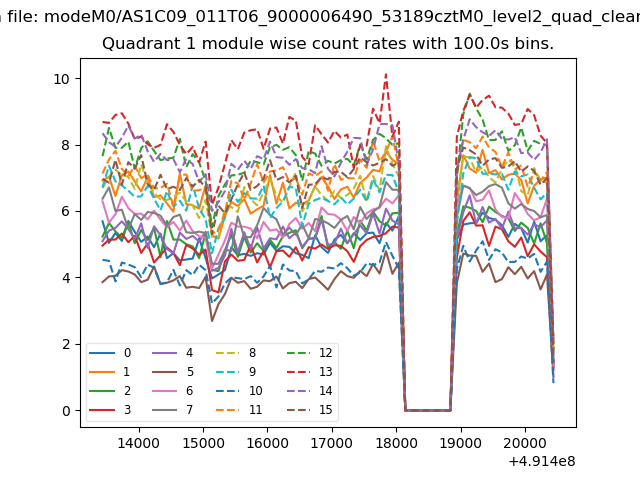
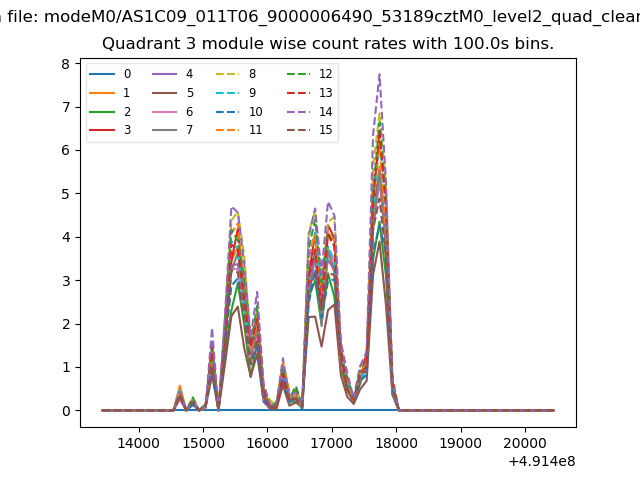
| Module-wise count rates for Quadrant A Data is divided into 100 sec bins |
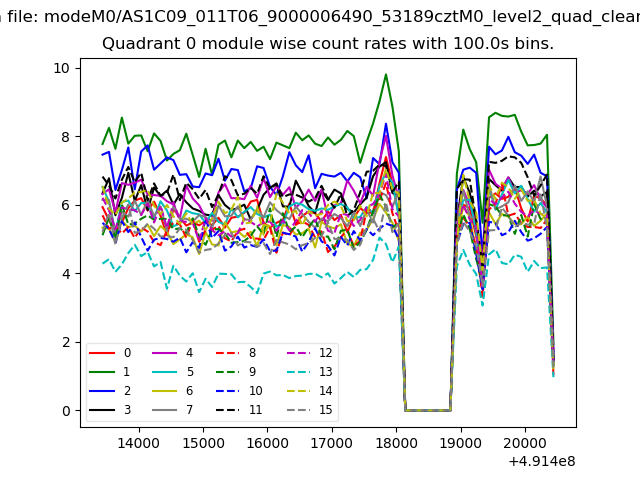 |
 |
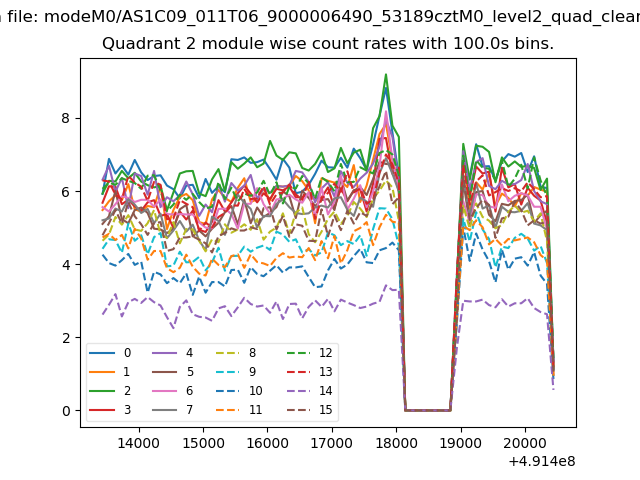
| Module-wise count rates for Quadrant B Data is divided into 100 sec bins |
 |
 |
| Module-wise count rates for Quadrant C Data is divided into 100 sec bins |
 |
 |
| Module-wise count rates for Quadrant D Data is divided into 100 sec bins |
 |
 |
| Parameter | Plot |
|---|---|
| CZT HV Monitor | 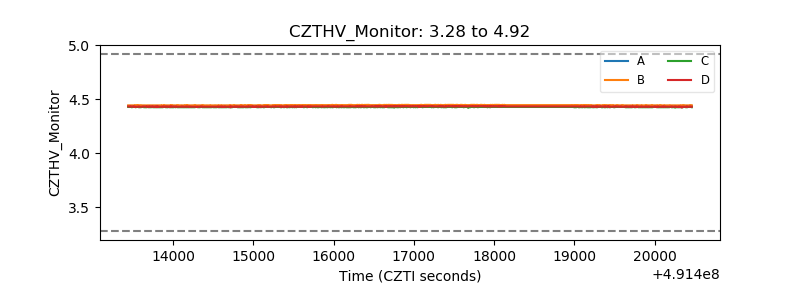 |
| D_VDD | 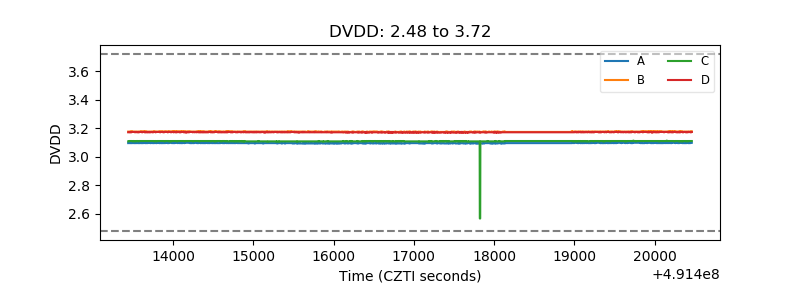 |
| Temperature 1 | 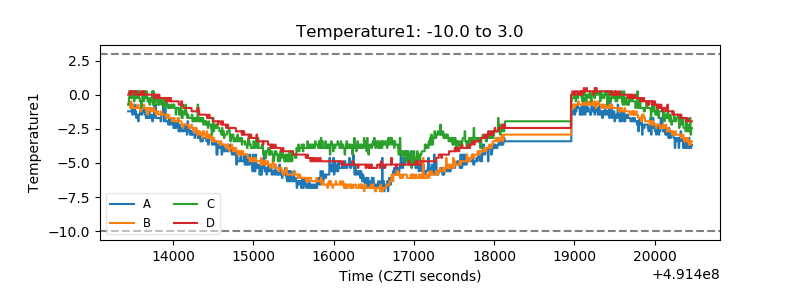 |
| Veto HV Monitor | 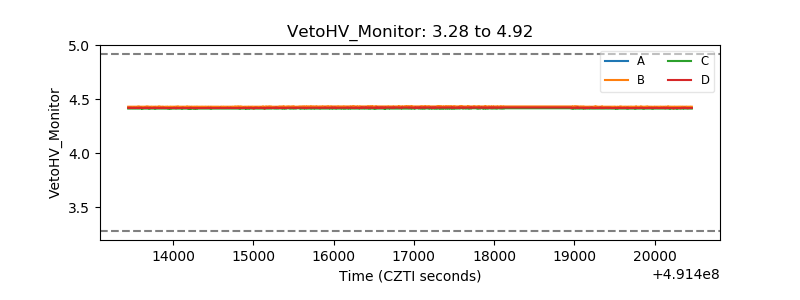 |
| Veto LLD | 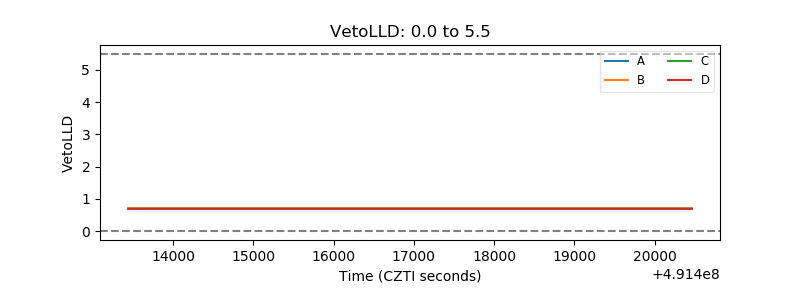 |
| Alpha Counter | 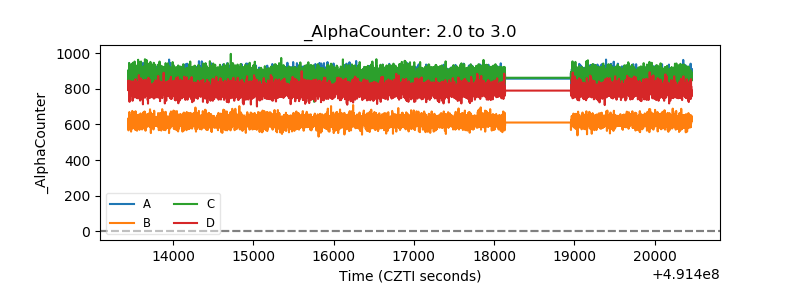 |
| _CPM_Rate | 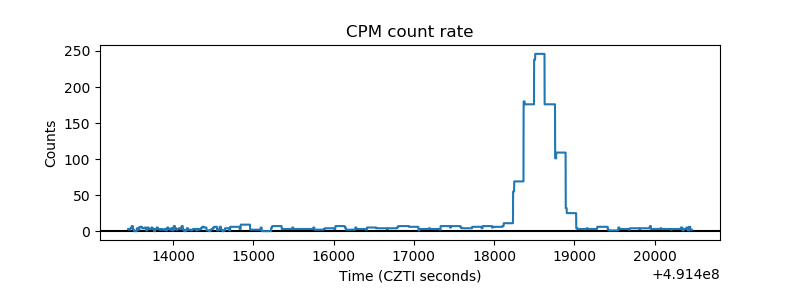 |
| CZT Counter | 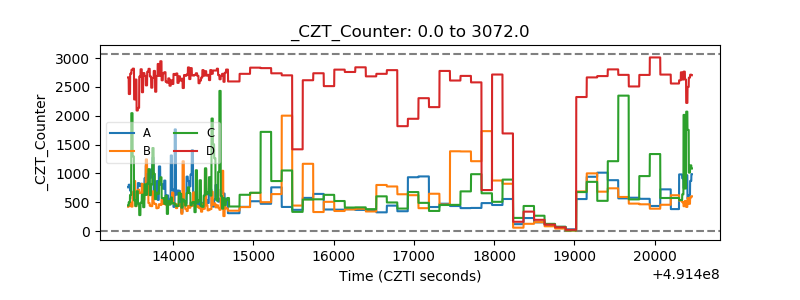 |
| +2.5 Volts monitor | 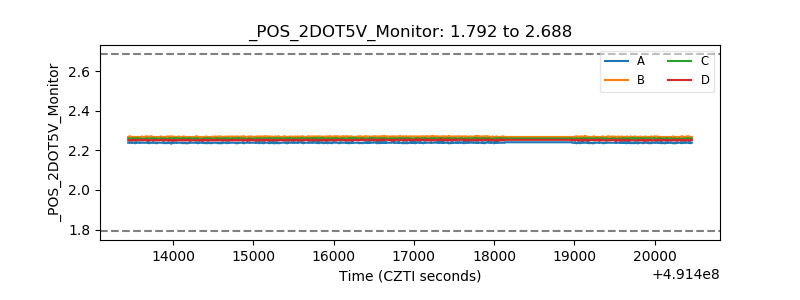 |
| +5 Volts monitor |  |
| _ROLL_ROT | 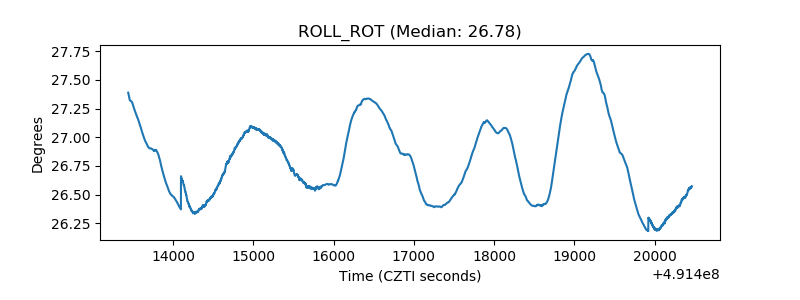 |
| _Roll_DEC | 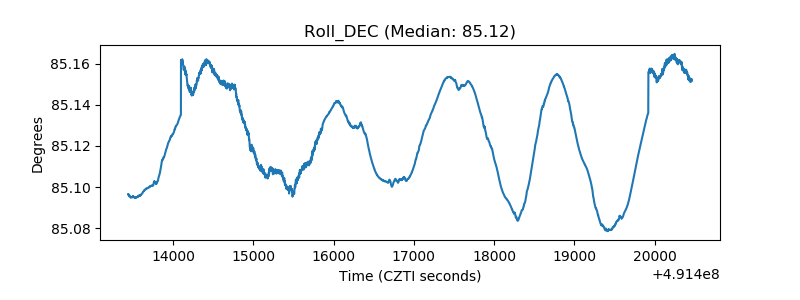 |
| _Roll_RA | 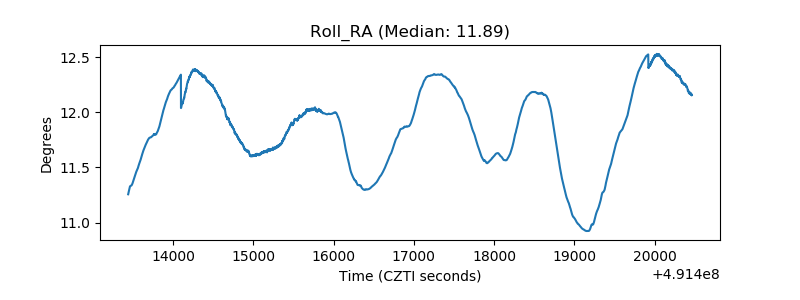 |
| Veto Counter | 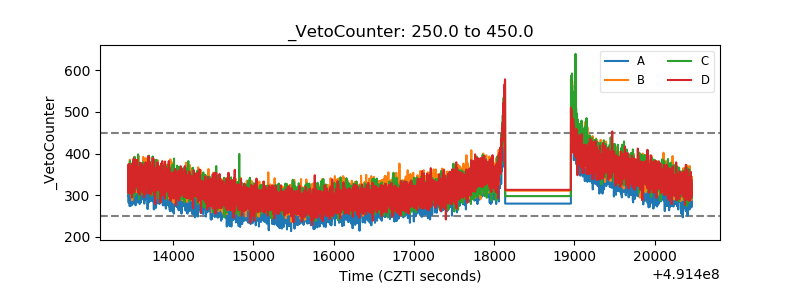 |