| Param | Original file | Final file |
|---|---|---|
| Filename | modeM0/AS1C09_011T06_9000006490_53190cztM0_level2.fits | modeM0/AS1C09_011T06_9000006490_53190cztM0_level2_quad_clean.evt |
| Size (bytes) | 823,988,160 | 68,924,160 |
| Size | 785.8 MB | 65.7 MB |
| Events in quadrant A | 3,246,846 | 587,816 |
| Events in quadrant B | 2,965,044 | 620,648 |
| Events in quadrant C | 7,912,711 | 432,305 |
| Events in quadrant D | 15,902,665 | 19,293 |
| Mode M9 | |||
|---|---|---|---|
| Quadrant | BADHDUFLAG | Total packets | Discarded packets |
| A | 0 | 10 | 0 |
| B | 0 | 10 | 0 |
| C | 0 | 10 | 0 |
| D | 0 | 10 | 0 |
| Mode SS | |||
|---|---|---|---|
| Quadrant | BADHDUFLAG | Total packets | Discarded packets |
| A | 0 | 124 | 0 |
| B | 0 | 124 | 0 |
| C | 0 | 124 | 0 |
| D | 0 | 124 | 0 |
| Mode M0 | |||
|---|---|---|---|
| Quadrant | BADHDUFLAG | Total packets | Discarded packets |
| A | 0 | 13999 | 1 |
| B | 0 | 13253 | 1 |
| C | 0 | 27743 | 1 |
| D | 0 | 51447 | 8 |
| Quadrant | Total seconds | Saturated seconds | Saturation percentage |
|---|---|---|---|
| A | 6110 | 56 | 0.916530% |
| B | 6111 | 49 | 0.801833% |
| C | 6111 | 1502 | 24.578629% |
| D | 6110 | 5949 | 97.364975% |
Noise dominated data is calculated using 1-second bins in cleaned event files. If a bin has >2000 counts, and if more than 50% of those come from <1% of pixels, then it is considered to be noise-dominated and hence unusable.
| Quadrant | # 1 sec bins | Bins with >0 counts | Bins with >2000 counts | High rate bins dominated by noise | Noise dominated (total time) | Noise dominated (detector-on time) | Marked lightcurve |
|---|---|---|---|---|---|---|---|
| A | 7070 | 6110 | 29 | 29 | 0.41% | 0.47% | 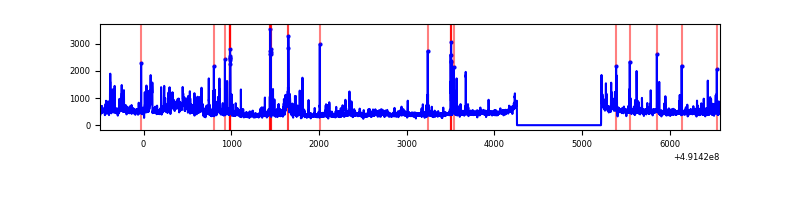 |
| B | 7071 | 6111 | 25 | 25 | 0.35% | 0.41% | 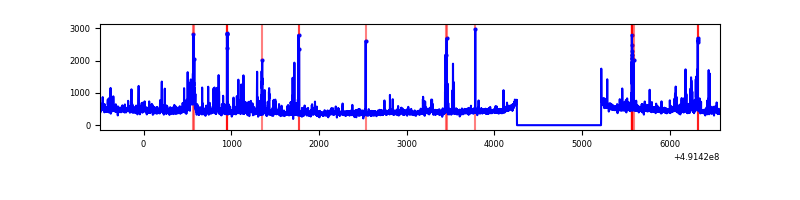 |
| C | 7071 | 6111 | 1500 | 1500 | 21.21% | 24.55% | 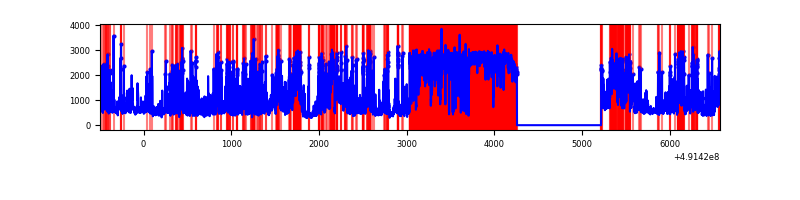 |
| D | 7069 | 6109 | 5841 | 5841 | 82.63% | 95.61% | 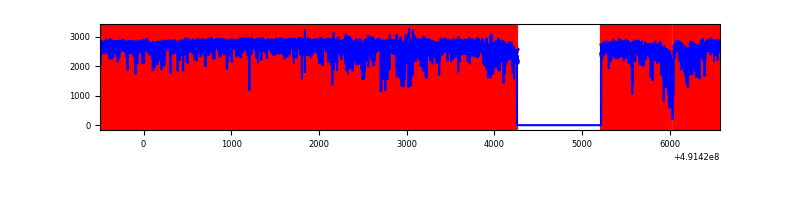 |
Top three noisy pixels from each quadrant. If the there are fewer than three noisy pixels in the level2.evt file, extra rows are filled as -1
| Pixel properties | Quadrant properties | ||||||
|---|---|---|---|---|---|---|---|
| Quadrant | DetID | PixID | Counts | Sigma | Mean | Median | Sigma |
| A | 3 | 14 | 139216 | 873.39 | 635 | 619 | 158.7 |
| A | 12 | 80 | 103317 | 647.16 | 635 | 619 | 158.7 |
| A | 15 | 174 | 90268 | 564.93 | 635 | 619 | 158.7 |
| B | 10 | 254 | 108777 | 811.96 | 630 | 607 | 133.2 |
| B | 10 | 247 | 73275 | 545.47 | 630 | 607 | 133.2 |
| B | 8 | 128 | 41427 | 306.41 | 630 | 607 | 133.2 |
| C | 1 | 241 | 2789079 | 18270.32 | 554 | 549 | 152.6 |
| C | 15 | 224 | 1814048 | 11881.96 | 554 | 549 | 152.6 |
| C | 10 | 22 | 308720 | 2019.12 | 554 | 549 | 152.6 |
| D | 15 | 125 | 14809089 | 246504.89 | 205 | 196 | 60.1 |
| D | 2 | 120 | 33777 | 558.98 | 205 | 196 | 60.1 |
| D | 13 | 170 | 32687 | 540.84 | 205 | 196 | 60.1 |
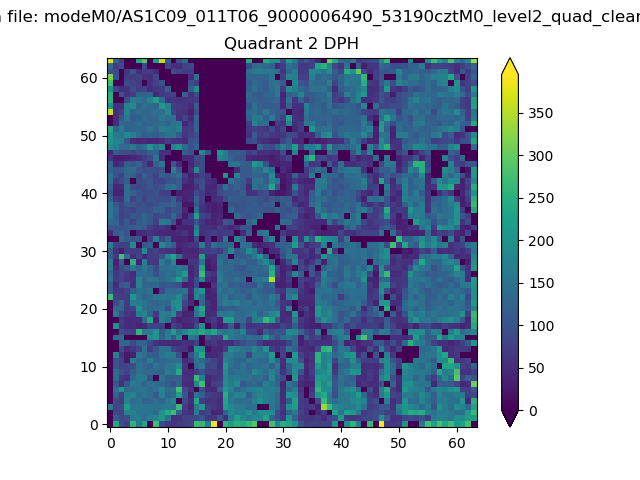
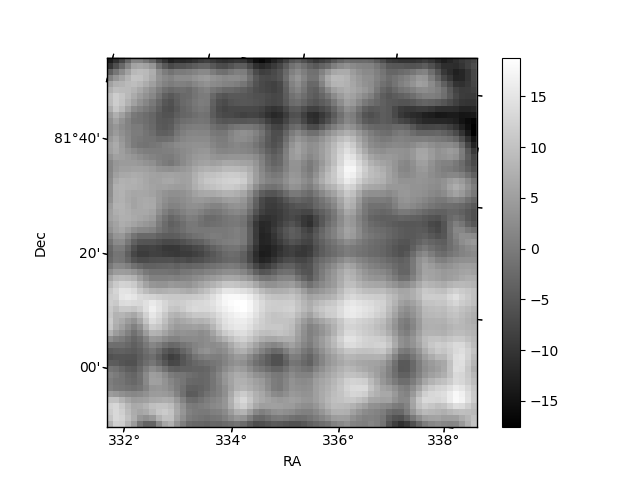
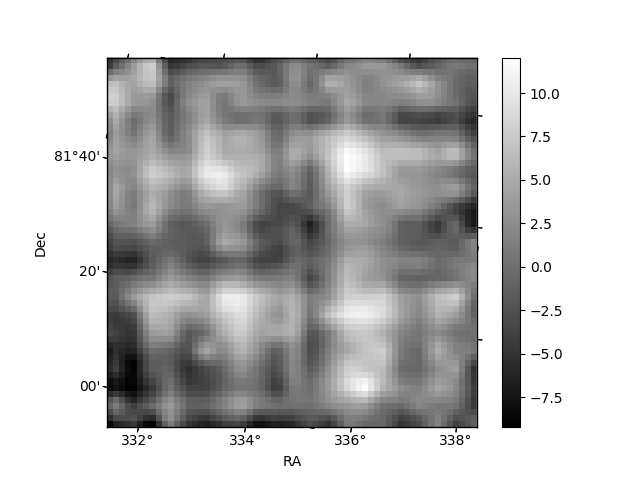
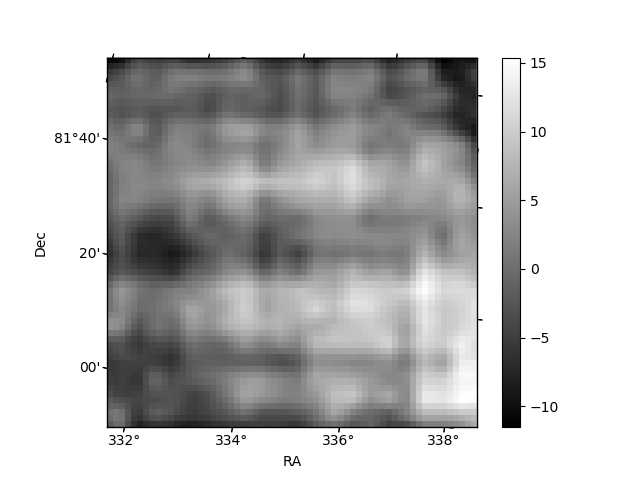
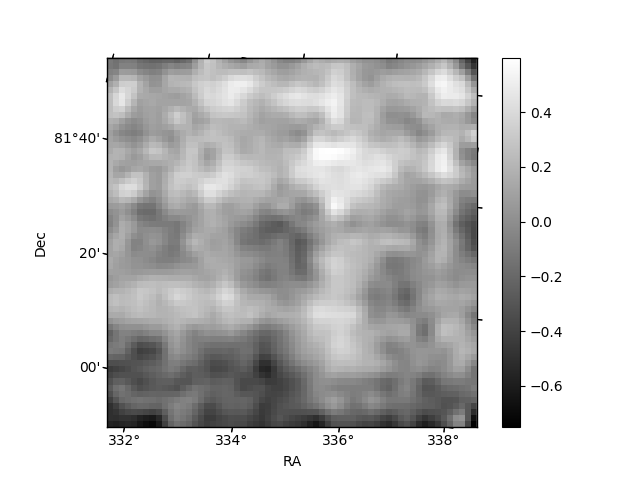
Histogram calculated using DETX and DETY for each event in the final _common_clean file
| Quadrant A | 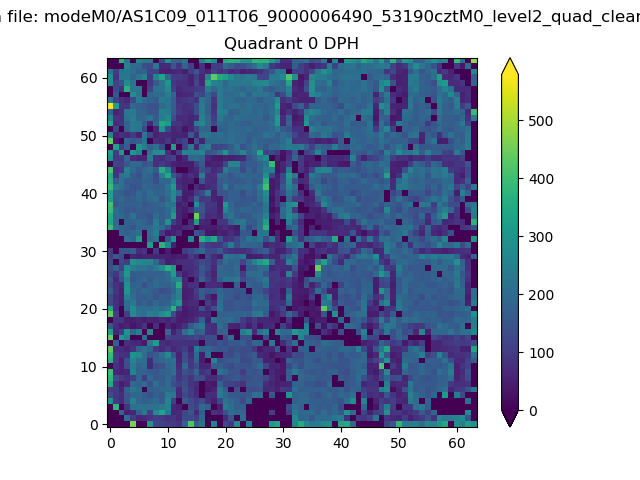 |
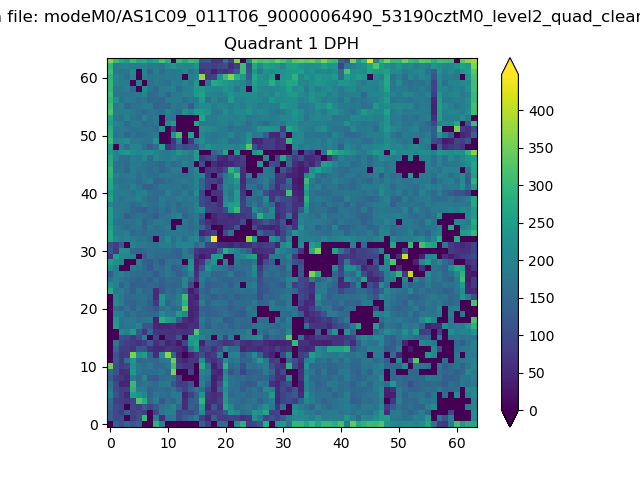 |
Quadrant B |
|---|---|---|---|
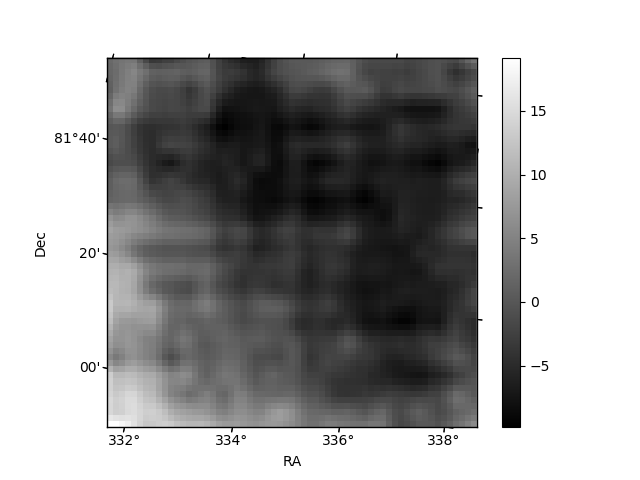
| Quadrant D | 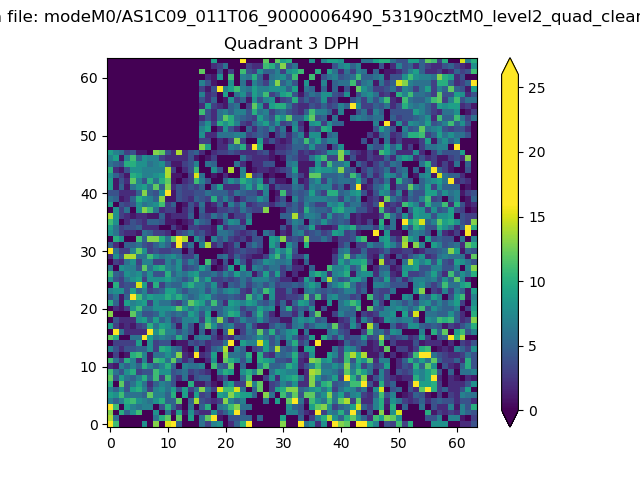 |
 |
Quadrant C |
| Plot type | Count rate plots | Images |
|---|---|---|
| Comparison with Poisson distribution Blue bars denote a histogram of data divided into 1 sec bins. Red curve is a Poisson curve with rate = median count rate of data. |
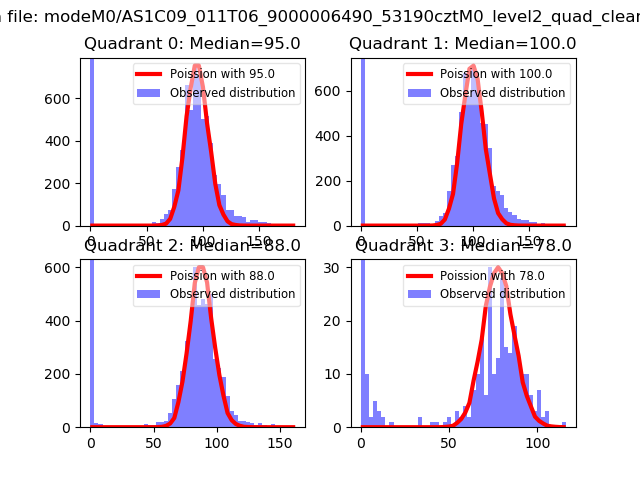 |
 |
| Quadrant-wise count rates Data is divided into 100 sec bins |
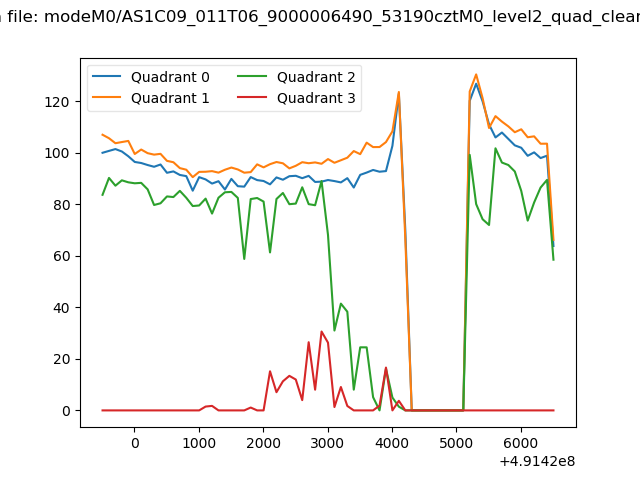 |
|
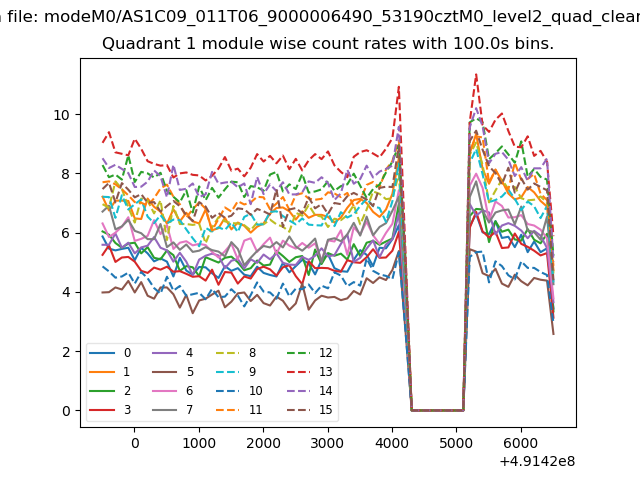
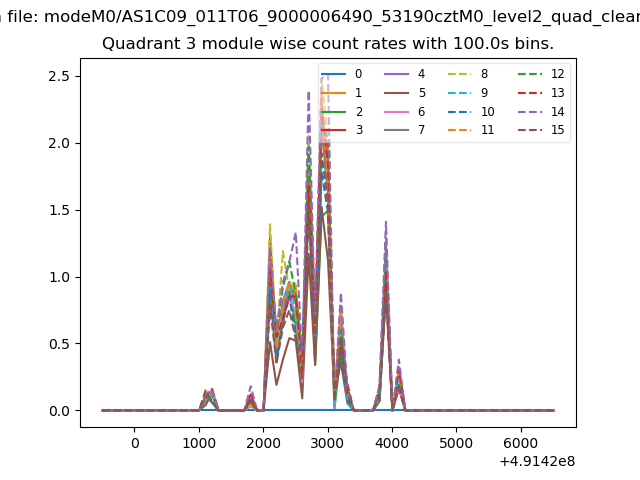
| Module-wise count rates for Quadrant A Data is divided into 100 sec bins |
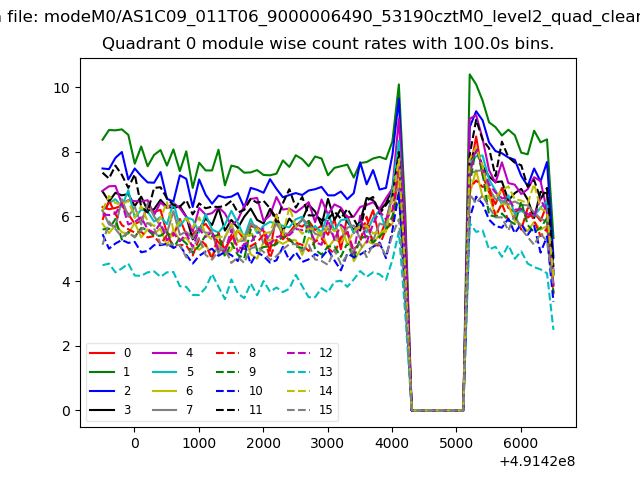 |
 |
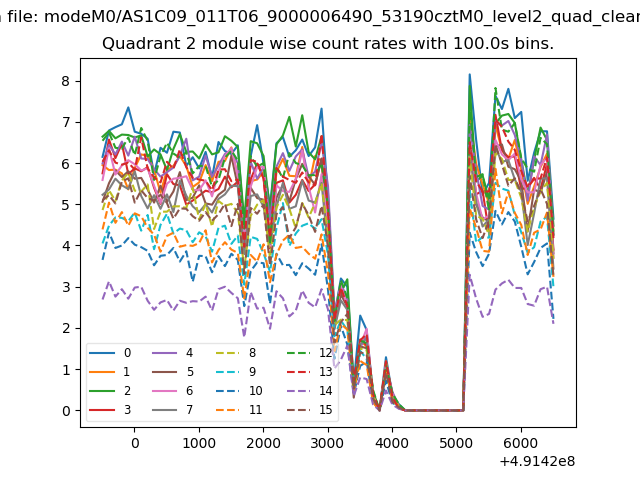
| Module-wise count rates for Quadrant B Data is divided into 100 sec bins |
 |
 |
| Module-wise count rates for Quadrant C Data is divided into 100 sec bins |
 |
 |
| Module-wise count rates for Quadrant D Data is divided into 100 sec bins |
 |
 |
| Parameter | Plot |
|---|---|
| CZT HV Monitor | 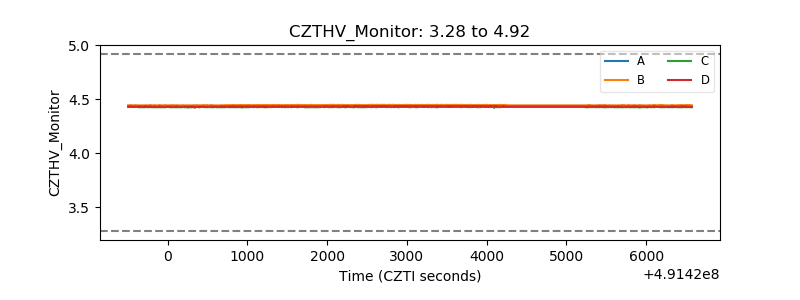 |
| D_VDD | 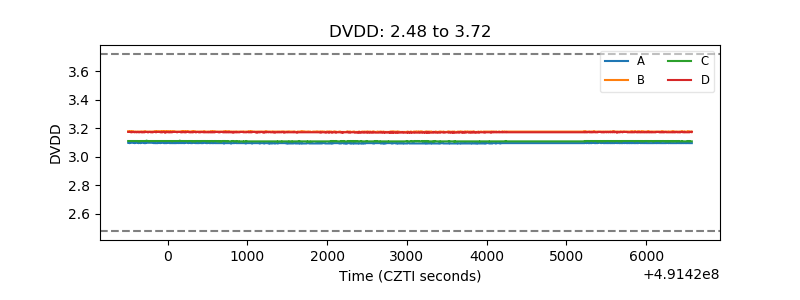 |
| Temperature 1 | 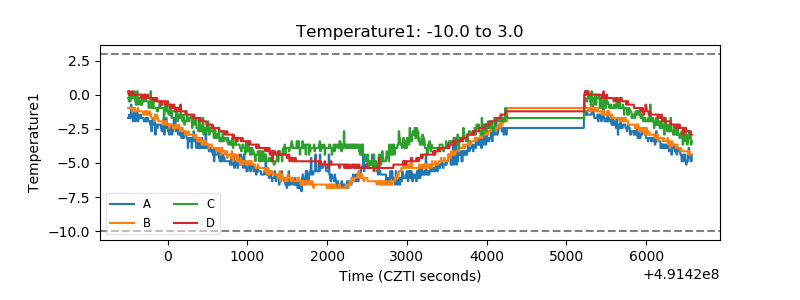 |
| Veto HV Monitor | 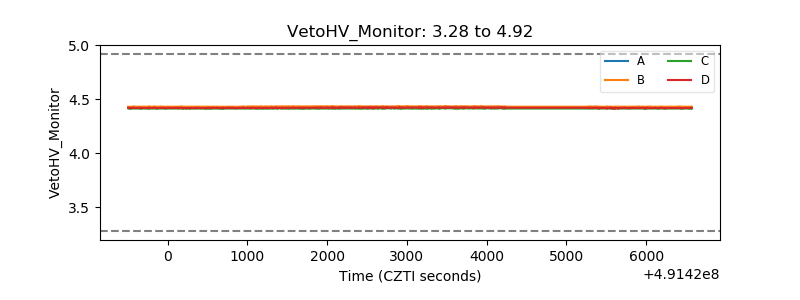 |
| Veto LLD | 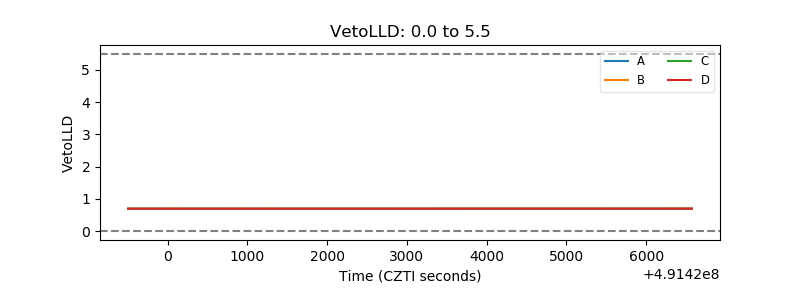 |
| Alpha Counter | 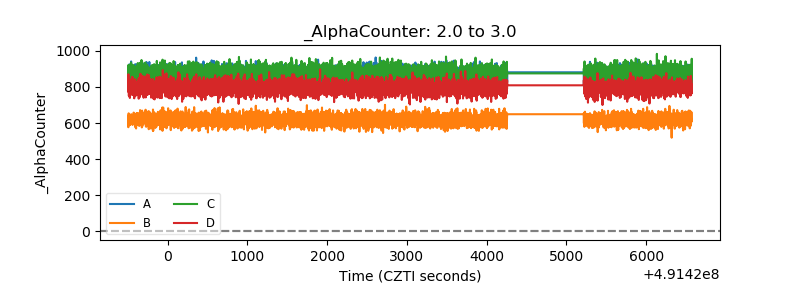 |
| _CPM_Rate | 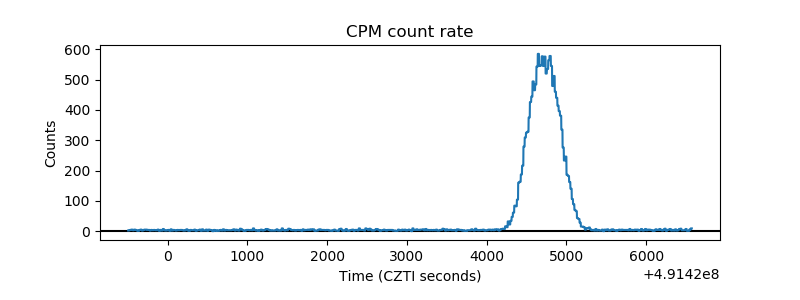 |
| CZT Counter | 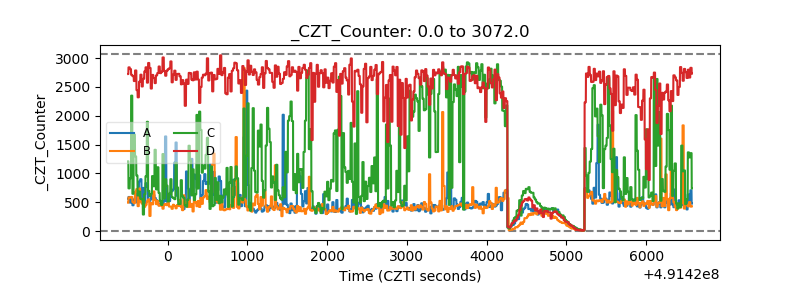 |
| +2.5 Volts monitor |  |
| +5 Volts monitor |  |
| _ROLL_ROT | 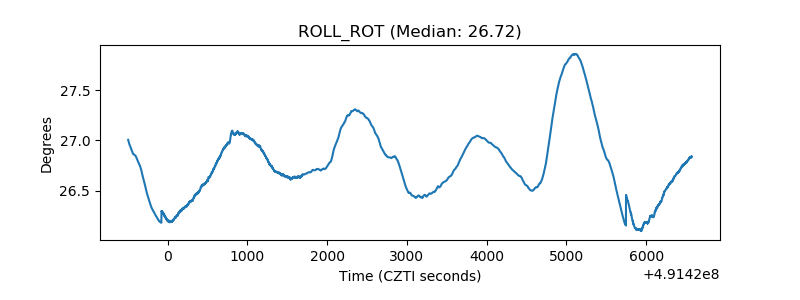 |
| _Roll_DEC | 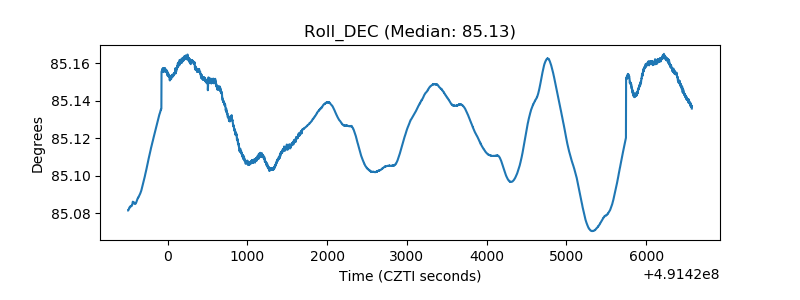 |
| _Roll_RA | 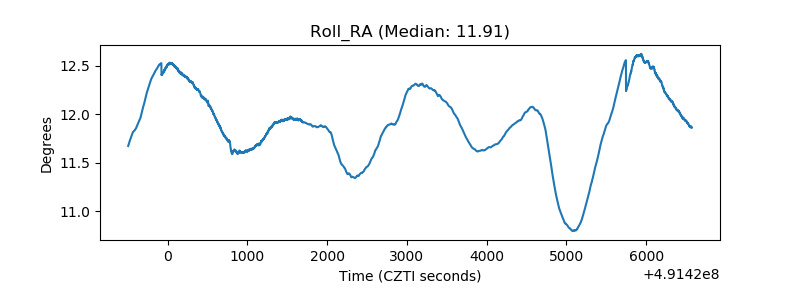 |
| Veto Counter | 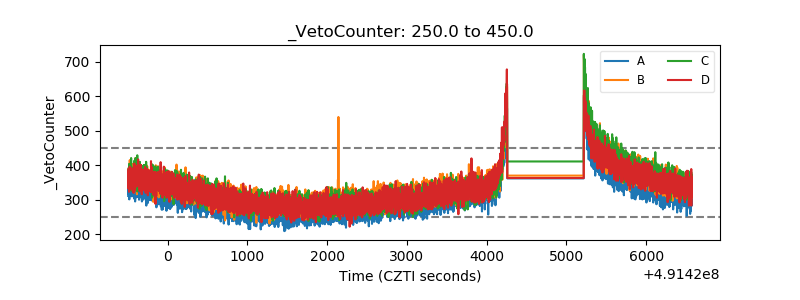 |