| Param | Original file | Final file |
|---|---|---|
| Filename | modeM0/AS1C09_011T06_9000006490_53193cztM0_level2.fits | modeM0/AS1C09_011T06_9000006490_53193cztM0_level2_quad_clean.evt |
| Size (bytes) | 805,029,120 | 75,723,840 |
| Size | 767.7 MB | 72.2 MB |
| Events in quadrant A | 3,255,311 | 615,939 |
| Events in quadrant B | 2,915,876 | 666,223 |
| Events in quadrant C | 7,118,700 | 513,612 |
| Events in quadrant D | 16,024,383 | 60,485 |
| Mode M9 | |||
|---|---|---|---|
| Quadrant | BADHDUFLAG | Total packets | Discarded packets |
| A | 0 | 12 | 0 |
| B | 0 | 12 | 0 |
| C | 0 | 12 | 0 |
| D | 0 | 12 | 0 |
| Mode SS | |||
|---|---|---|---|
| Quadrant | BADHDUFLAG | Total packets | Discarded packets |
| A | 0 | 126 | 0 |
| B | 0 | 126 | 0 |
| C | 0 | 126 | 0 |
| D | 0 | 126 | 0 |
| Mode M0 | |||
|---|---|---|---|
| Quadrant | BADHDUFLAG | Total packets | Discarded packets |
| A | 0 | 14355 | 1 |
| B | 0 | 13274 | 1 |
| C | 0 | 25529 | 1 |
| D | 0 | 51909 | 1 |
| Quadrant | Total seconds | Saturated seconds | Saturation percentage |
|---|---|---|---|
| A | 6256 | 66 | 1.054987% |
| B | 6257 | 32 | 0.511427% |
| C | 6257 | 1082 | 17.292632% |
| D | 6257 | 5710 | 91.257791% |
Noise dominated data is calculated using 1-second bins in cleaned event files. If a bin has >2000 counts, and if more than 50% of those come from <1% of pixels, then it is considered to be noise-dominated and hence unusable.
| Quadrant | # 1 sec bins | Bins with >0 counts | Bins with >2000 counts | High rate bins dominated by noise | Noise dominated (total time) | Noise dominated (detector-on time) | Marked lightcurve |
|---|---|---|---|---|---|---|---|
| A | 7452 | 6257 | 67 | 67 | 0.90% | 1.07% | 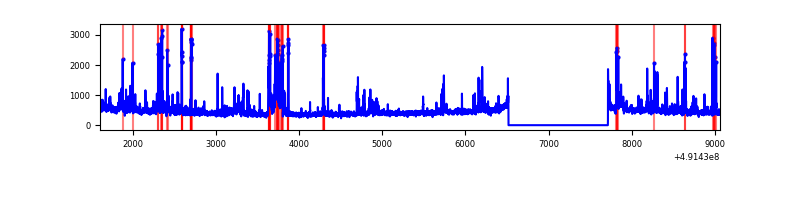 |
| B | 7453 | 6257 | 12 | 12 | 0.16% | 0.19% | 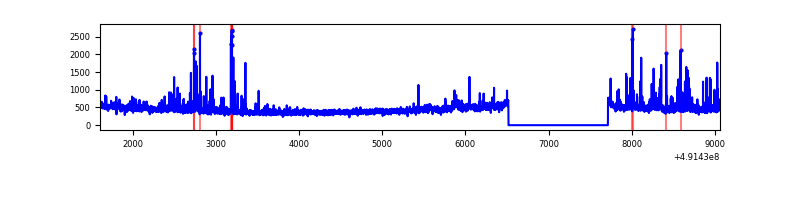 |
| C | 7453 | 6258 | 1027 | 1027 | 13.78% | 16.41% | 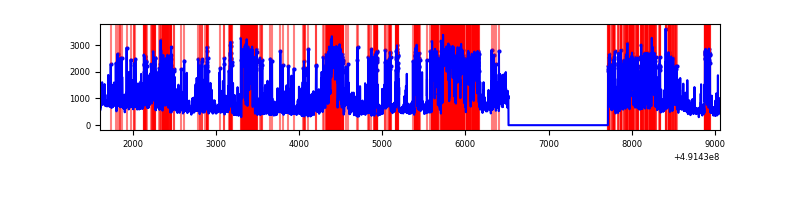 |
| D | 7452 | 6256 | 5839 | 5839 | 78.35% | 93.33% | 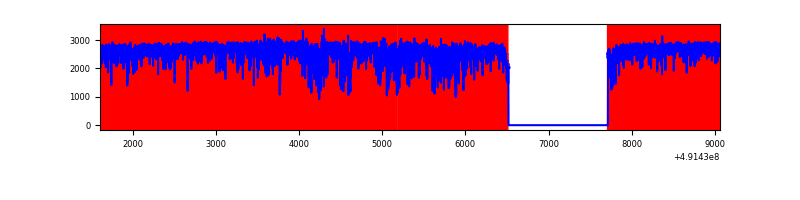 |
Top three noisy pixels from each quadrant. If the there are fewer than three noisy pixels in the level2.evt file, extra rows are filled as -1
| Pixel properties | Quadrant properties | ||||||
|---|---|---|---|---|---|---|---|
| Quadrant | DetID | PixID | Counts | Sigma | Mean | Median | Sigma |
| A | 7 | 206 | 149555 | 915.63 | 651 | 635 | 162.6 |
| A | 15 | 174 | 95026 | 580.36 | 651 | 635 | 162.6 |
| A | 3 | 62 | 94487 | 577.05 | 651 | 635 | 162.6 |
| B | 10 | 247 | 57990 | 413.39 | 653 | 629 | 138.8 |
| B | 10 | 254 | 46729 | 332.24 | 653 | 629 | 138.8 |
| B | 7 | 252 | 45506 | 323.42 | 653 | 629 | 138.8 |
| C | 15 | 224 | 1857256 | 11110.99 | 601 | 597 | 167.1 |
| C | 1 | 241 | 1434736 | 8582.46 | 601 | 597 | 167.1 |
| C | 10 | 22 | 597196 | 3570.29 | 601 | 597 | 167.1 |
| D | 15 | 125 | 13848575 | 164248.28 | 284 | 270 | 84.3 |
| D | 2 | 249 | 211561 | 2506.02 | 284 | 270 | 84.3 |
| D | 12 | 3 | 166025 | 1965.94 | 284 | 270 | 84.3 |
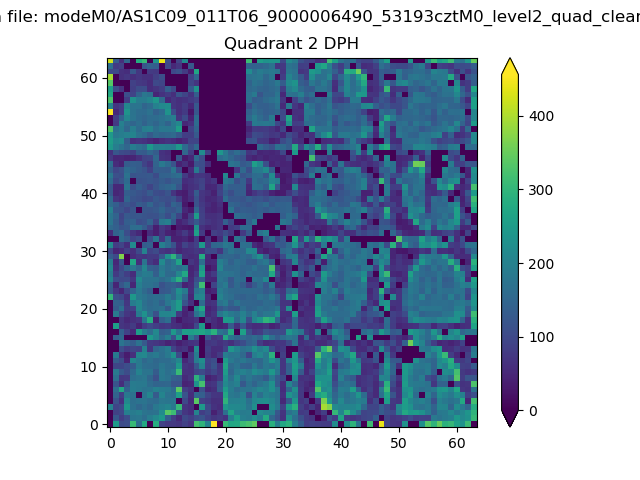
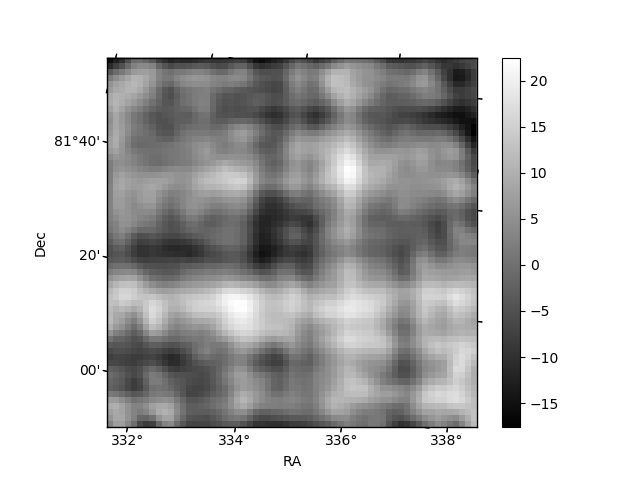
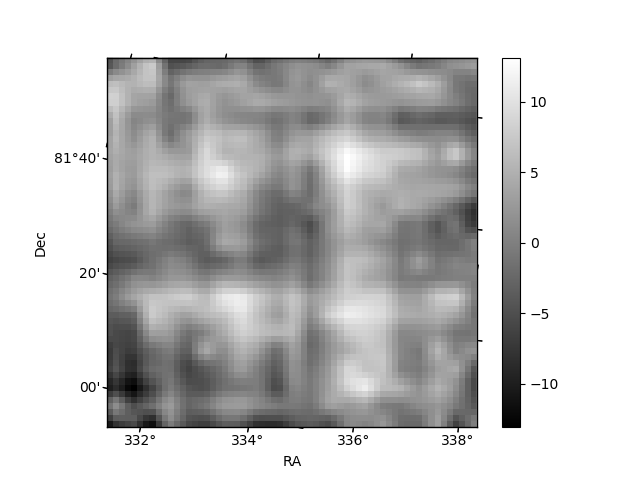
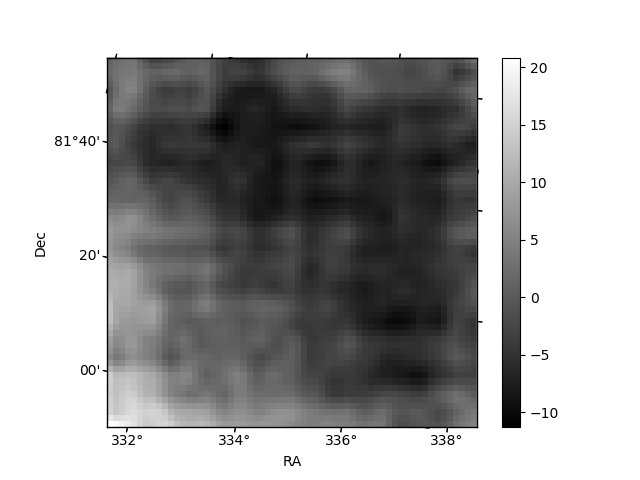
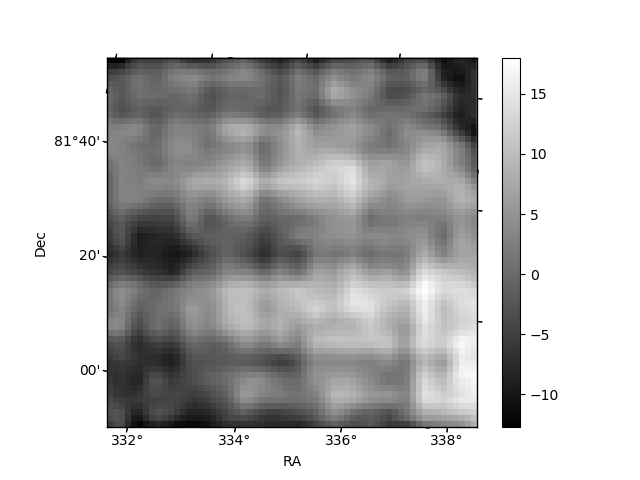
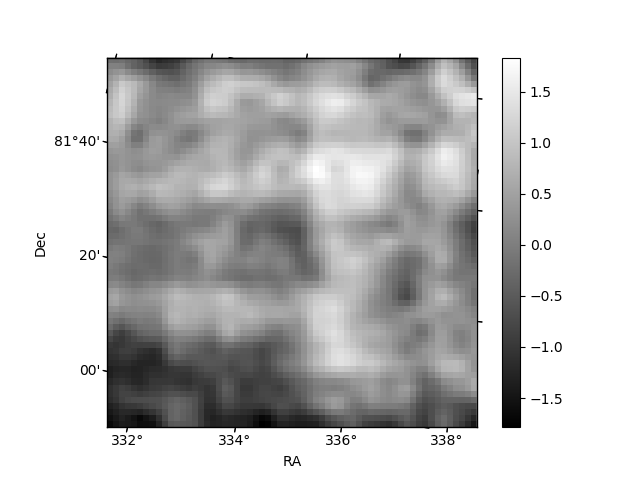
Histogram calculated using DETX and DETY for each event in the final _common_clean file
| Quadrant A | 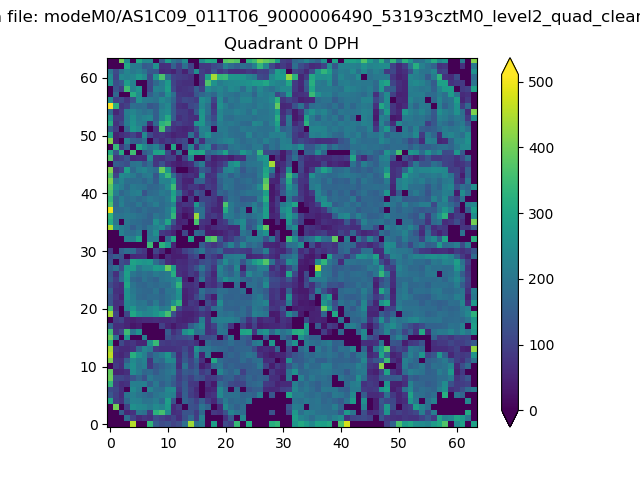 |
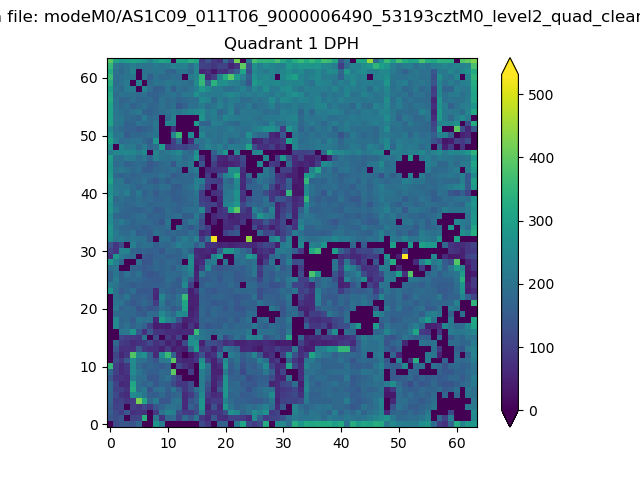 |
Quadrant B |
|---|---|---|---|
| Quadrant D | 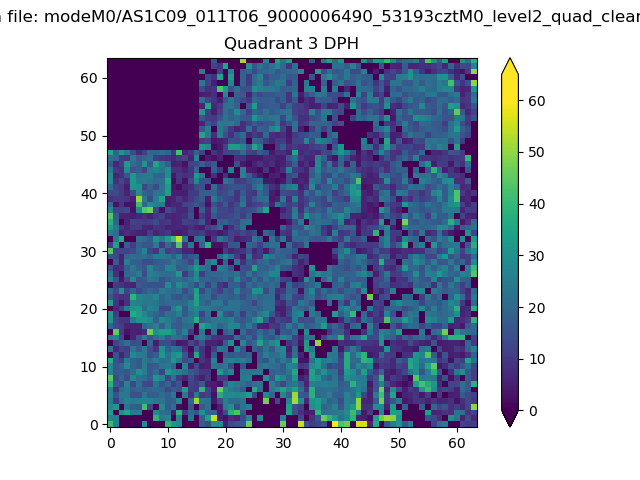 |
 |
Quadrant C |
| Plot type | Count rate plots | Images |
|---|---|---|
| Comparison with Poisson distribution Blue bars denote a histogram of data divided into 1 sec bins. Red curve is a Poisson curve with rate = median count rate of data. |
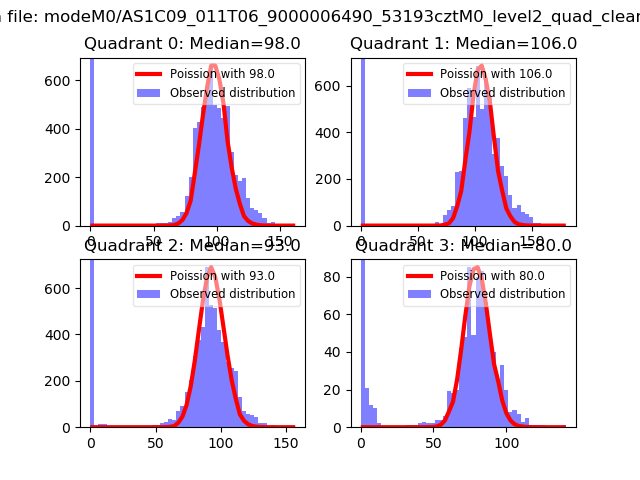 |
 |
| Quadrant-wise count rates Data is divided into 100 sec bins |
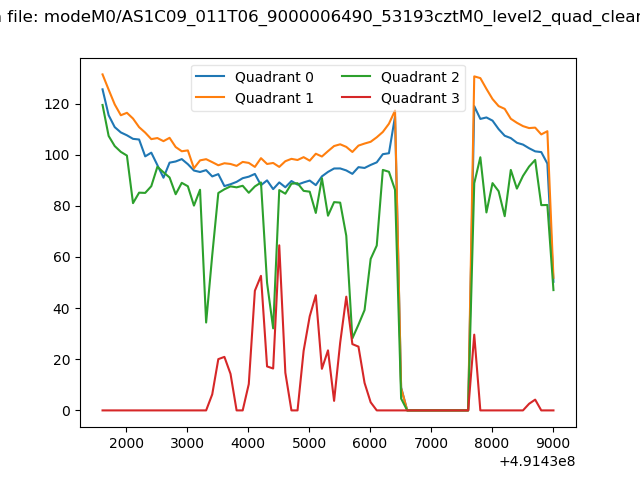 |
|
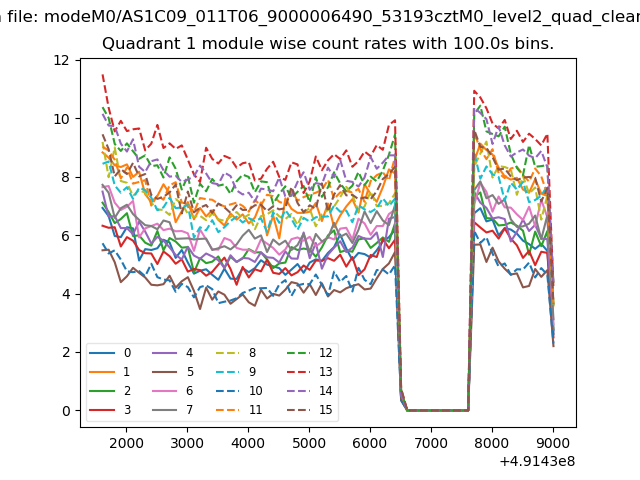
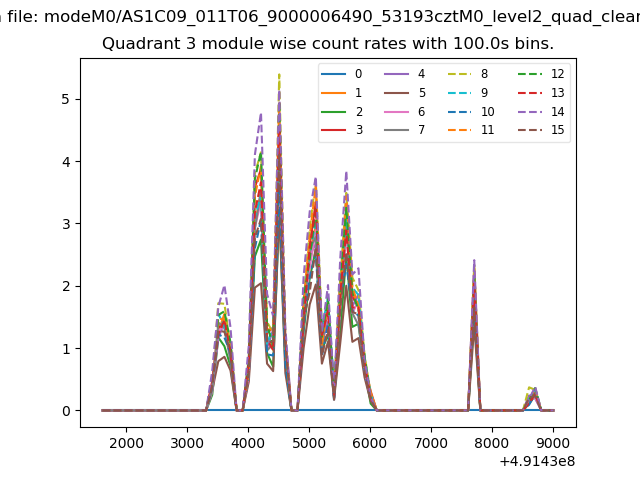
| Module-wise count rates for Quadrant A Data is divided into 100 sec bins |
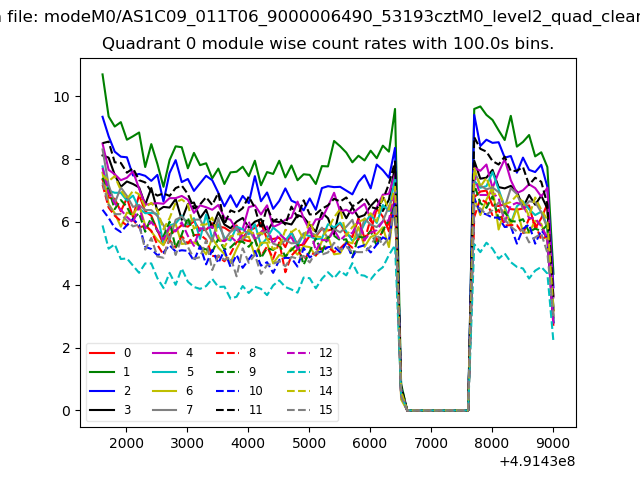 |
 |
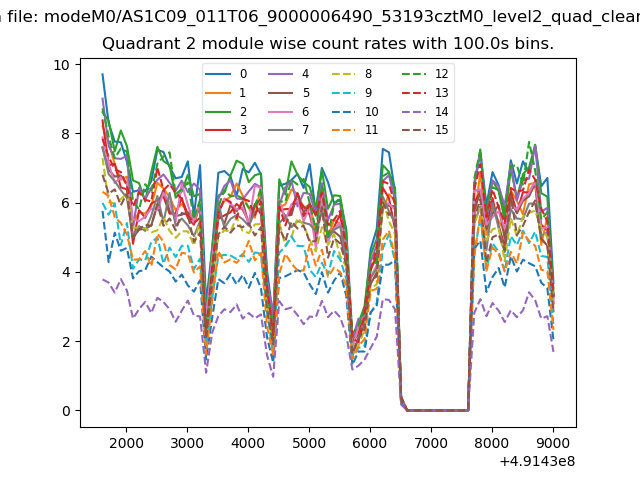
| Module-wise count rates for Quadrant B Data is divided into 100 sec bins |
 |
 |
| Module-wise count rates for Quadrant C Data is divided into 100 sec bins |
 |
 |
| Module-wise count rates for Quadrant D Data is divided into 100 sec bins |
 |
 |
| Parameter | Plot |
|---|---|
| CZT HV Monitor | 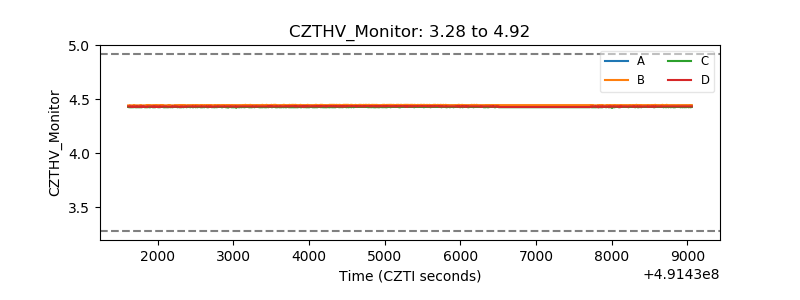 |
| D_VDD | 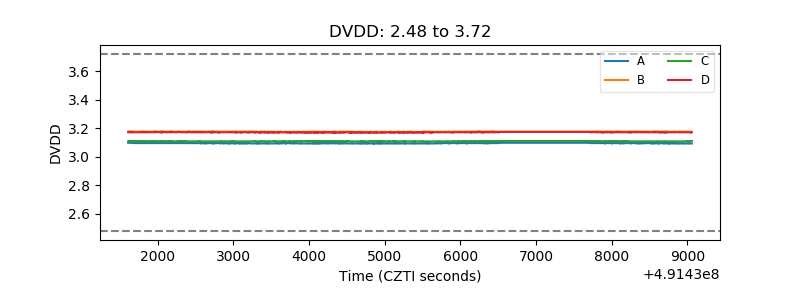 |
| Temperature 1 | 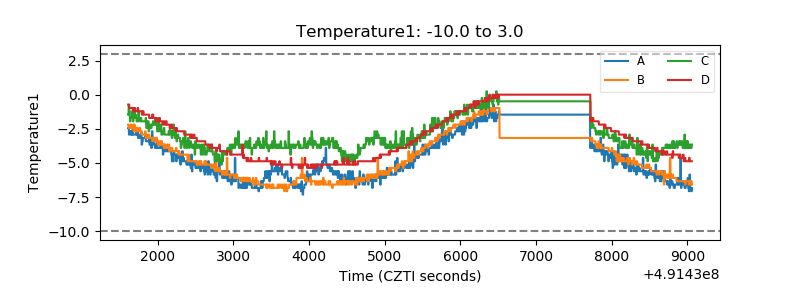 |
| Veto HV Monitor | 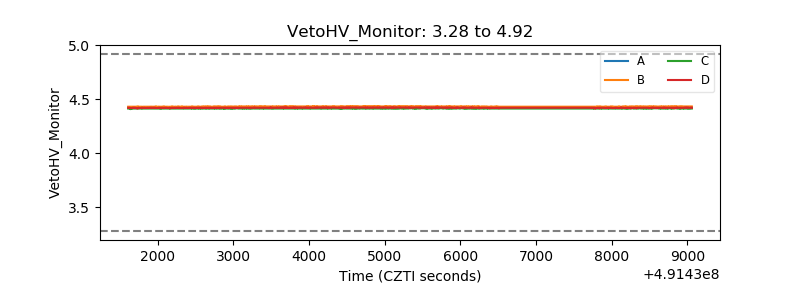 |
| Veto LLD | 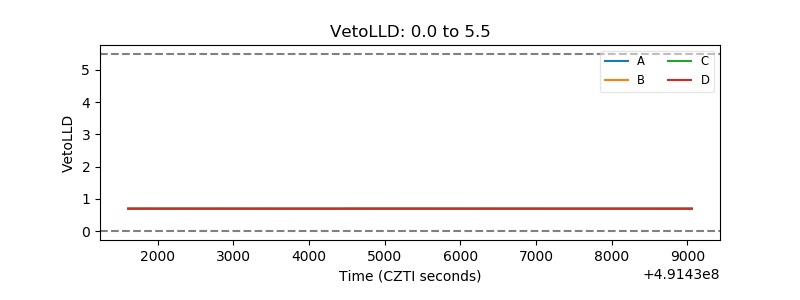 |
| Alpha Counter | 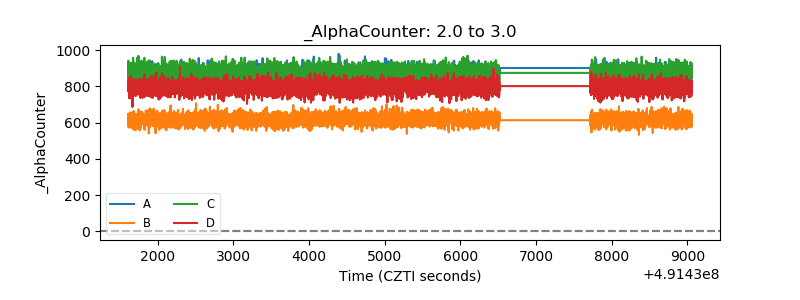 |
| _CPM_Rate | 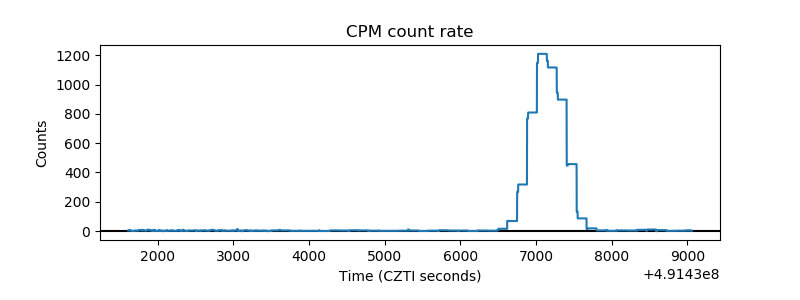 |
| CZT Counter | 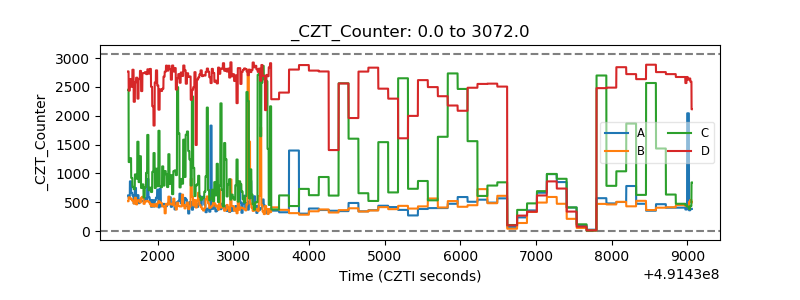 |
| +2.5 Volts monitor |  |
| +5 Volts monitor | 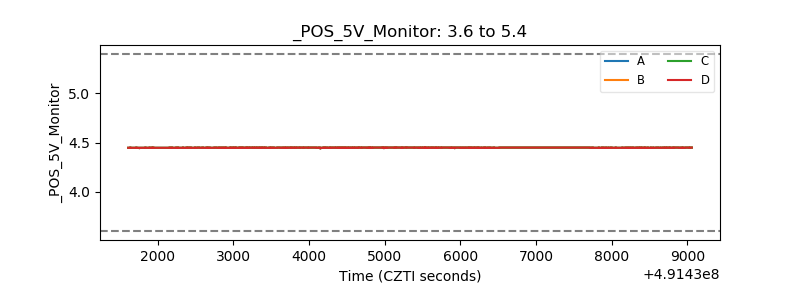 |
| _ROLL_ROT | 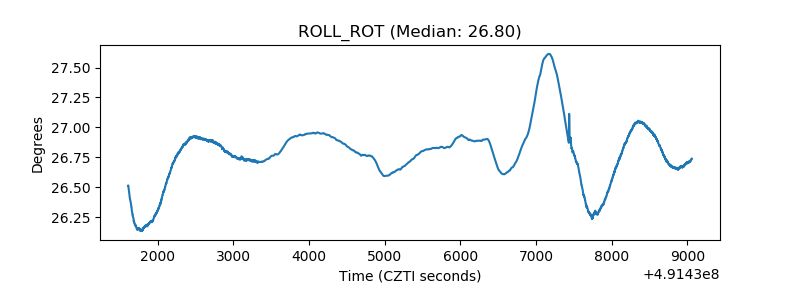 |
| _Roll_DEC | 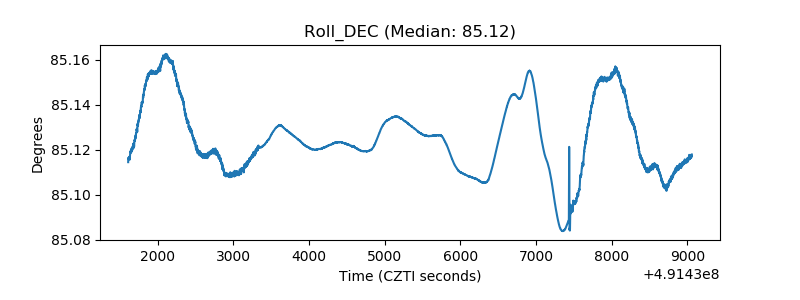 |
| _Roll_RA | 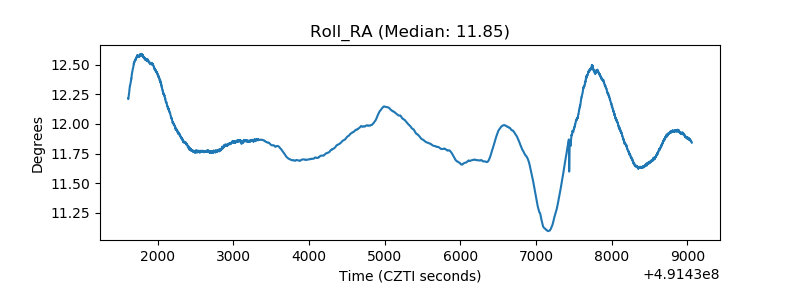 |
| Veto Counter | 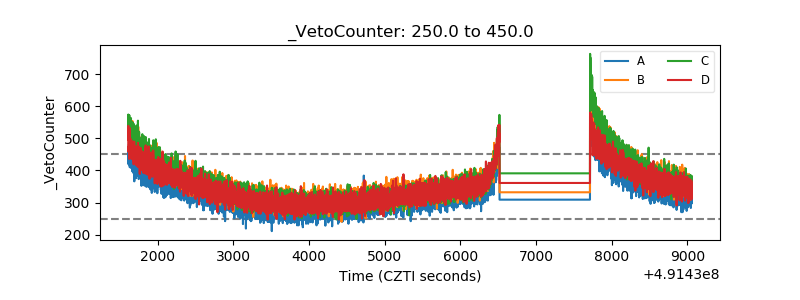 |