| Param | Original file | Final file |
|---|---|---|
| Filename | modeM0/AS1C09_011T06_9000006490_53194cztM0_level2.fits | modeM0/AS1C09_011T06_9000006490_53194cztM0_level2_quad_clean.evt |
| Size (bytes) | 812,350,080 | 79,842,240 |
| Size | 774.7 MB | 76.1 MB |
| Events in quadrant A | 3,033,253 | 633,065 |
| Events in quadrant B | 3,238,760 | 687,594 |
| Events in quadrant C | 7,999,215 | 508,811 |
| Events in quadrant D | 15,307,141 | 144,894 |
| Mode M9 | |||
|---|---|---|---|
| Quadrant | BADHDUFLAG | Total packets | Discarded packets |
| A | 0 | 22 | 0 |
| B | 0 | 22 | 0 |
| C | 0 | 23 | 0 |
| D | 0 | 23 | 0 |
| Mode SS | |||
|---|---|---|---|
| Quadrant | BADHDUFLAG | Total packets | Discarded packets |
| A | 0 | 128 | 0 |
| B | 0 | 128 | 0 |
| C | 0 | 128 | 0 |
| D | 0 | 128 | 0 |
| Mode M0 | |||
|---|---|---|---|
| Quadrant | BADHDUFLAG | Total packets | Discarded packets |
| A | 0 | 13882 | 2 |
| B | 0 | 14024 | 2 |
| C | 0 | 28101 | 2 |
| D | 0 | 49800 | 4 |
| Quadrant | Total seconds | Saturated seconds | Saturation percentage |
|---|---|---|---|
| A | 6352 | 83 | 1.306675% |
| B | 6352 | 61 | 0.960327% |
| C | 6352 | 1392 | 21.914358% |
| D | 6351 | 5037 | 79.310345% |
Noise dominated data is calculated using 1-second bins in cleaned event files. If a bin has >2000 counts, and if more than 50% of those come from <1% of pixels, then it is considered to be noise-dominated and hence unusable.
| Quadrant | # 1 sec bins | Bins with >0 counts | Bins with >2000 counts | High rate bins dominated by noise | Noise dominated (total time) | Noise dominated (detector-on time) | Marked lightcurve |
|---|---|---|---|---|---|---|---|
| A | 7562 | 6352 | 43 | 43 | 0.57% | 0.68% | 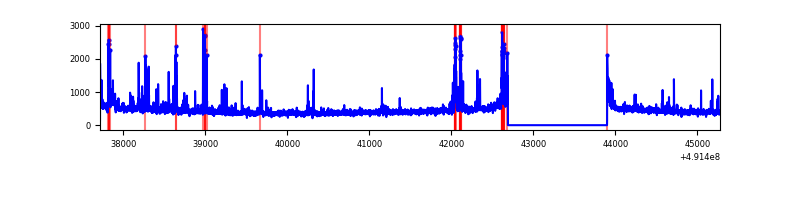 |
| B | 7562 | 6353 | 21 | 21 | 0.28% | 0.33% | 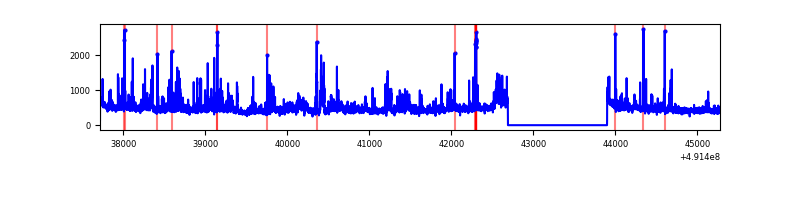 |
| C | 7562 | 6353 | 1450 | 1450 | 19.17% | 22.82% | 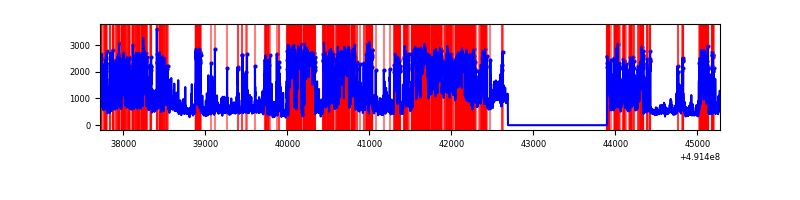 |
| D | 7560 | 6350 | 5245 | 5245 | 69.38% | 82.60% | 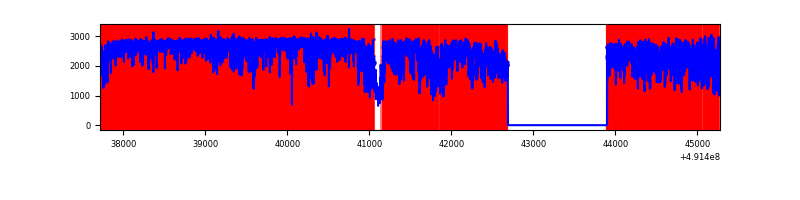 |
Top three noisy pixels from each quadrant. If the there are fewer than three noisy pixels in the level2.evt file, extra rows are filled as -1
| Pixel properties | Quadrant properties | ||||||
|---|---|---|---|---|---|---|---|
| Quadrant | DetID | PixID | Counts | Sigma | Mean | Median | Sigma |
| A | 0 | 8 | 103926 | 618.41 | 665 | 648 | 167.0 |
| A | 15 | 174 | 86236 | 512.49 | 665 | 648 | 167.0 |
| A | 3 | 62 | 77894 | 462.54 | 665 | 648 | 167.0 |
| B | 4 | 81 | 147721 | 1048.47 | 668 | 646 | 140.3 |
| B | 1 | 255 | 132245 | 938.15 | 668 | 646 | 140.3 |
| B | 0 | 213 | 53292 | 375.3 | 668 | 646 | 140.3 |
| C | 0 | 240 | 1812068 | 10692.06 | 613 | 606 | 169.4 |
| C | 15 | 224 | 1561043 | 9210.4 | 613 | 606 | 169.4 |
| C | 1 | 241 | 981864 | 5791.82 | 613 | 606 | 169.4 |
| D | 15 | 125 | 12048809 | 99050.3 | 416 | 396 | 121.6 |
| D | 12 | 3 | 378653 | 3109.66 | 416 | 396 | 121.6 |
| D | 2 | 62 | 280441 | 2302.26 | 416 | 396 | 121.6 |
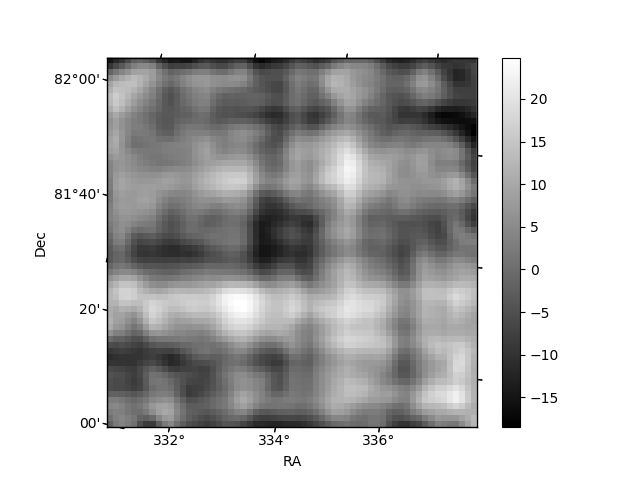
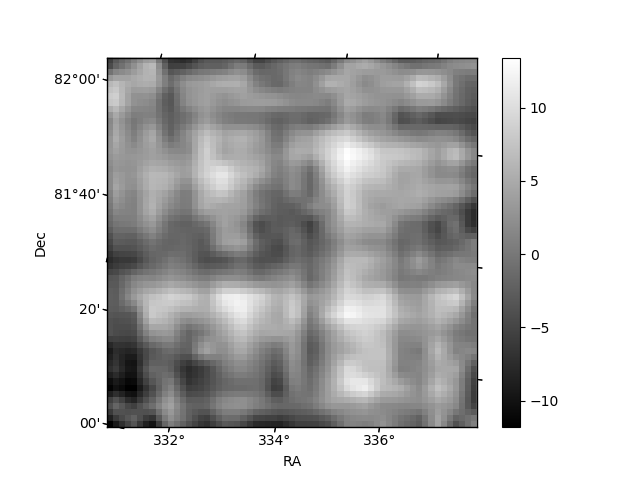
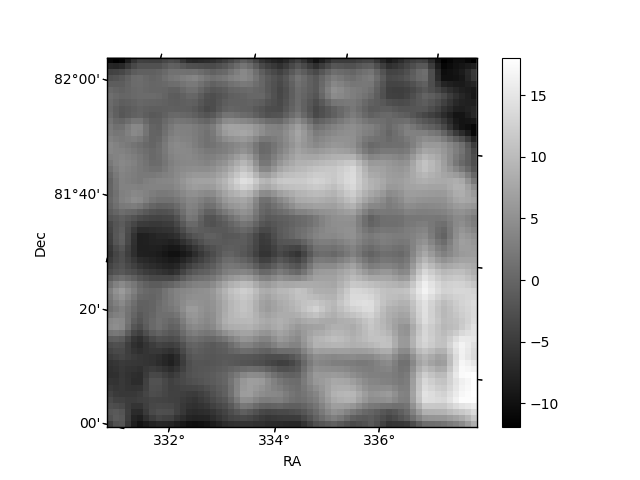
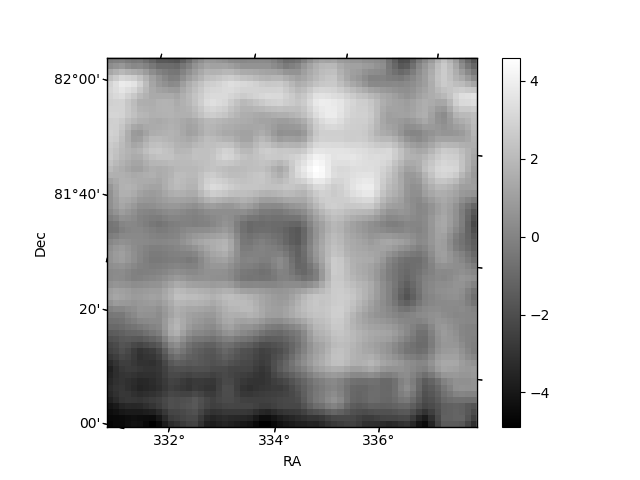
Histogram calculated using DETX and DETY for each event in the final _common_clean file
| Quadrant A | 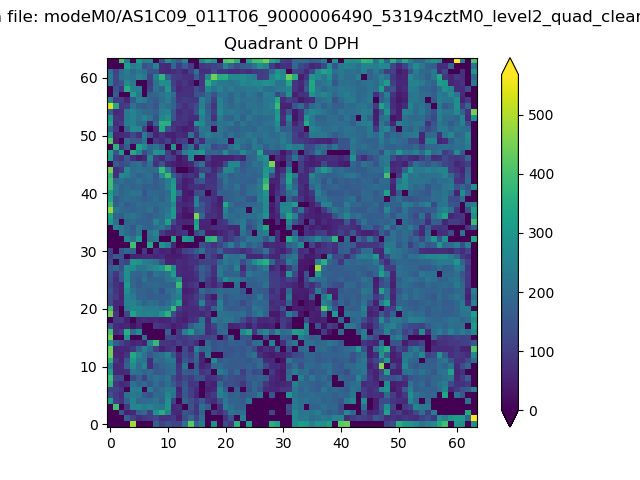 |
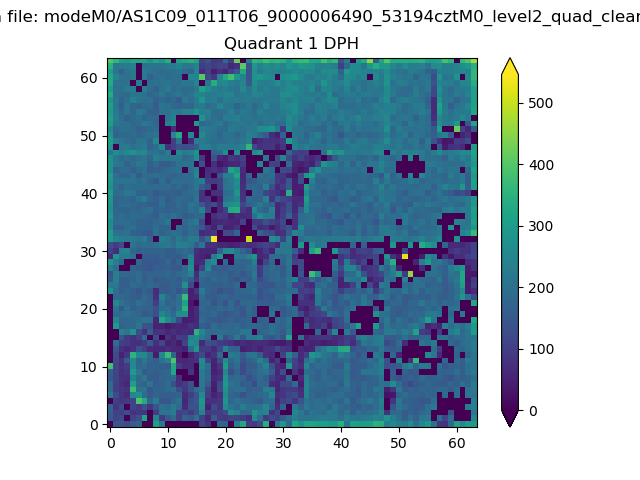 |
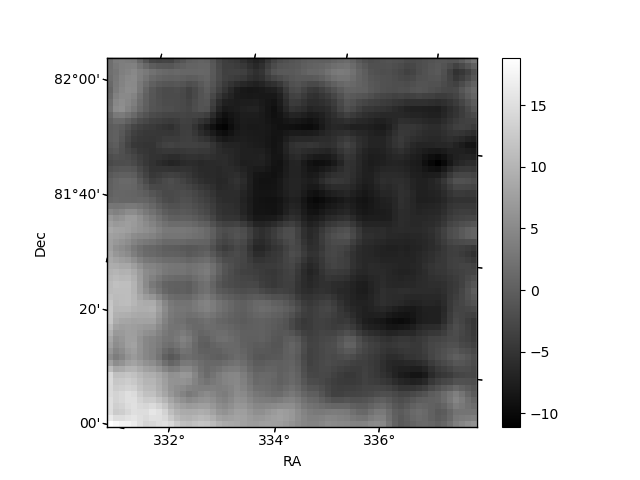
Quadrant B |
|---|---|---|---|
| Quadrant D | 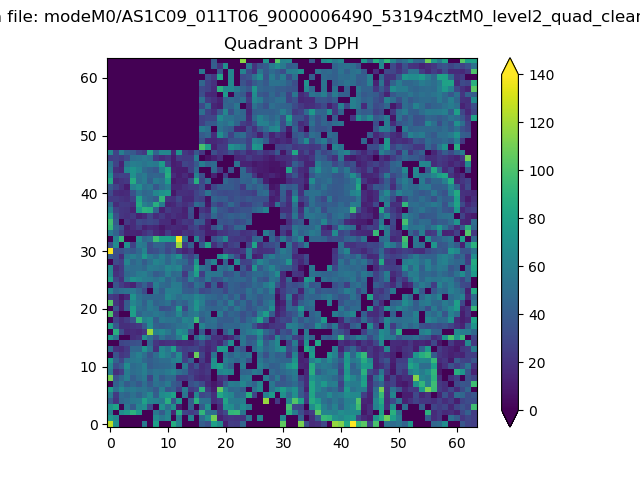 |
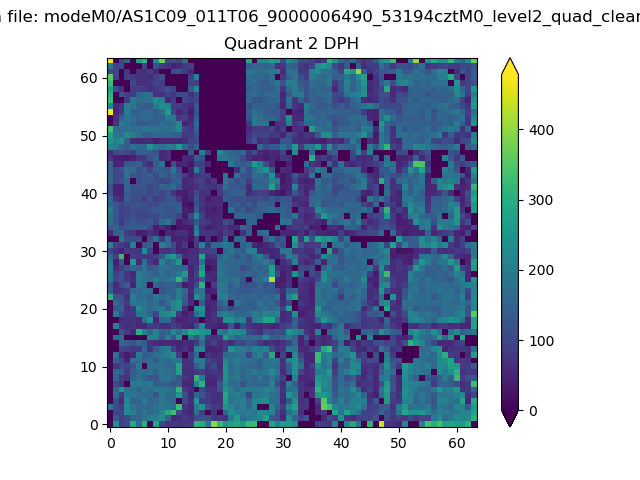 |
Quadrant C |
| Plot type | Count rate plots | Images |
|---|---|---|
| Comparison with Poisson distribution Blue bars denote a histogram of data divided into 1 sec bins. Red curve is a Poisson curve with rate = median count rate of data. |
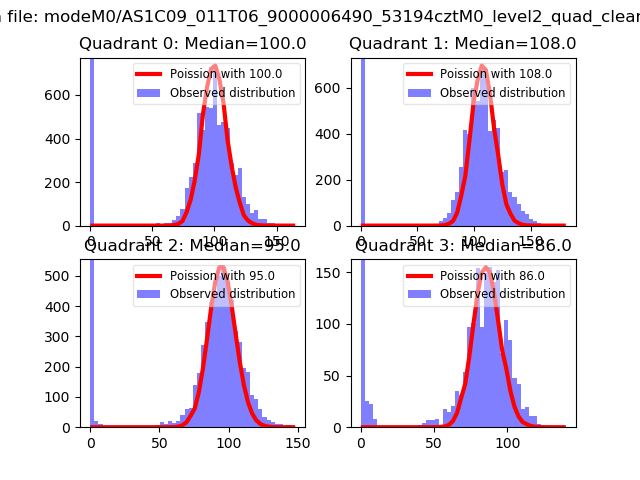 |
 |
| Quadrant-wise count rates Data is divided into 100 sec bins |
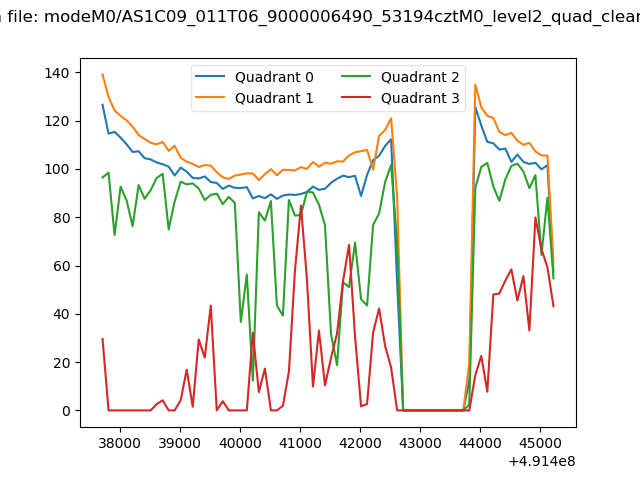 |
|
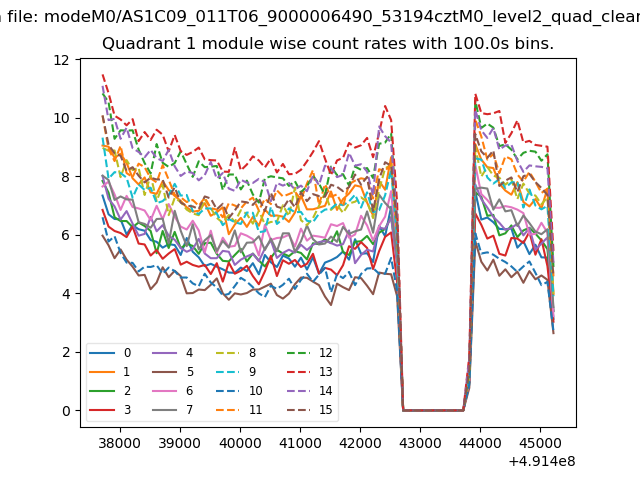
| Module-wise count rates for Quadrant A Data is divided into 100 sec bins |
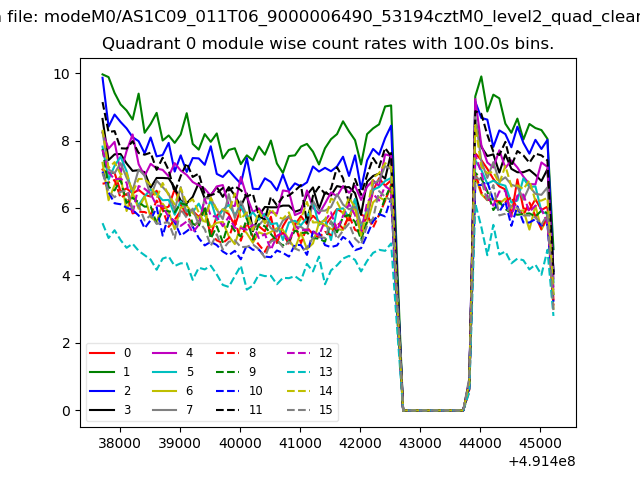 |
 |
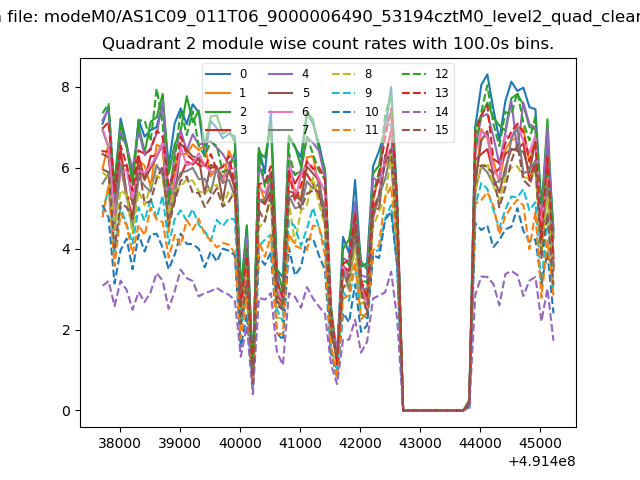
| Module-wise count rates for Quadrant B Data is divided into 100 sec bins |
 |
 |
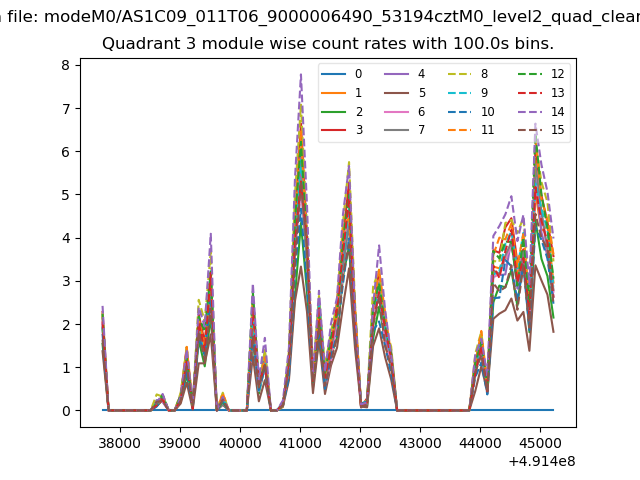
| Module-wise count rates for Quadrant C Data is divided into 100 sec bins |
 |
 |
| Module-wise count rates for Quadrant D Data is divided into 100 sec bins |
 |
 |
| Parameter | Plot |
|---|---|
| CZT HV Monitor | 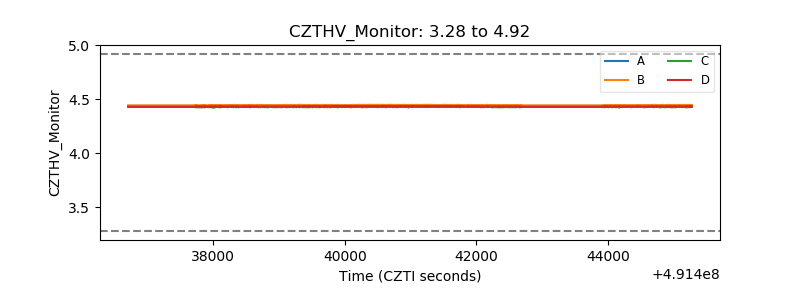 |
| D_VDD | 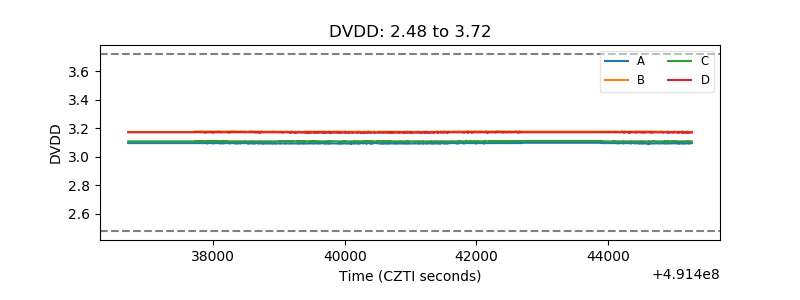 |
| Temperature 1 | 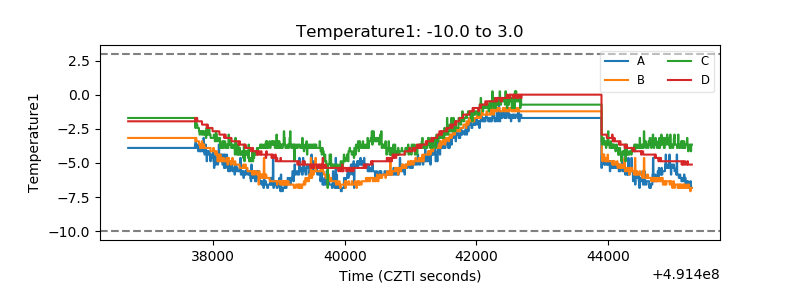 |
| Veto HV Monitor | 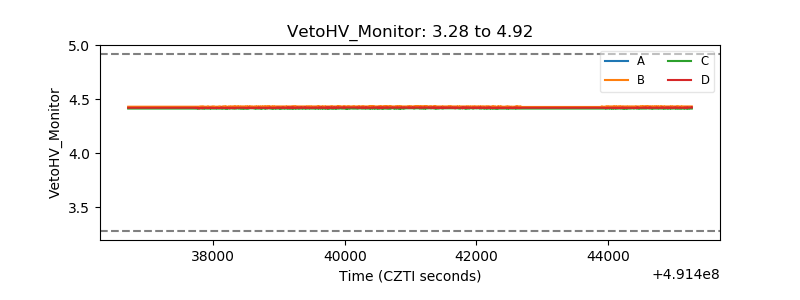 |
| Veto LLD | 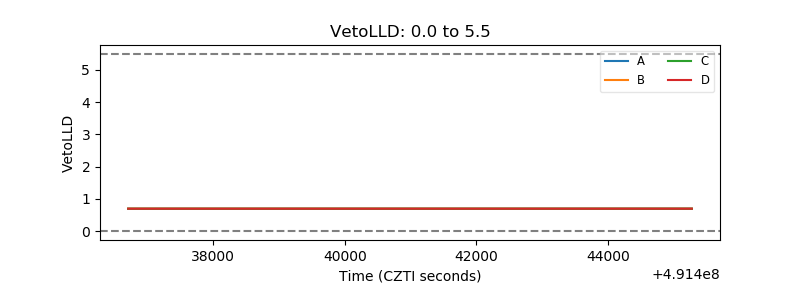 |
| Alpha Counter | 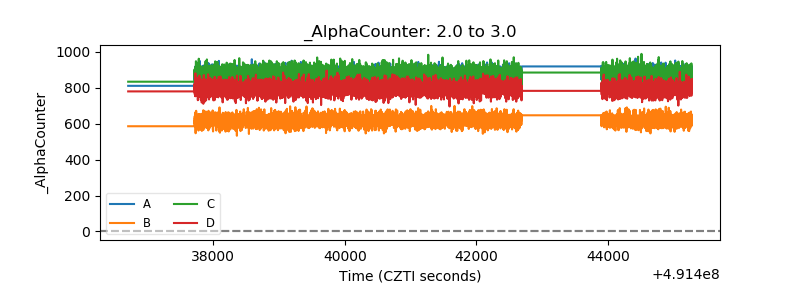 |
| _CPM_Rate | 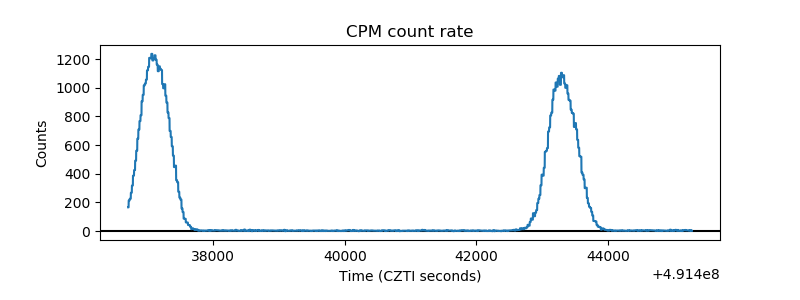 |
| CZT Counter | 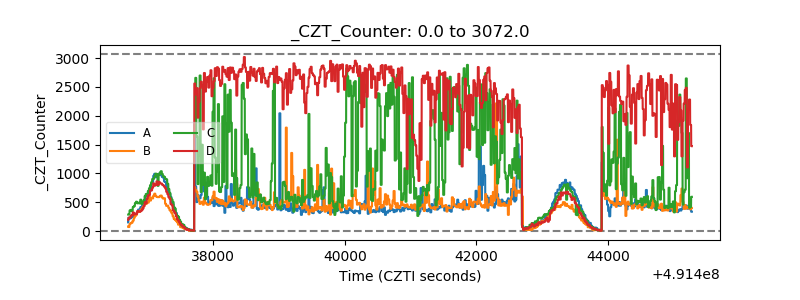 |
| +2.5 Volts monitor | 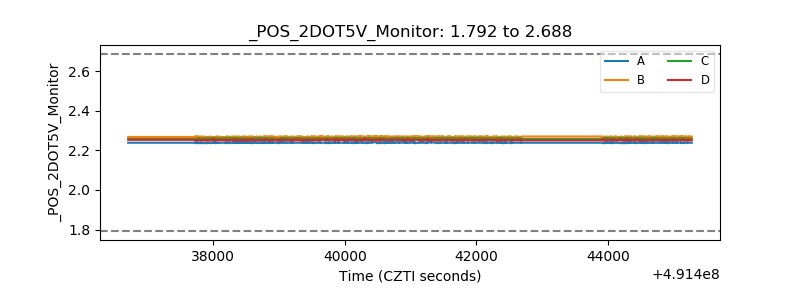 |
| +5 Volts monitor |  |
| _ROLL_ROT | 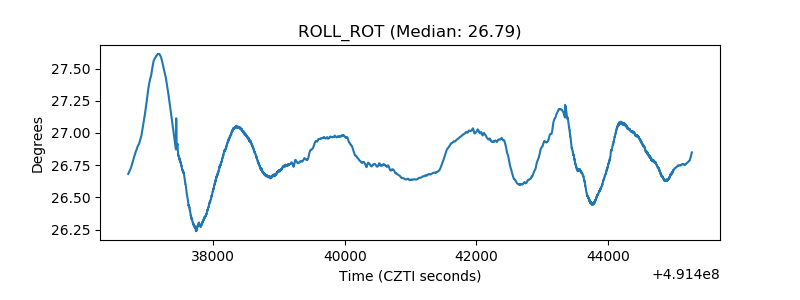 |
| _Roll_DEC | 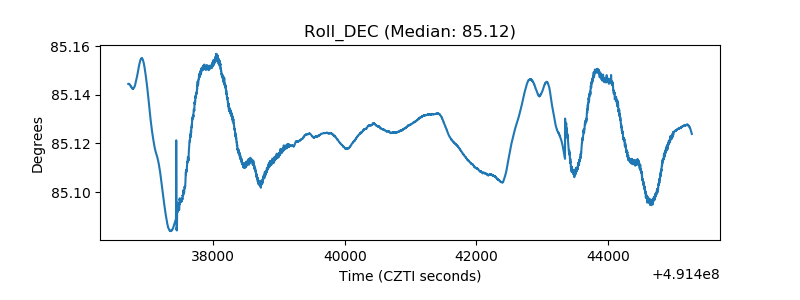 |
| _Roll_RA | 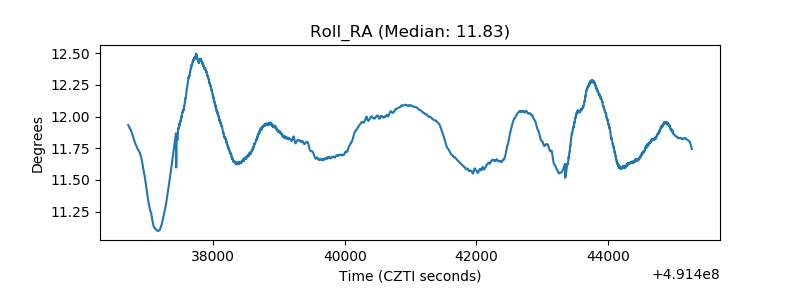 |
| Veto Counter | 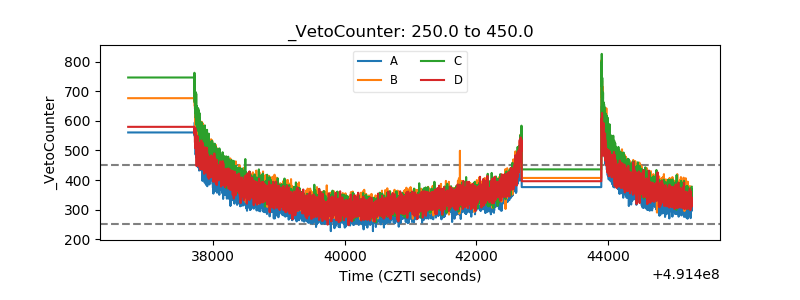 |