| Param | Original file | Final file |
|---|---|---|
| Filename | modeM0/AS1C09_011T06_9000006490_53196cztM0_level2.fits | modeM0/AS1C09_011T06_9000006490_53196cztM0_level2_quad_clean.evt |
| Size (bytes) | 785,744,640 | 75,481,920 |
| Size | 749.3 MB | 72.0 MB |
| Events in quadrant A | 3,316,529 | 586,892 |
| Events in quadrant B | 3,655,829 | 617,804 |
| Events in quadrant C | 7,858,912 | 430,179 |
| Events in quadrant D | 13,773,429 | 216,644 |
| Mode M9 | |||
|---|---|---|---|
| Quadrant | BADHDUFLAG | Total packets | Discarded packets |
| A | 0 | 11 | 0 |
| B | 0 | 11 | 0 |
| C | 0 | 11 | 0 |
| D | 0 | 11 | 0 |
| Mode SS | |||
|---|---|---|---|
| Quadrant | BADHDUFLAG | Total packets | Discarded packets |
| A | 0 | 126 | 0 |
| B | 0 | 126 | 0 |
| C | 0 | 126 | 0 |
| D | 0 | 126 | 0 |
| Mode M0 | |||
|---|---|---|---|
| Quadrant | BADHDUFLAG | Total packets | Discarded packets |
| A | 0 | 14567 | 2 |
| B | 0 | 15508 | 1 |
| C | 0 | 27674 | 1 |
| D | 0 | 45193 | 1 |
| Quadrant | Total seconds | Saturated seconds | Saturation percentage |
|---|---|---|---|
| A | 6213 | 100 | 1.609528% |
| B | 6214 | 209 | 3.363373% |
| C | 6214 | 1671 | 26.890892% |
| D | 6214 | 3902 | 62.793692% |
Noise dominated data is calculated using 1-second bins in cleaned event files. If a bin has >2000 counts, and if more than 50% of those come from <1% of pixels, then it is considered to be noise-dominated and hence unusable.
| Quadrant | # 1 sec bins | Bins with >0 counts | Bins with >2000 counts | High rate bins dominated by noise | Noise dominated (total time) | Noise dominated (detector-on time) | Marked lightcurve |
|---|---|---|---|---|---|---|---|
| A | 7298 | 6214 | 75 | 75 | 1.03% | 1.21% | 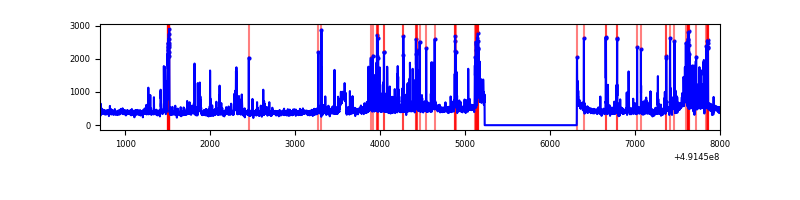 |
| B | 7299 | 6215 | 163 | 163 | 2.23% | 2.62% | 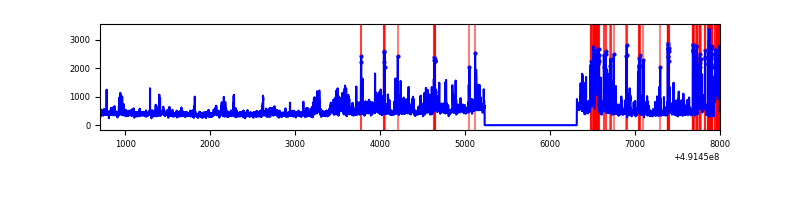 |
| C | 7298 | 6214 | 1714 | 1714 | 23.49% | 27.58% | 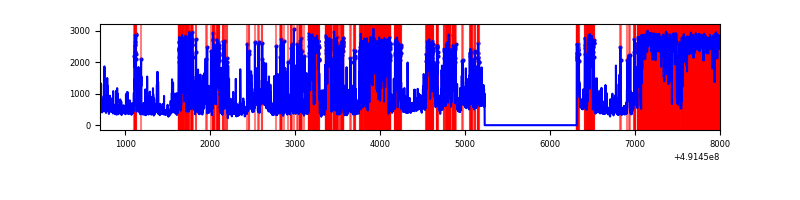 |
| D | 7298 | 6213 | 4328 | 4328 | 59.30% | 69.66% | 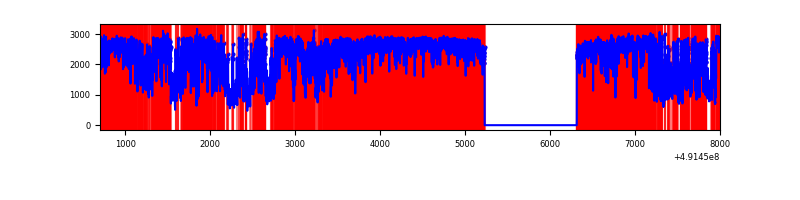 |
Top three noisy pixels from each quadrant. If the there are fewer than three noisy pixels in the level2.evt file, extra rows are filled as -1
| Pixel properties | Quadrant properties | ||||||
|---|---|---|---|---|---|---|---|
| Quadrant | DetID | PixID | Counts | Sigma | Mean | Median | Sigma |
| A | 0 | 8 | 222444 | 1426.62 | 623 | 608 | 155.5 |
| A | 3 | 62 | 177947 | 1140.46 | 623 | 608 | 155.5 |
| A | 4 | 77 | 132865 | 850.54 | 623 | 608 | 155.5 |
| B | 2 | 249 | 490123 | 3742.36 | 617 | 596 | 130.8 |
| B | 0 | 213 | 315919 | 2410.6 | 617 | 596 | 130.8 |
| B | 4 | 81 | 174224 | 1327.36 | 617 | 596 | 130.8 |
| C | 0 | 240 | 2734945 | 18247.25 | 540 | 535 | 149.9 |
| C | 15 | 224 | 2009982 | 13409.43 | 540 | 535 | 149.9 |
| C | 12 | 252 | 237250 | 1579.64 | 540 | 535 | 149.9 |
| D | 15 | 125 | 8862822 | 73812.65 | 410 | 390 | 120.1 |
| D | 10 | 117 | 2375307 | 19780.0 | 410 | 390 | 120.1 |
| D | 13 | 170 | 280491 | 2332.88 | 410 | 390 | 120.1 |
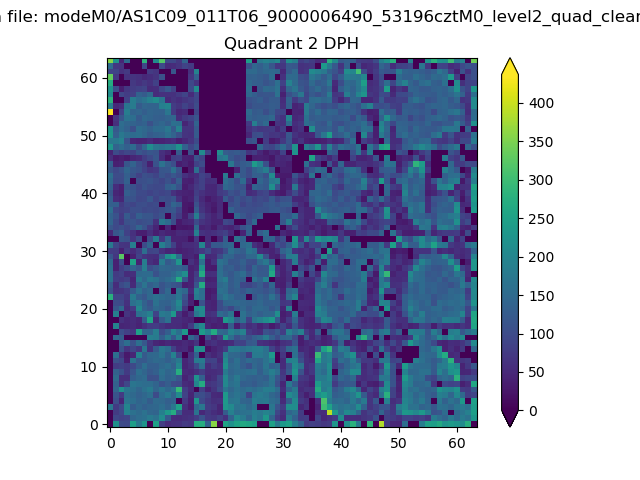
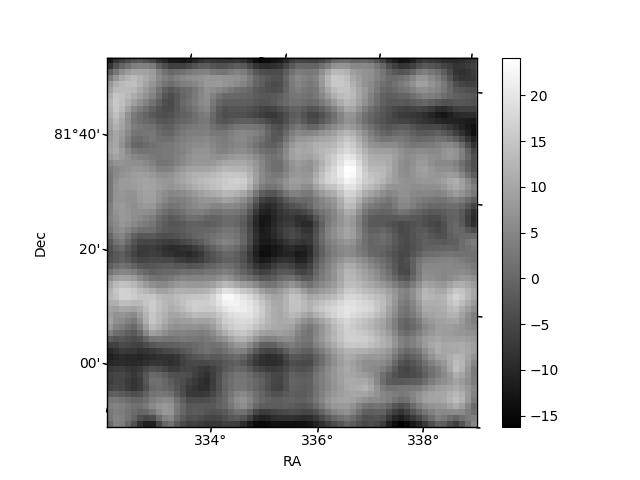
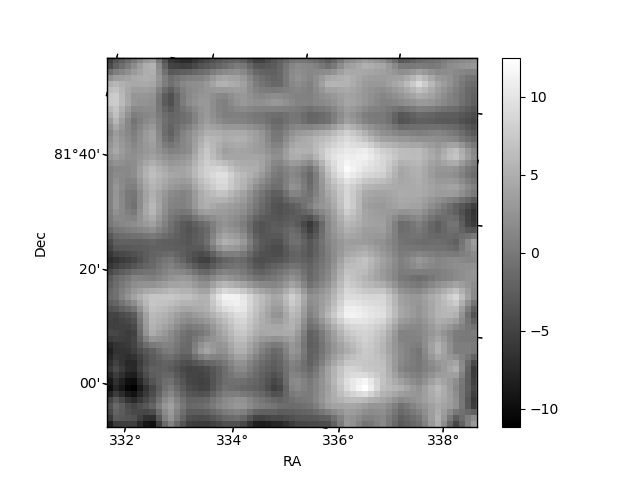
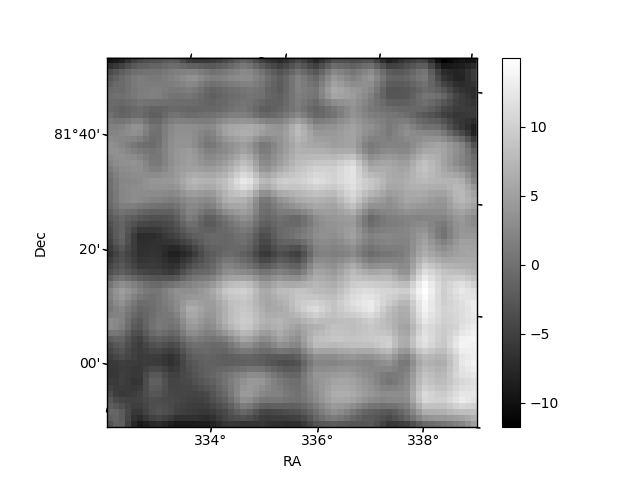
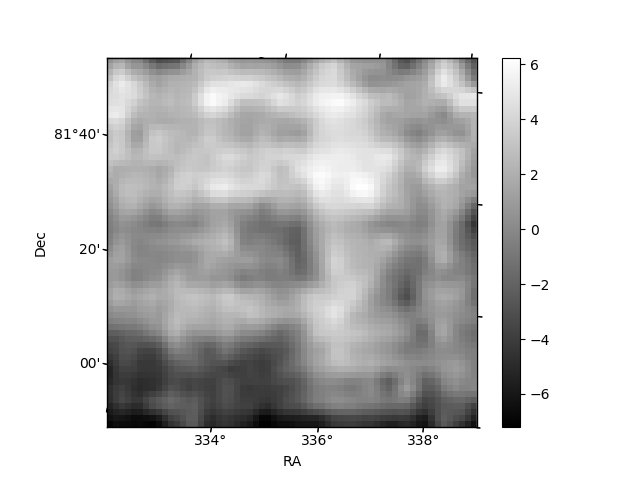
Histogram calculated using DETX and DETY for each event in the final _common_clean file
| Quadrant A | 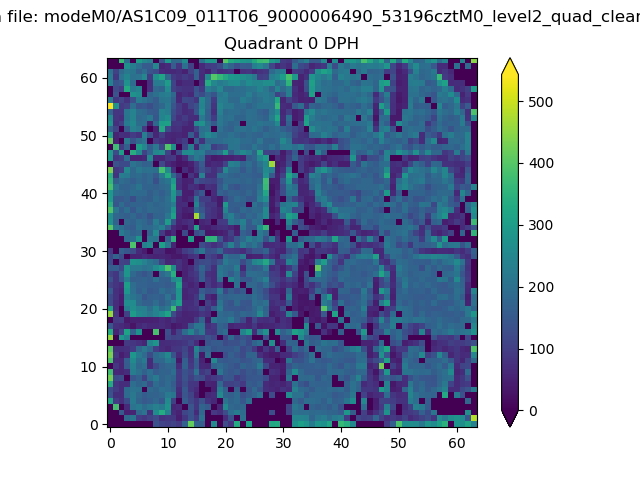 |
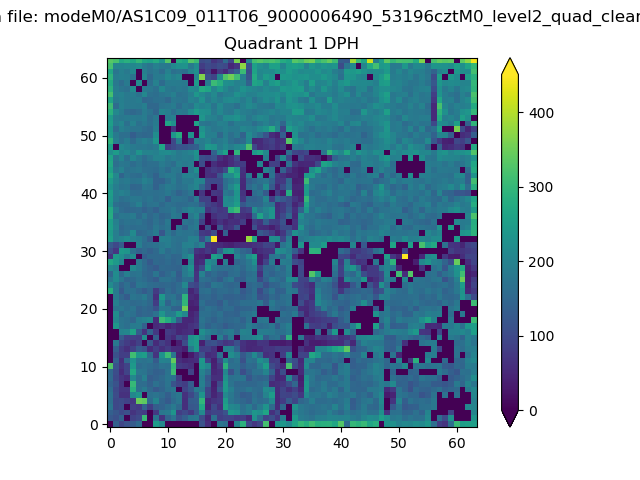 |
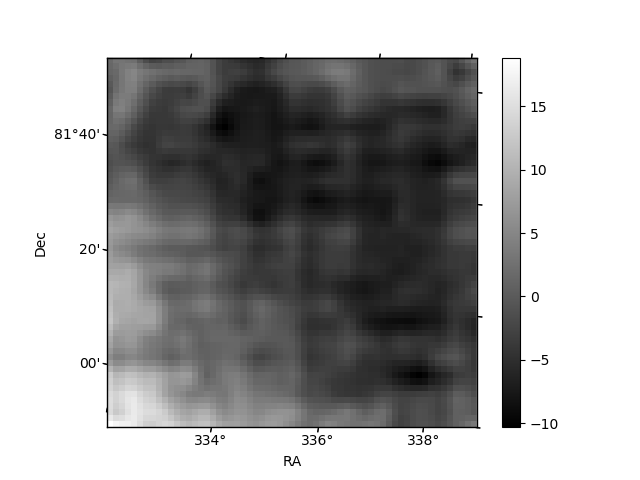
Quadrant B |
|---|---|---|---|
| Quadrant D | 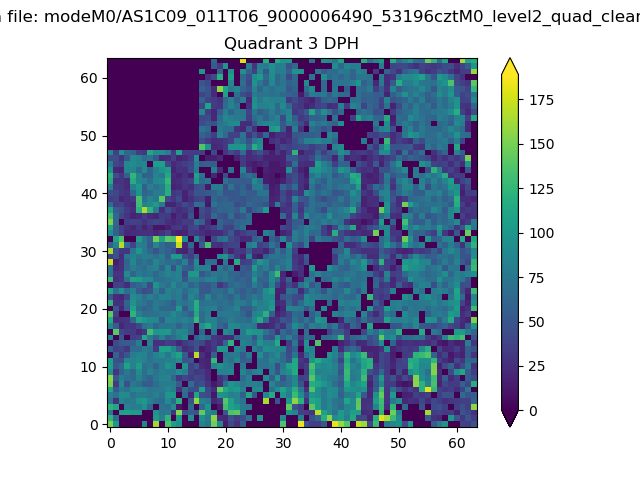 |
 |
Quadrant C |
| Plot type | Count rate plots | Images |
|---|---|---|
| Comparison with Poisson distribution Blue bars denote a histogram of data divided into 1 sec bins. Red curve is a Poisson curve with rate = median count rate of data. |
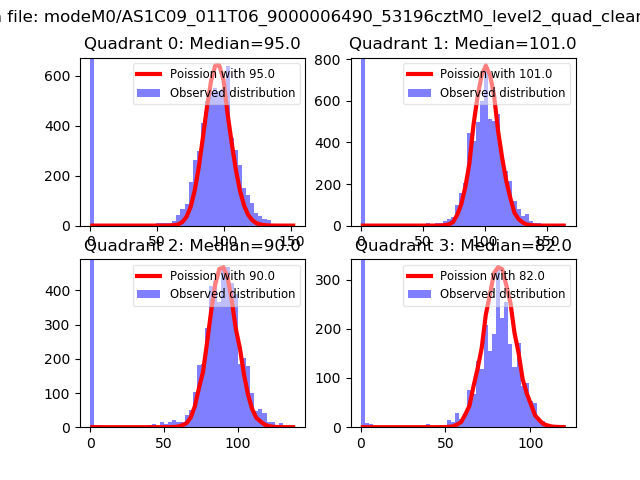 |
 |
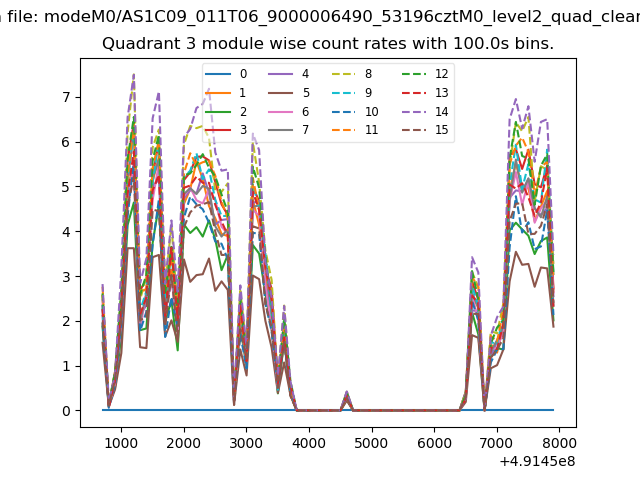
| Quadrant-wise count rates Data is divided into 100 sec bins |
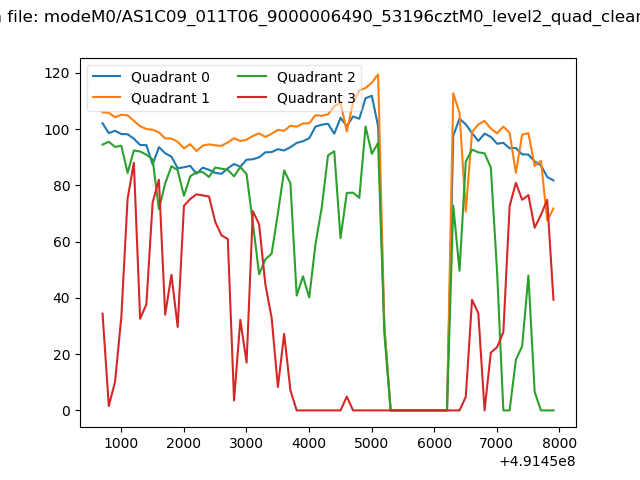 |
|
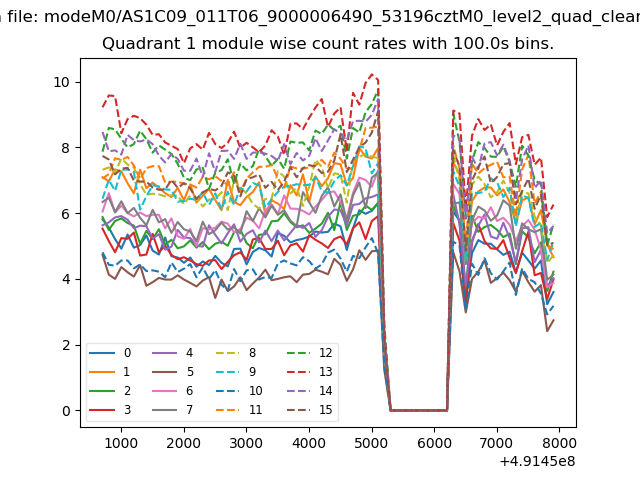
| Module-wise count rates for Quadrant A Data is divided into 100 sec bins |
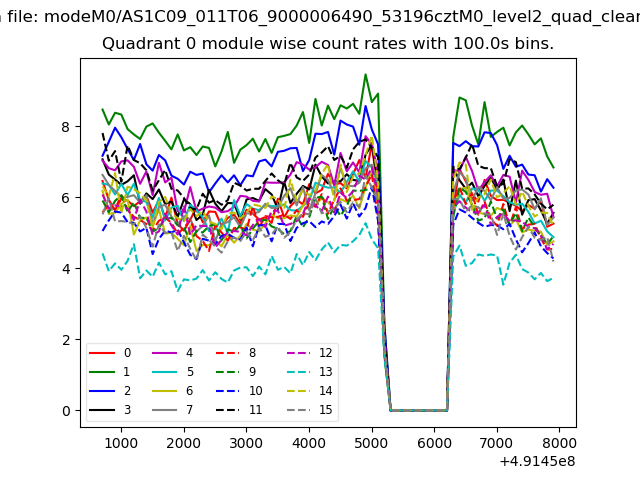 |
 |
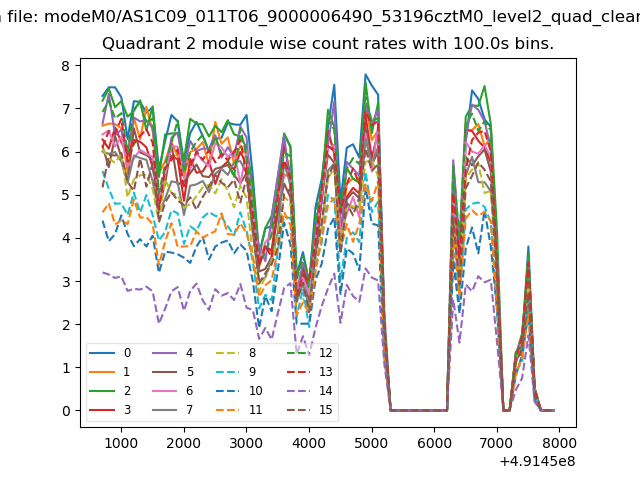
| Module-wise count rates for Quadrant B Data is divided into 100 sec bins |
 |
 |
| Module-wise count rates for Quadrant C Data is divided into 100 sec bins |
 |
 |
| Module-wise count rates for Quadrant D Data is divided into 100 sec bins |
 |
 |
| Parameter | Plot |
|---|---|
| CZT HV Monitor | 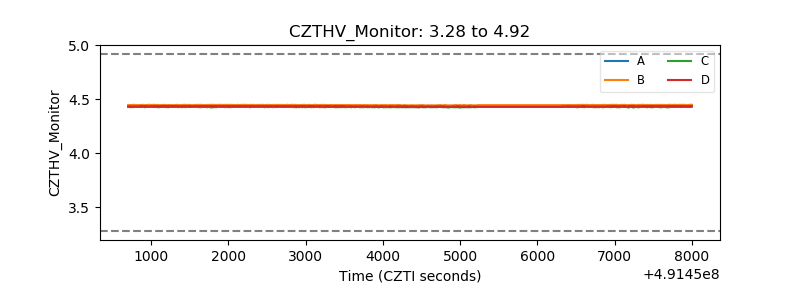 |
| D_VDD | 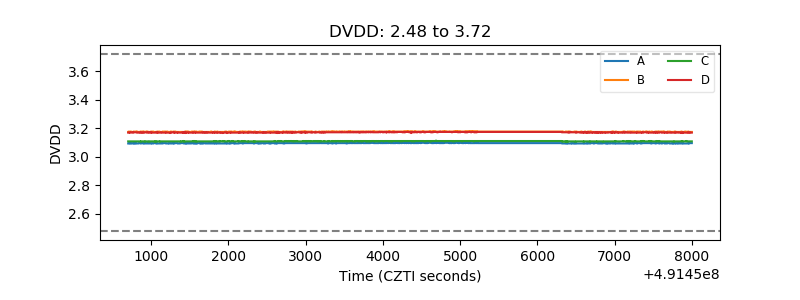 |
| Temperature 1 | 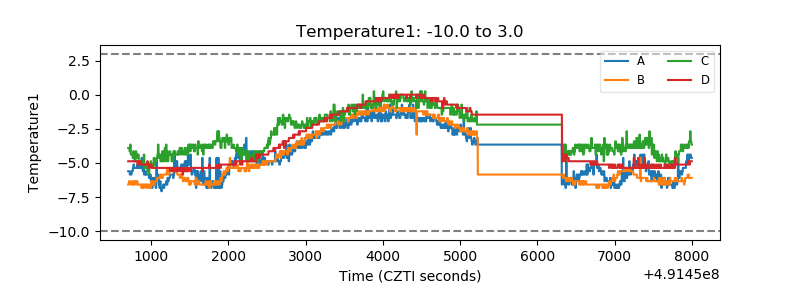 |
| Veto HV Monitor |  |
| Veto LLD | 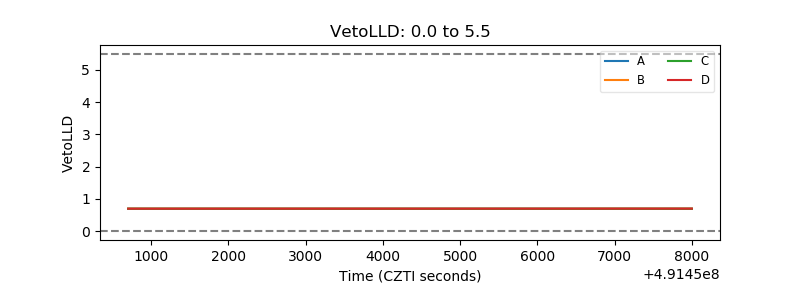 |
| Alpha Counter | 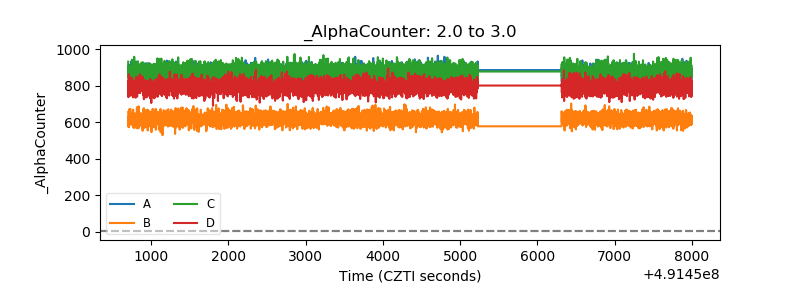 |
| _CPM_Rate | 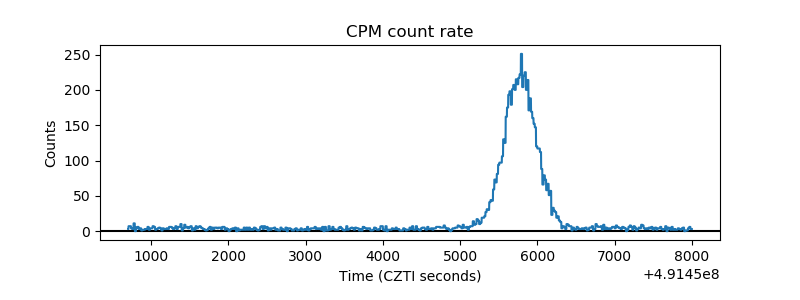 |
| CZT Counter | 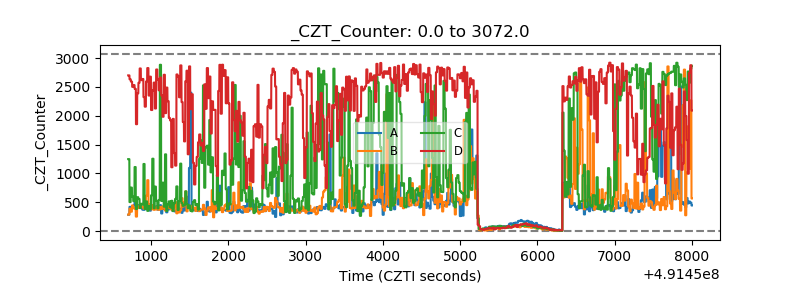 |
| +2.5 Volts monitor |  |
| +5 Volts monitor |  |
| _ROLL_ROT |  |
| _Roll_DEC | 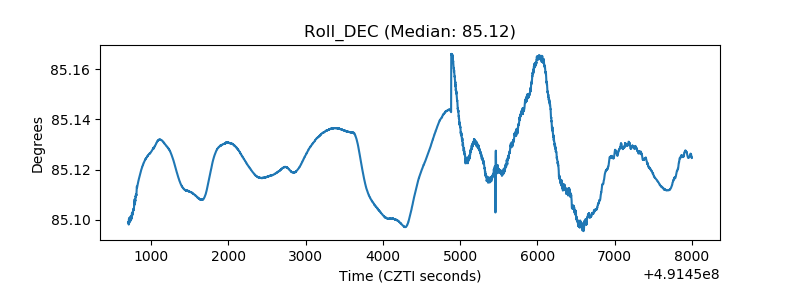 |
| _Roll_RA | 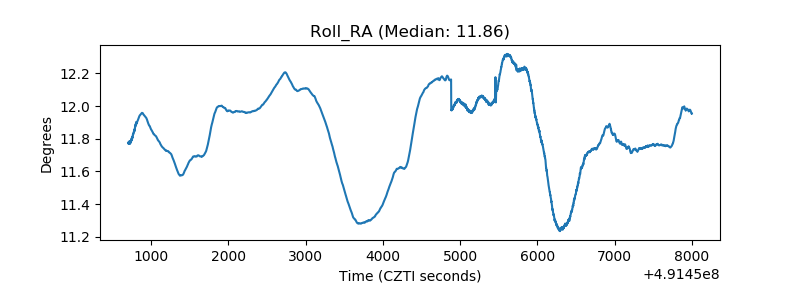 |
| Veto Counter | 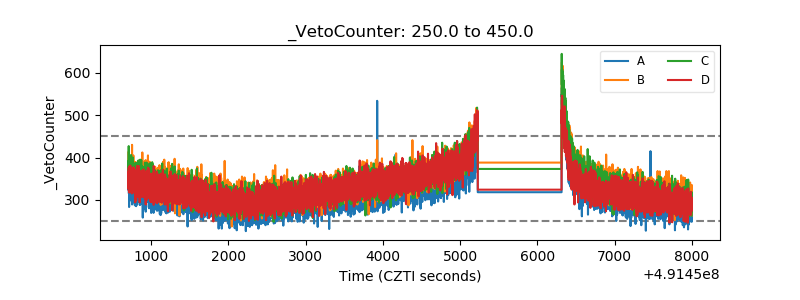 |