| Param | Original file | Final file |
|---|---|---|
| Filename | modeM0/AS1C09_011T06_9000006490_53197cztM0_level2.fits | modeM0/AS1C09_011T06_9000006490_53197cztM0_level2_quad_clean.evt |
| Size (bytes) | 992,730,240 | 65,387,520 |
| Size | 946.7 MB | 62.4 MB |
| Events in quadrant A | 3,451,815 | 590,028 |
| Events in quadrant B | 5,282,428 | 584,673 |
| Events in quadrant C | 11,503,554 | 283,391 |
| Events in quadrant D | 16,021,863 | 80,707 |
| Mode M9 | |||
|---|---|---|---|
| Quadrant | BADHDUFLAG | Total packets | Discarded packets |
| A | 0 | 7 | 0 |
| B | 0 | 7 | 0 |
| C | 0 | 7 | 0 |
| D | 0 | 7 | 0 |
| Mode SS | |||
|---|---|---|---|
| Quadrant | BADHDUFLAG | Total packets | Discarded packets |
| A | 0 | 128 | 0 |
| B | 0 | 128 | 0 |
| C | 0 | 128 | 0 |
| D | 0 | 128 | 0 |
| Mode M0 | |||
|---|---|---|---|
| Quadrant | BADHDUFLAG | Total packets | Discarded packets |
| A | 0 | 14830 | 1 |
| B | 0 | 20243 | 1 |
| C | 0 | 38431 | 1 |
| D | 0 | 51739 | 2 |
| Quadrant | Total seconds | Saturated seconds | Saturation percentage |
|---|---|---|---|
| A | 6315 | 108 | 1.710214% |
| B | 6316 | 689 | 10.908803% |
| C | 6316 | 3442 | 54.496517% |
| D | 6315 | 5455 | 86.381631% |
Noise dominated data is calculated using 1-second bins in cleaned event files. If a bin has >2000 counts, and if more than 50% of those come from <1% of pixels, then it is considered to be noise-dominated and hence unusable.
| Quadrant | # 1 sec bins | Bins with >0 counts | Bins with >2000 counts | High rate bins dominated by noise | Noise dominated (total time) | Noise dominated (detector-on time) | Marked lightcurve |
|---|---|---|---|---|---|---|---|
| A | 6995 | 6316 | 70 | 70 | 1.00% | 1.11% | 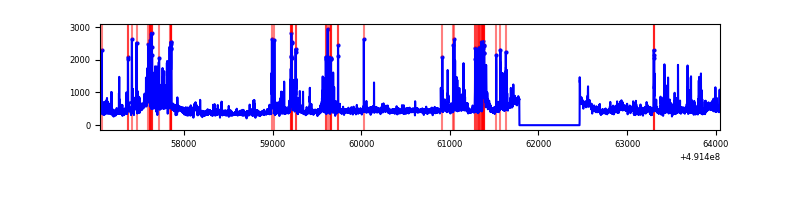 |
| B | 6996 | 6316 | 490 | 490 | 7.00% | 7.76% | 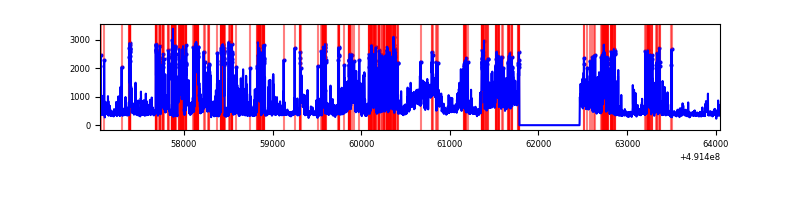 |
| C | 6995 | 6315 | 3402 | 3402 | 48.63% | 53.87% | 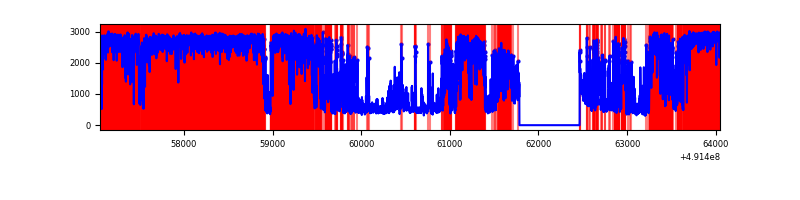 |
| D | 6994 | 6314 | 5572 | 5572 | 79.67% | 88.25% | 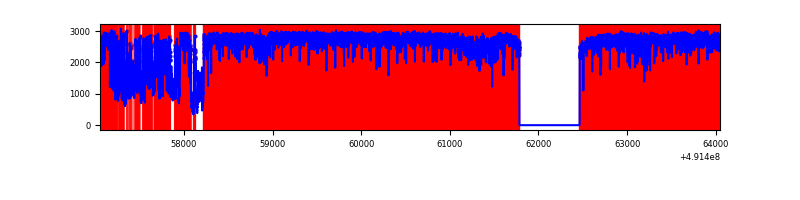 |
Top three noisy pixels from each quadrant. If the there are fewer than three noisy pixels in the level2.evt file, extra rows are filled as -1
| Pixel properties | Quadrant properties | ||||||
|---|---|---|---|---|---|---|---|
| Quadrant | DetID | PixID | Counts | Sigma | Mean | Median | Sigma |
| A | 0 | 8 | 337964 | 2132.87 | 640 | 624 | 158.2 |
| A | 4 | 77 | 201116 | 1267.63 | 640 | 624 | 158.2 |
| A | 3 | 62 | 118024 | 742.27 | 640 | 624 | 158.2 |
| B | 2 | 249 | 2115658 | 16059.3 | 612 | 592 | 131.7 |
| B | 4 | 81 | 282317 | 2139.09 | 612 | 592 | 131.7 |
| B | 8 | 234 | 115885 | 875.4 | 612 | 592 | 131.7 |
| C | 0 | 240 | 5921893 | 44888.34 | 478 | 474 | 131.9 |
| C | 1 | 241 | 1606820 | 12177.18 | 478 | 474 | 131.9 |
| C | 15 | 224 | 1411915 | 10699.67 | 478 | 474 | 131.9 |
| D | 10 | 117 | 8044346 | 101412.89 | 271 | 257 | 79.3 |
| D | 15 | 125 | 5992067 | 75539.54 | 271 | 257 | 79.3 |
| D | 2 | 62 | 460312 | 5799.97 | 271 | 257 | 79.3 |
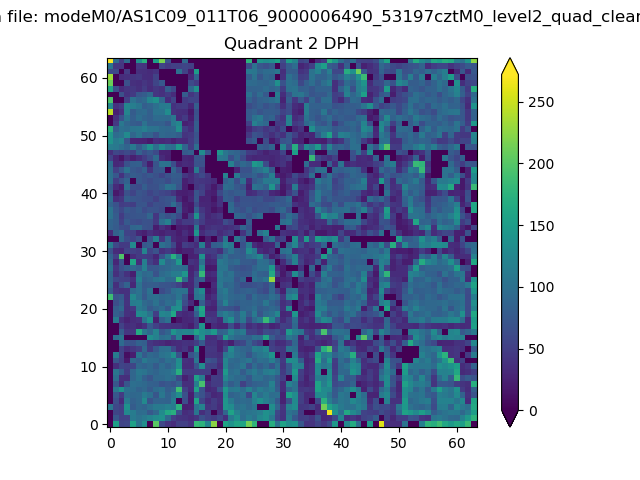
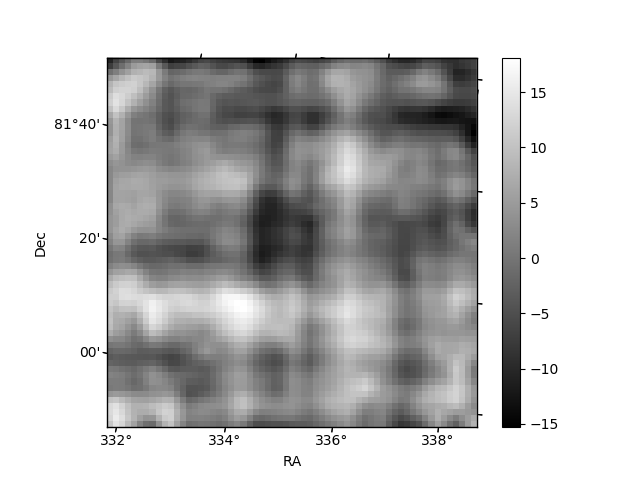
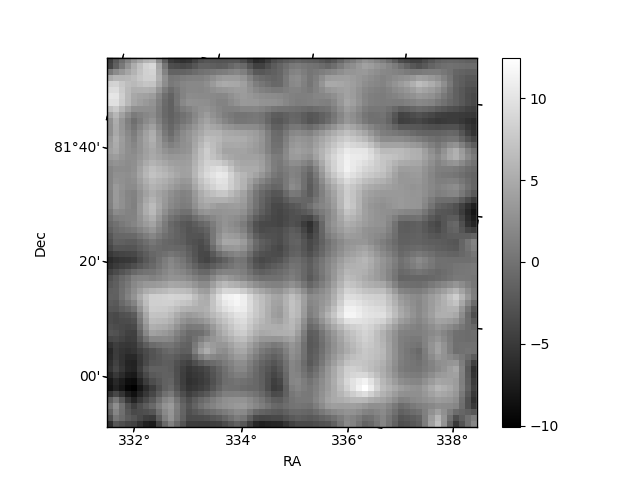
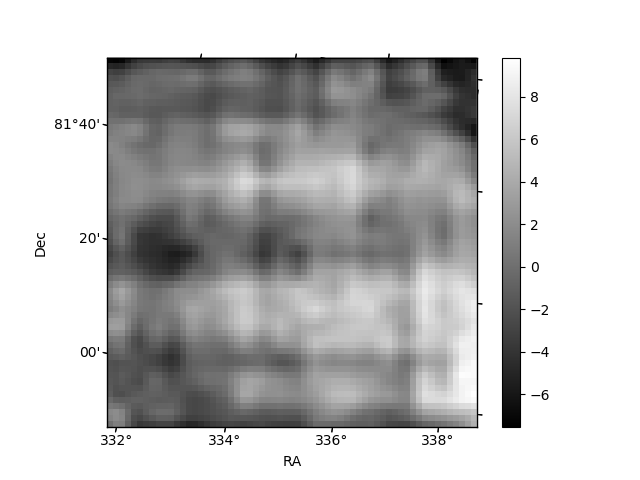
Histogram calculated using DETX and DETY for each event in the final _common_clean file
| Quadrant A | 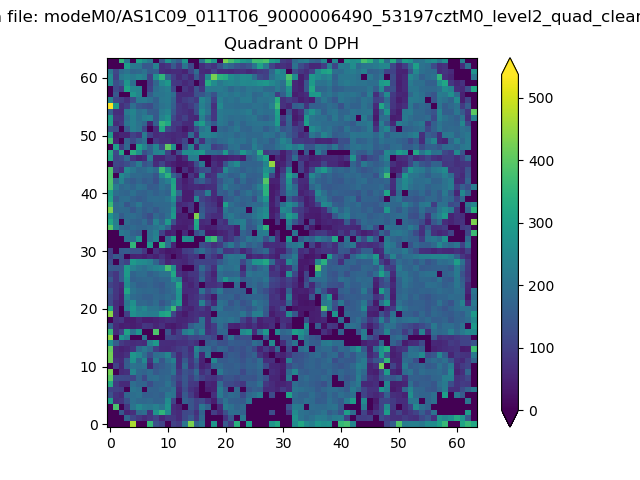 |
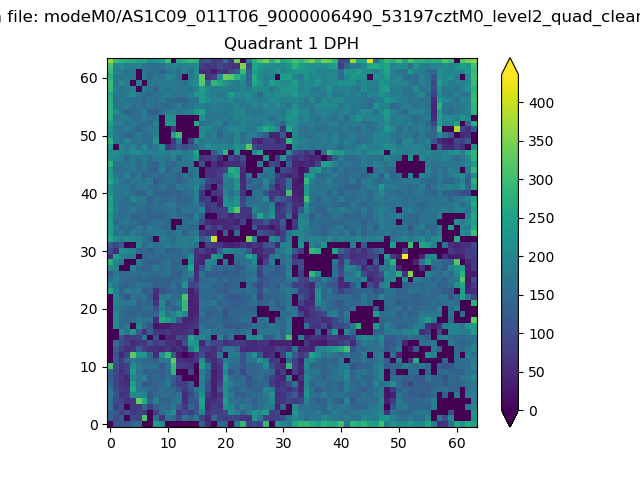 |
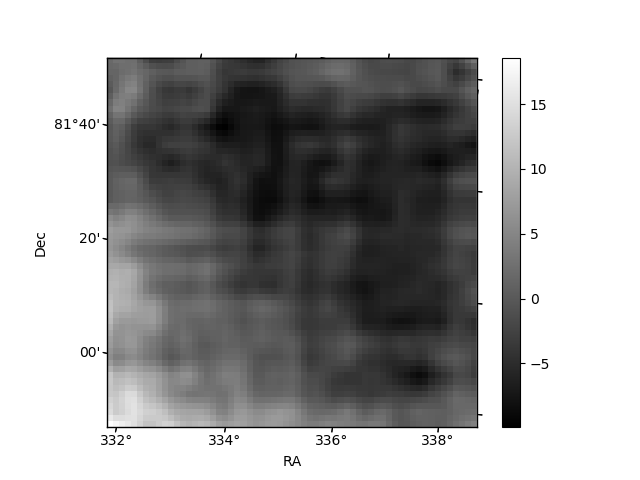
Quadrant B |
|---|---|---|---|
| Quadrant D | 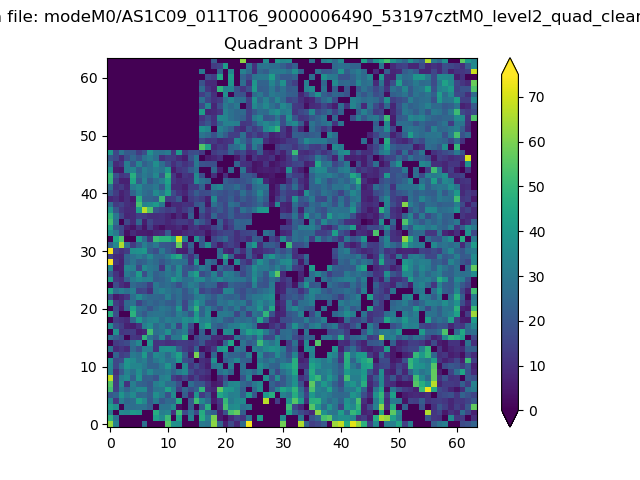 |
 |
Quadrant C |
| Plot type | Count rate plots | Images |
|---|---|---|
| Comparison with Poisson distribution Blue bars denote a histogram of data divided into 1 sec bins. Red curve is a Poisson curve with rate = median count rate of data. |
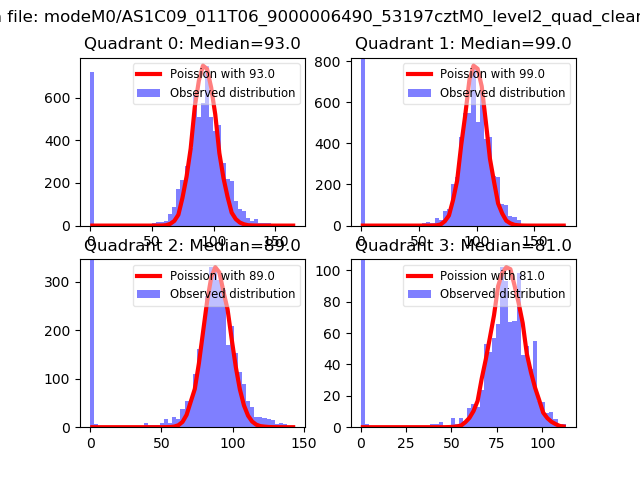 |
 |
| Quadrant-wise count rates Data is divided into 100 sec bins |
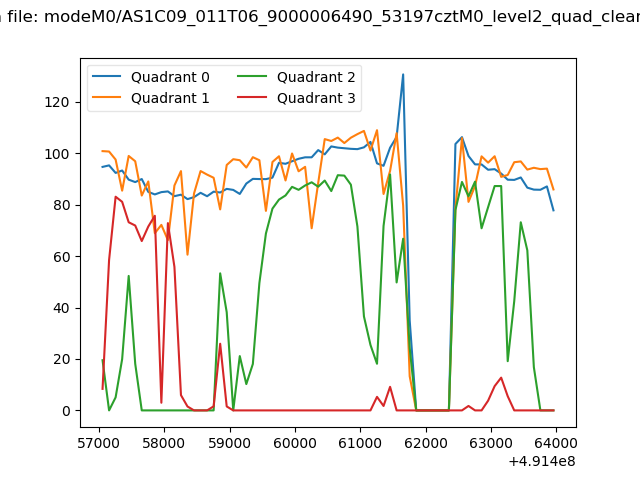 |
|
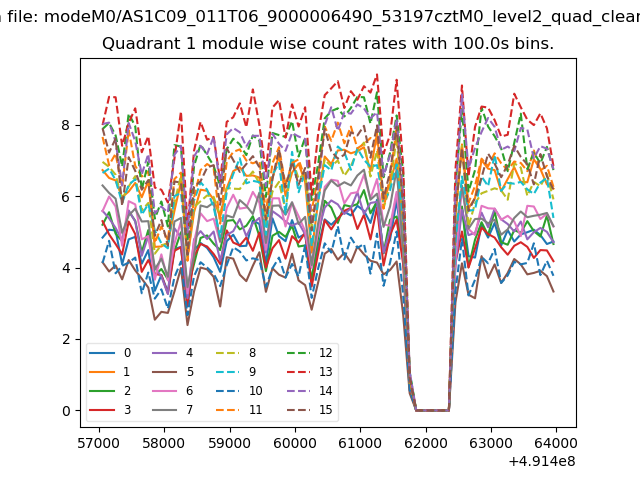
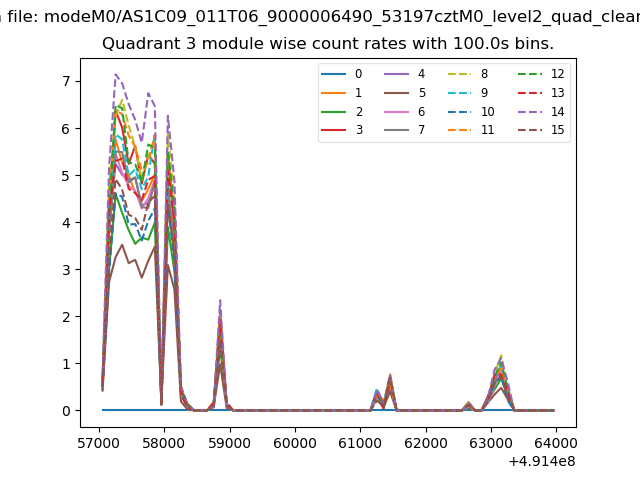
| Module-wise count rates for Quadrant A Data is divided into 100 sec bins |
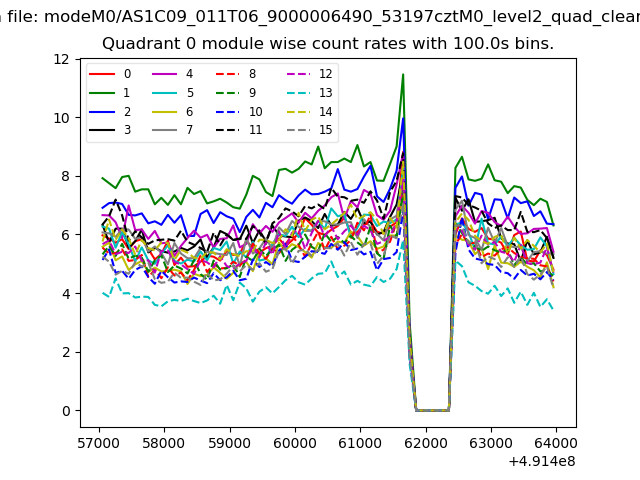 |
 |
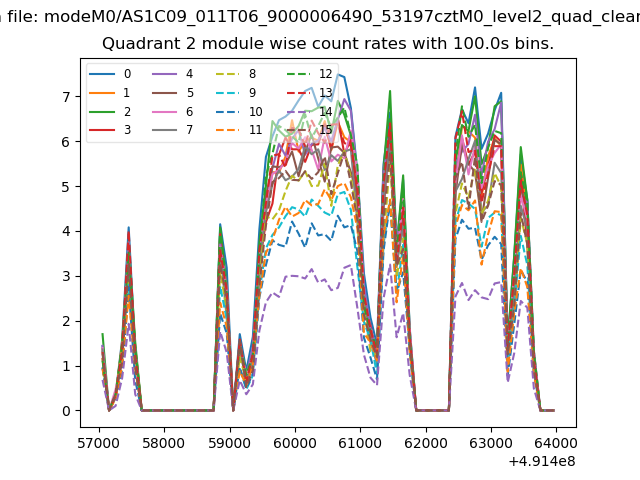
| Module-wise count rates for Quadrant B Data is divided into 100 sec bins |
 |
 |
| Module-wise count rates for Quadrant C Data is divided into 100 sec bins |
 |
 |
| Module-wise count rates for Quadrant D Data is divided into 100 sec bins |
 |
 |
| Parameter | Plot |
|---|---|
| CZT HV Monitor | 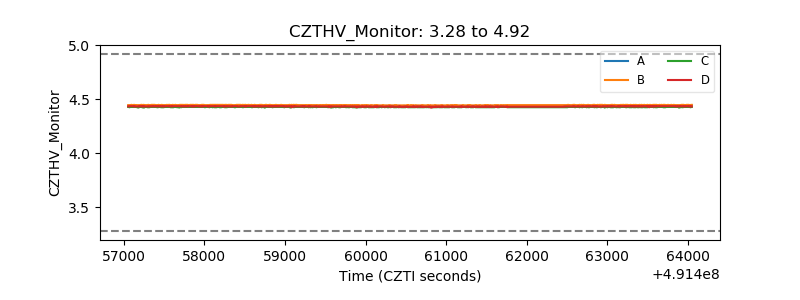 |
| D_VDD | 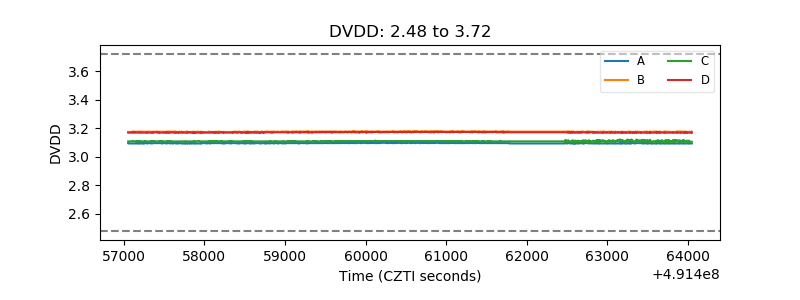 |
| Temperature 1 | 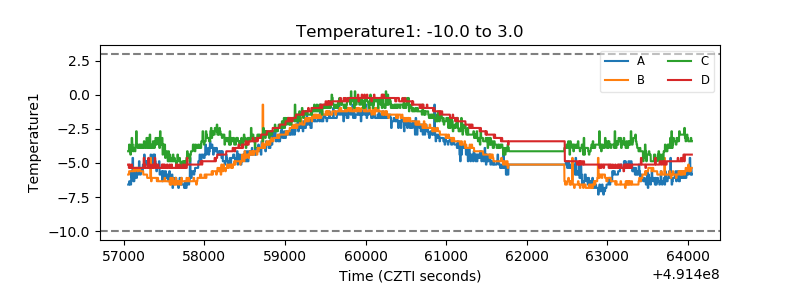 |
| Veto HV Monitor | 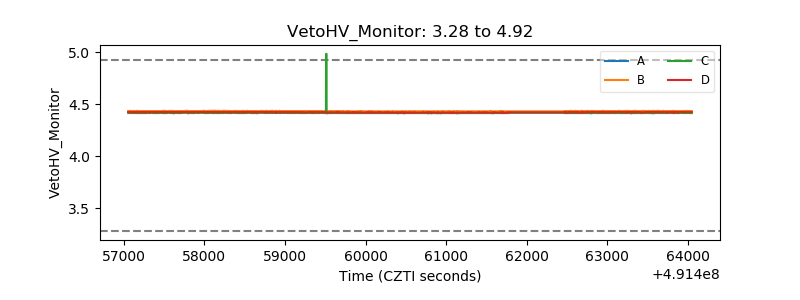 |
| Veto LLD | 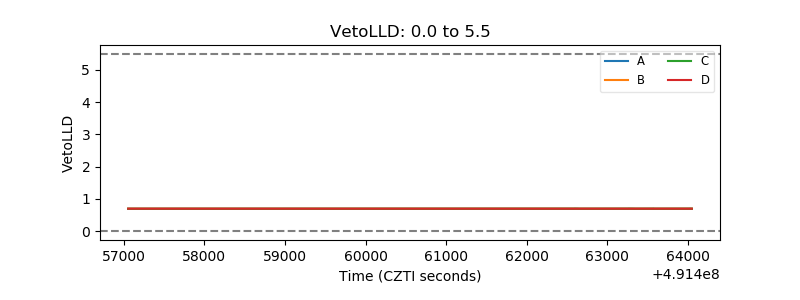 |
| Alpha Counter | 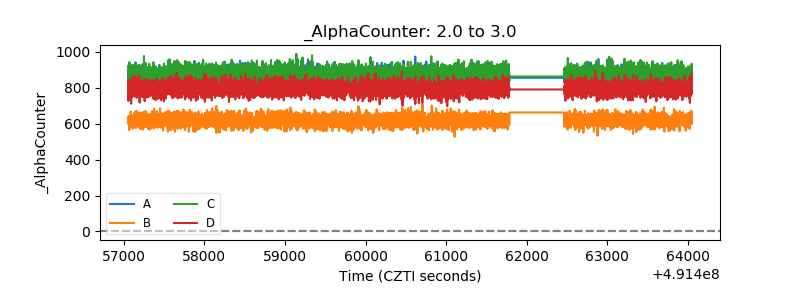 |
| _CPM_Rate | 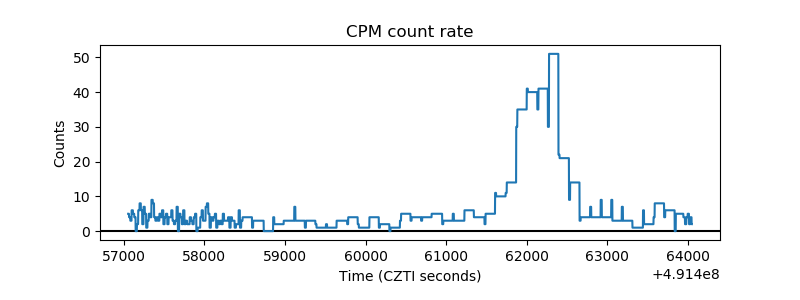 |
| CZT Counter | 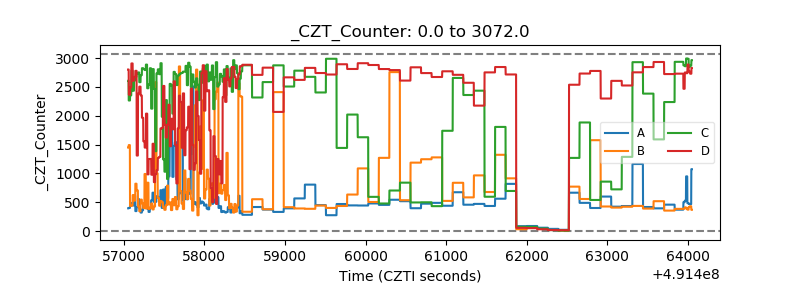 |
| +2.5 Volts monitor | 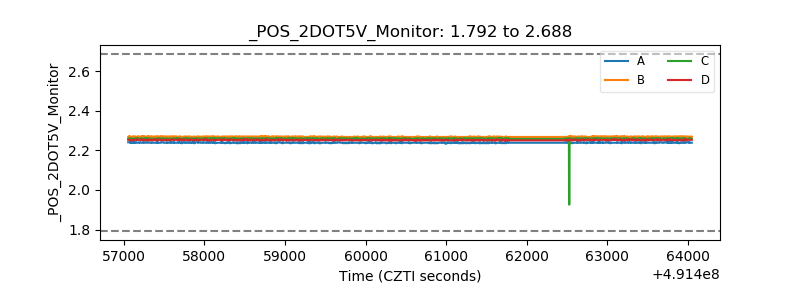 |
| +5 Volts monitor |  |
| _ROLL_ROT | 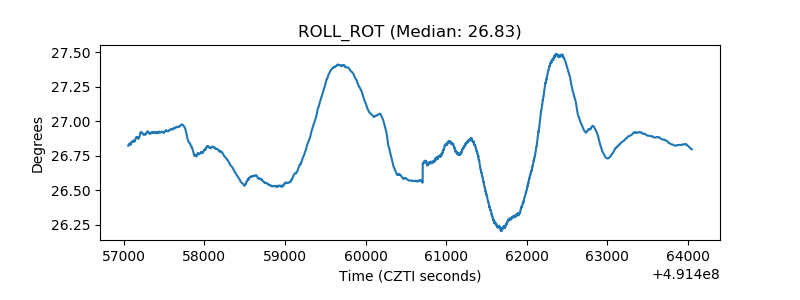 |
| _Roll_DEC | 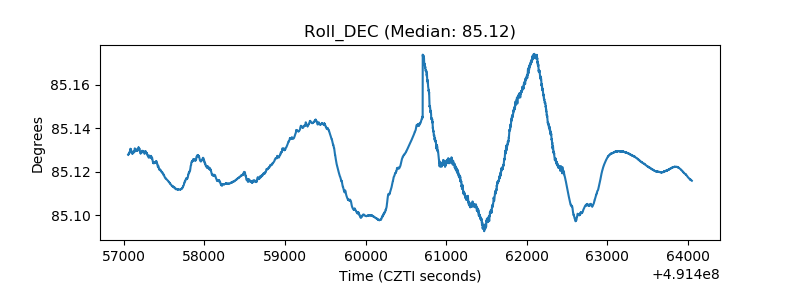 |
| _Roll_RA | 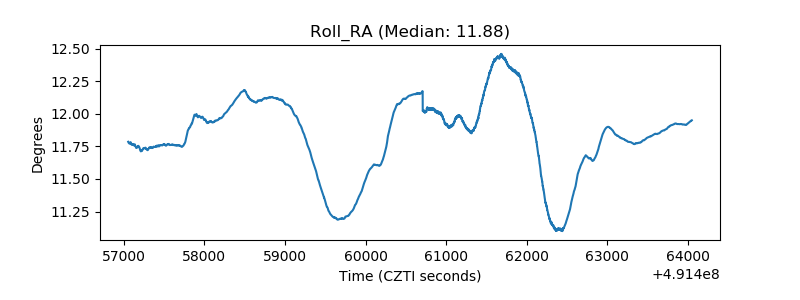 |
| Veto Counter | 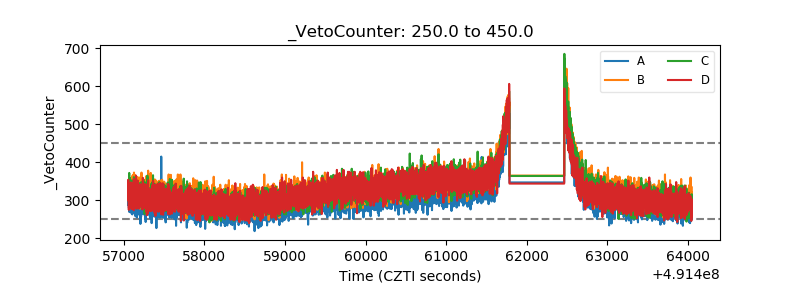 |