| Param | Original file | Final file |
|---|---|---|
| Filename | modeM0/AS1C09_011T06_9000006490_53198cztM0_level2.fits | modeM0/AS1C09_011T06_9000006490_53198cztM0_level2_quad_clean.evt |
| Size (bytes) | 976,213,440 | 77,362,560 |
| Size | 931.0 MB | 73.8 MB |
| Events in quadrant A | 3,577,470 | 651,605 |
| Events in quadrant B | 4,384,789 | 685,727 |
| Events in quadrant C | 8,889,557 | 487,987 |
| Events in quadrant D | 18,744,223 | 30,659 |
| Mode SS | |||
|---|---|---|---|
| Quadrant | BADHDUFLAG | Total packets | Discarded packets |
| A | 0 | 140 | 0 |
| B | 0 | 140 | 0 |
| C | 0 | 139 | 1 |
| D | 0 | 140 | 0 |
| Mode M0 | |||
|---|---|---|---|
| Quadrant | BADHDUFLAG | Total packets | Discarded packets |
| A | 0 | 15843 | 9 |
| B | 0 | 18074 | 13 |
| C | 0 | 31271 | 55 |
| D | 0 | 60257 | 151 |
| Quadrant | Total seconds | Saturated seconds | Saturation percentage |
|---|---|---|---|
| A | 6985 | 106 | 1.517538% |
| B | 6984 | 293 | 4.195304% |
| C | 6975 | 1691 | 24.243728% |
| D | 6971 | 6669 | 95.667766% |
Noise dominated data is calculated using 1-second bins in cleaned event files. If a bin has >2000 counts, and if more than 50% of those come from <1% of pixels, then it is considered to be noise-dominated and hence unusable.
| Quadrant | # 1 sec bins | Bins with >0 counts | Bins with >2000 counts | High rate bins dominated by noise | Noise dominated (total time) | Noise dominated (detector-on time) | Marked lightcurve |
|---|---|---|---|---|---|---|---|
| A | 6991 | 6989 | 47 | 47 | 0.67% | 0.67% | 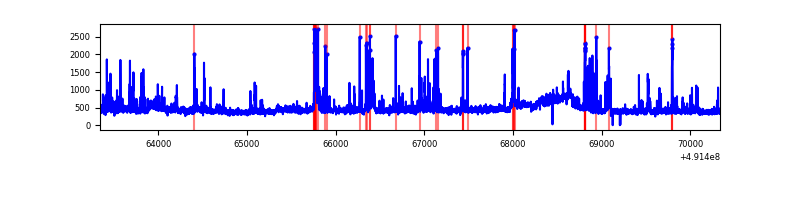 |
| B | 6990 | 6987 | 108 | 108 | 1.55% | 1.55% | 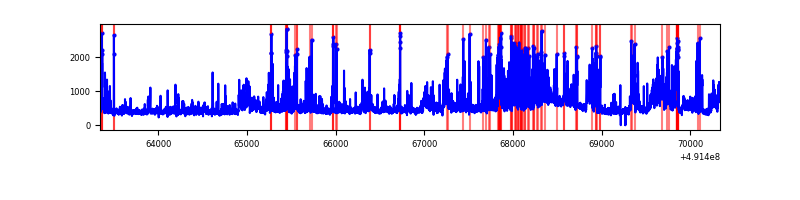 |
| C | 6991 | 6985 | 1718 | 1718 | 24.57% | 24.60% | 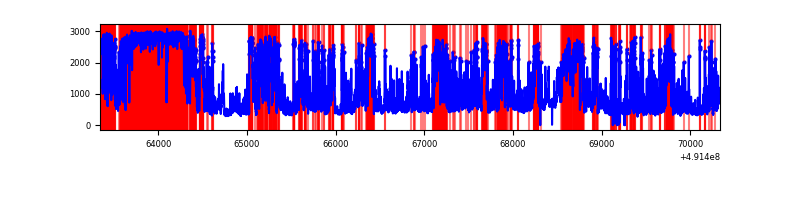 |
| D | 6990 | 6972 | 6706 | 6706 | 95.94% | 96.18% | 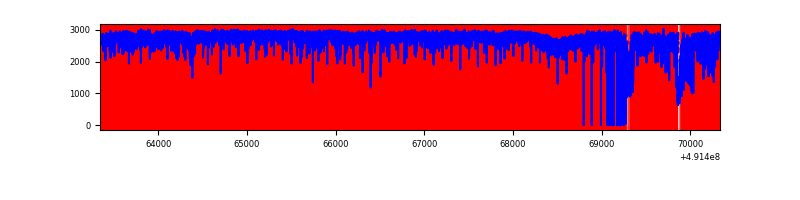 |
Top three noisy pixels from each quadrant. If the there are fewer than three noisy pixels in the level2.evt file, extra rows are filled as -1
| Pixel properties | Quadrant properties | ||||||
|---|---|---|---|---|---|---|---|
| Quadrant | DetID | PixID | Counts | Sigma | Mean | Median | Sigma |
| A | 3 | 62 | 226508 | 1267.55 | 722 | 703 | 178.1 |
| A | 4 | 77 | 166397 | 930.12 | 722 | 703 | 178.1 |
| A | 15 | 174 | 81013 | 450.82 | 722 | 703 | 178.1 |
| B | 2 | 249 | 540952 | 3602.89 | 709 | 684 | 150.0 |
| B | 4 | 81 | 333440 | 2219.05 | 709 | 684 | 150.0 |
| B | 1 | 255 | 217545 | 1446.18 | 709 | 684 | 150.0 |
| C | 1 | 241 | 2420549 | 13966.33 | 621 | 613 | 173.3 |
| C | 15 | 224 | 1748990 | 10090.52 | 621 | 613 | 173.3 |
| C | 0 | 240 | 1538282 | 8874.45 | 621 | 613 | 173.3 |
| D | 10 | 117 | 11309158 | 169223.0 | 230 | 219 | 66.8 |
| D | 15 | 125 | 6254193 | 93582.27 | 230 | 219 | 66.8 |
| D | 12 | 3 | 56207 | 837.78 | 230 | 219 | 66.8 |
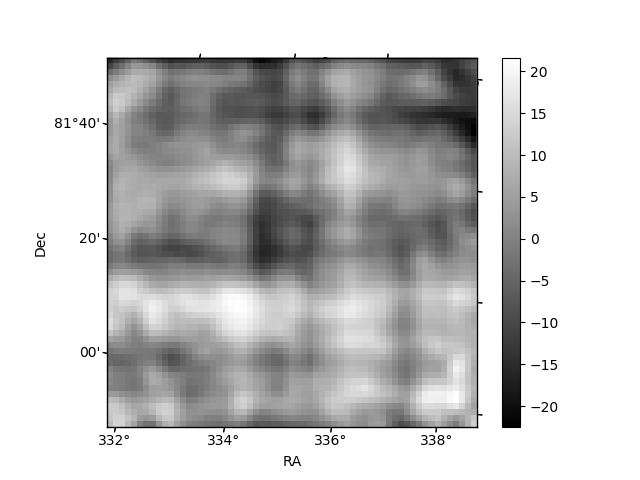
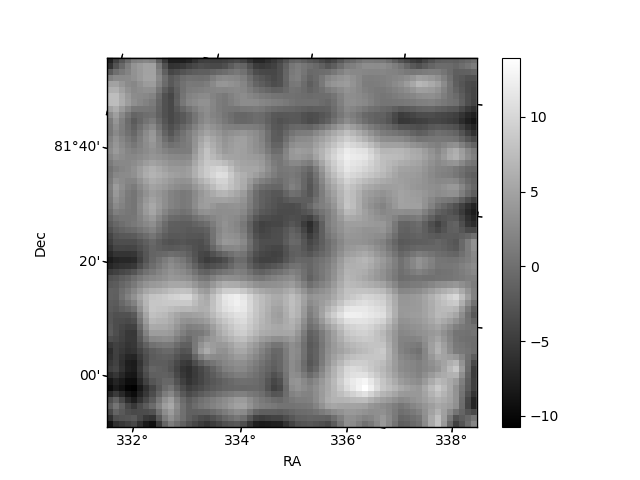
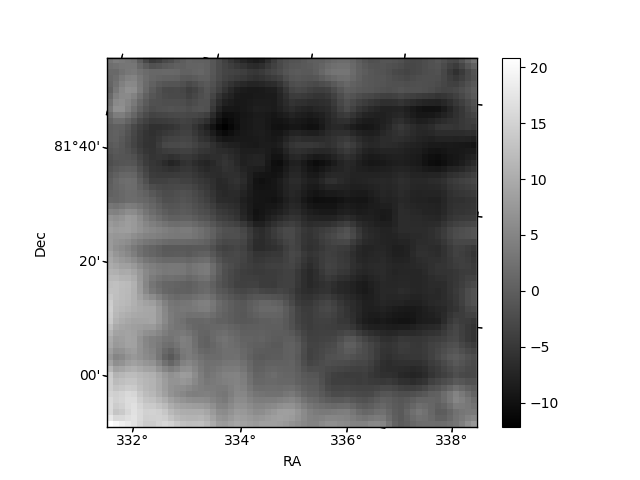
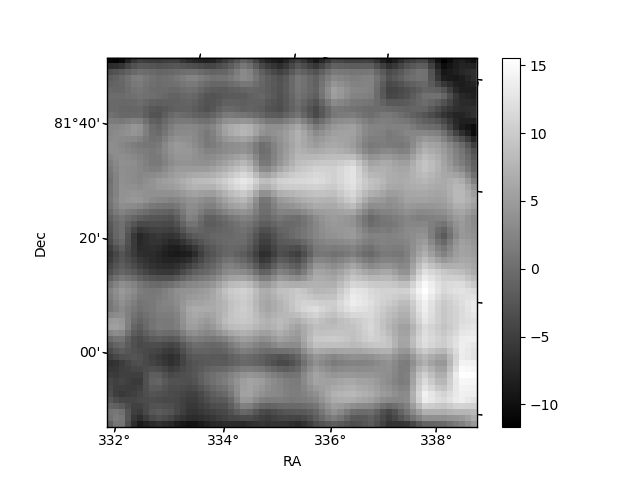
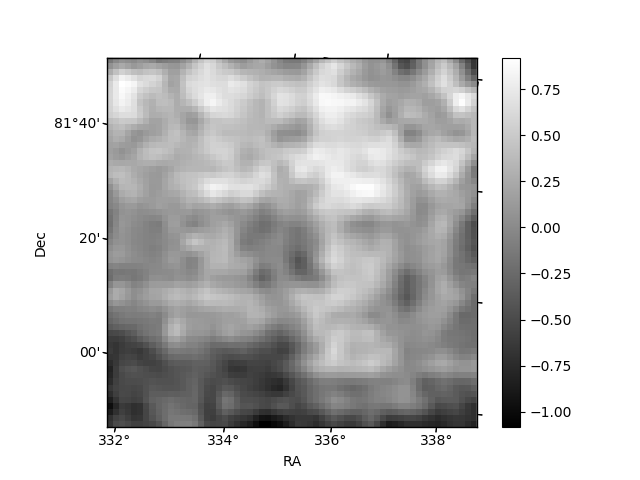
Histogram calculated using DETX and DETY for each event in the final _common_clean file
| Quadrant A | 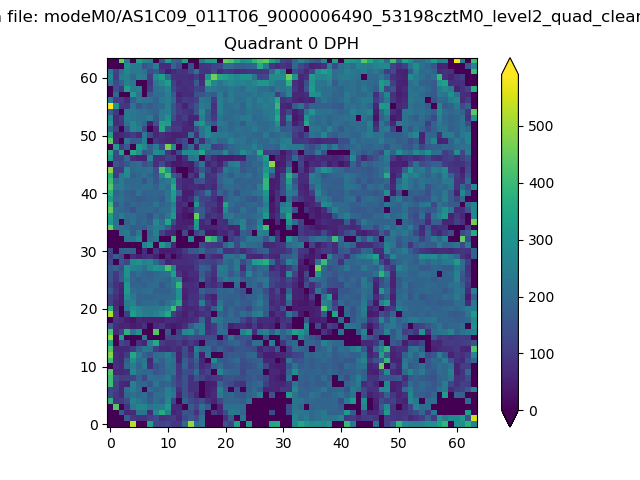 |
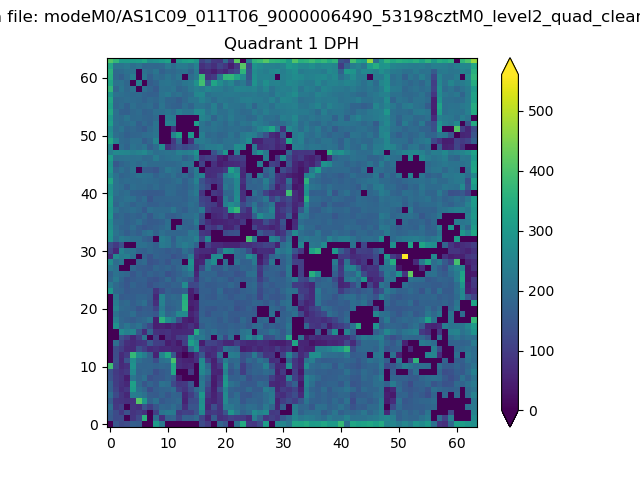 |
Quadrant B |
|---|---|---|---|
| Quadrant D | 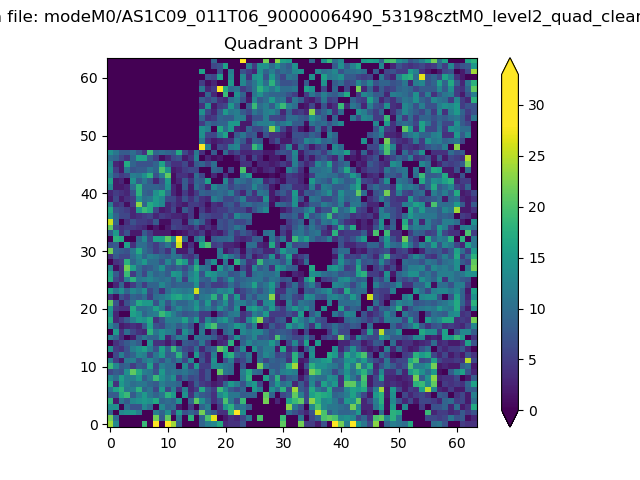 |
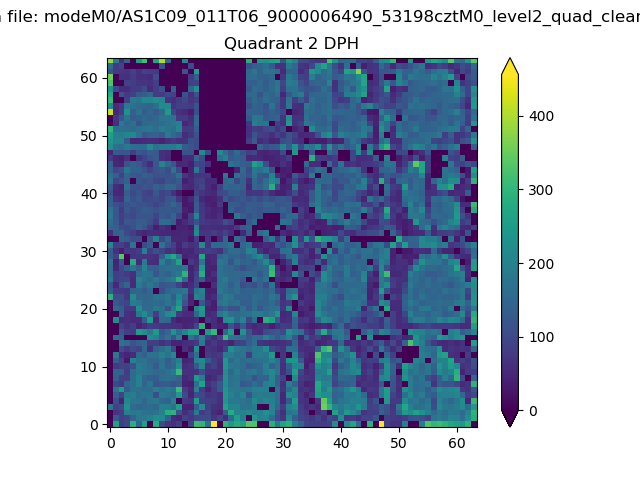 |
Quadrant C |
| Plot type | Count rate plots | Images |
|---|---|---|
| Comparison with Poisson distribution Blue bars denote a histogram of data divided into 1 sec bins. Red curve is a Poisson curve with rate = median count rate of data. |
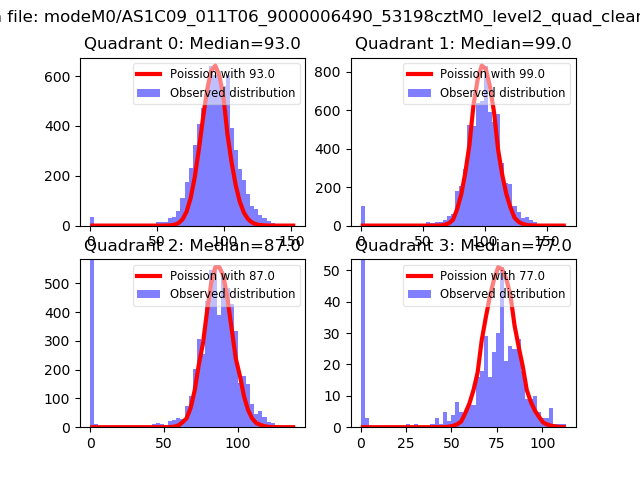 |
 |
| Quadrant-wise count rates Data is divided into 100 sec bins |
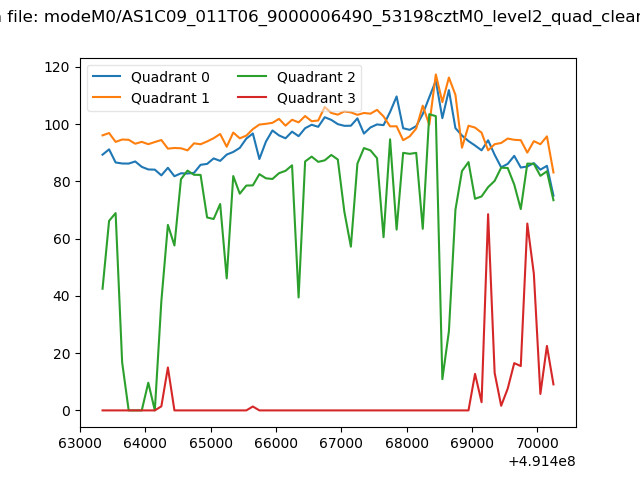 |
|
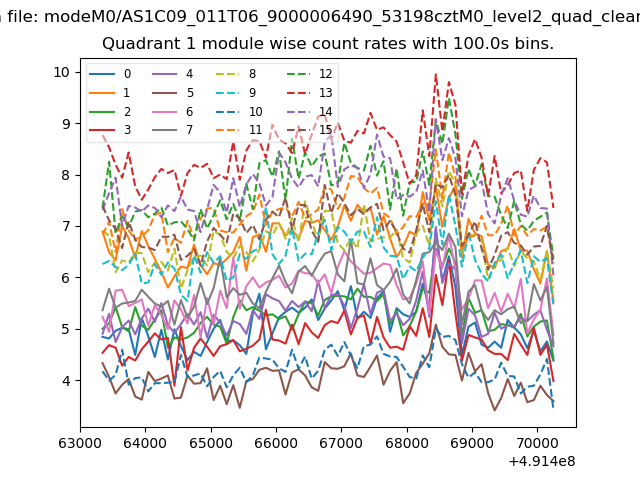
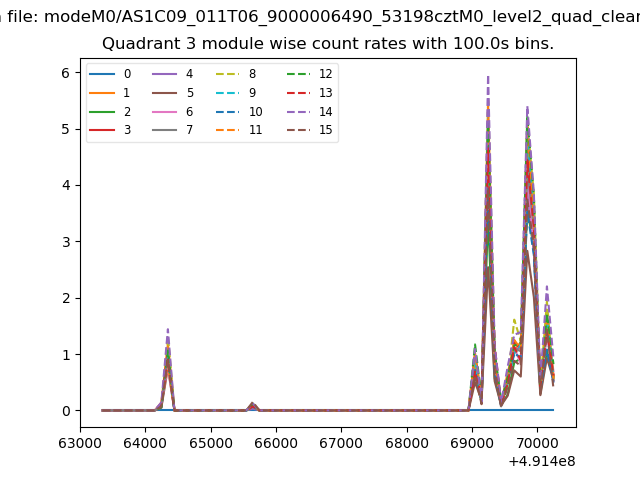
| Module-wise count rates for Quadrant A Data is divided into 100 sec bins |
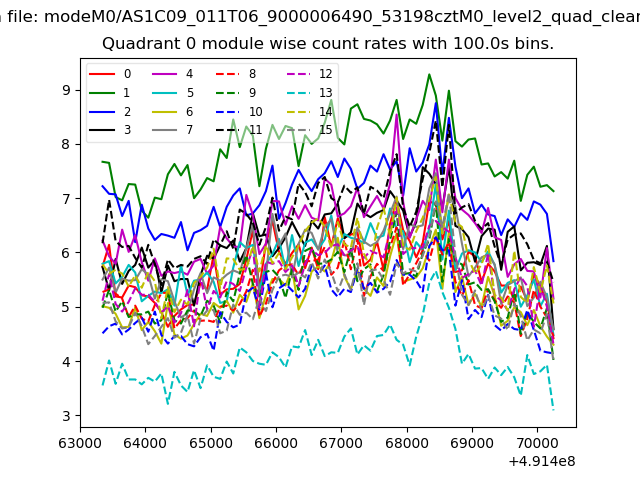 |
 |
| Module-wise count rates for Quadrant B Data is divided into 100 sec bins |
 |
 |
| Module-wise count rates for Quadrant C Data is divided into 100 sec bins |
 |
 |
| Module-wise count rates for Quadrant D Data is divided into 100 sec bins |
 |
 |
| Parameter | Plot |
|---|---|
| CZT HV Monitor | 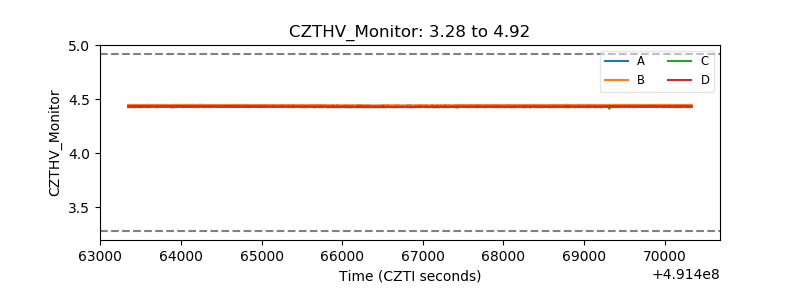 |
| D_VDD | 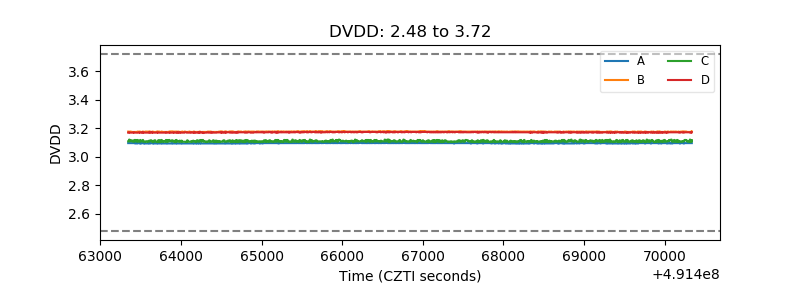 |
| Temperature 1 | 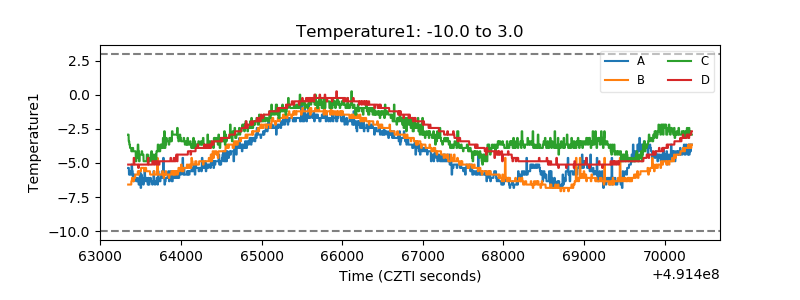 |
| Veto HV Monitor | 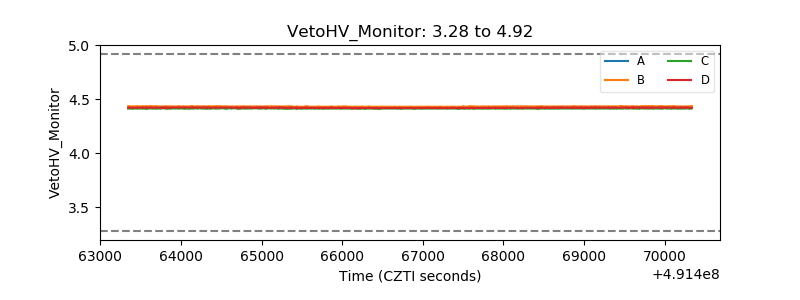 |
| Veto LLD | 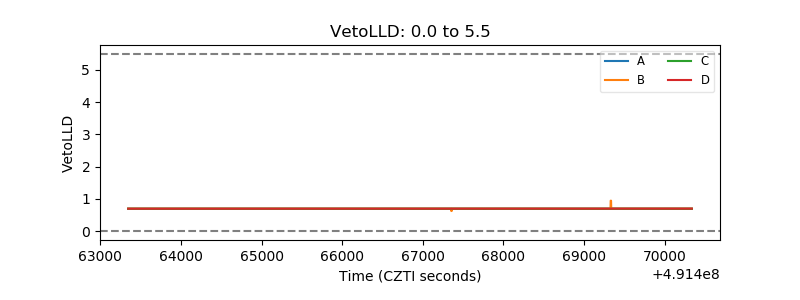 |
| Alpha Counter | 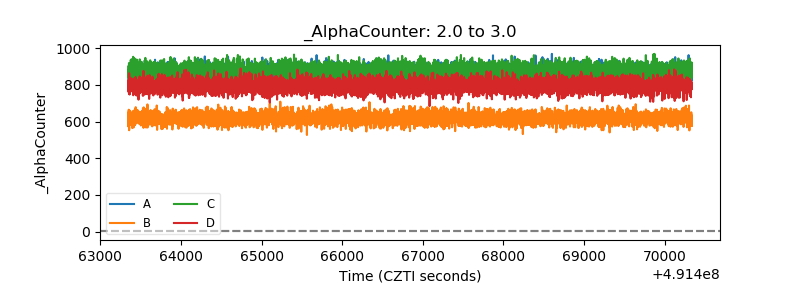 |
| _CPM_Rate | 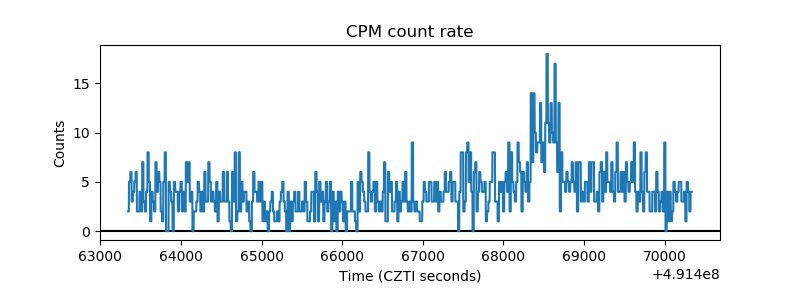 |
| CZT Counter | 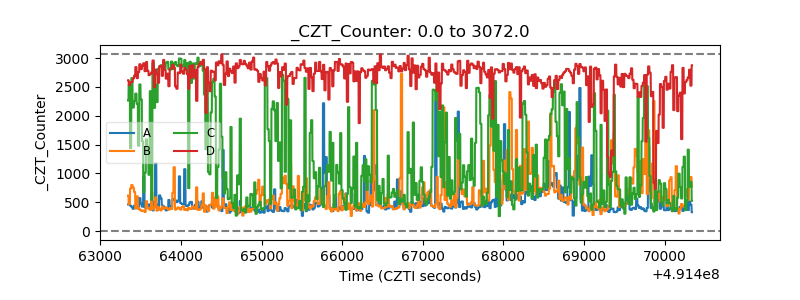 |
| +2.5 Volts monitor |  |
| +5 Volts monitor | 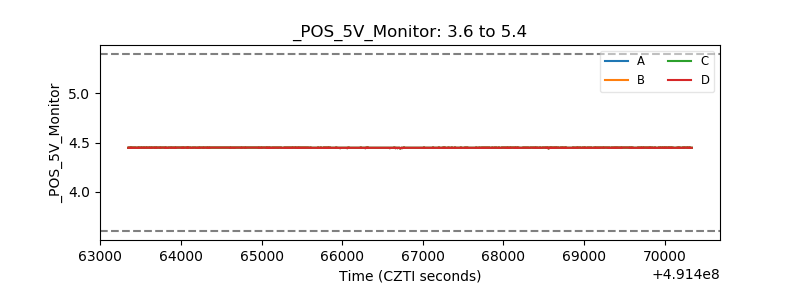 |
| _ROLL_ROT | 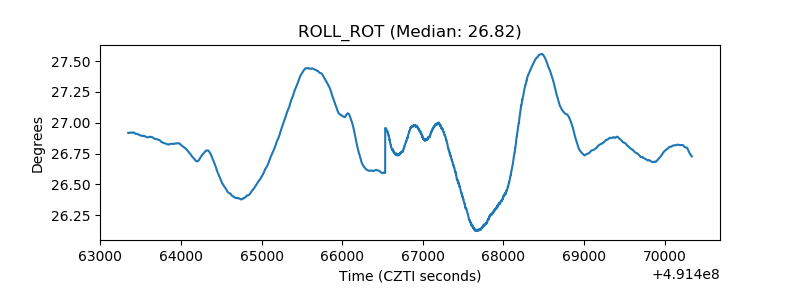 |
| _Roll_DEC | 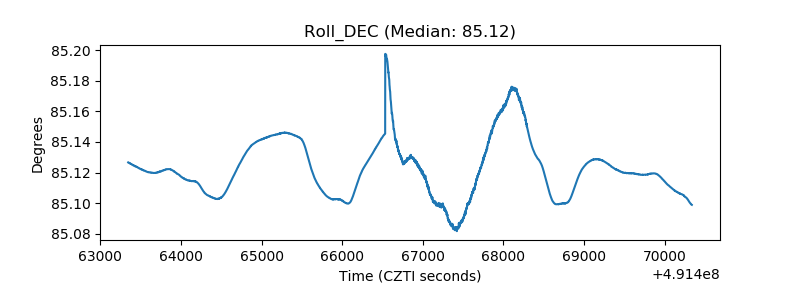 |
| _Roll_RA | 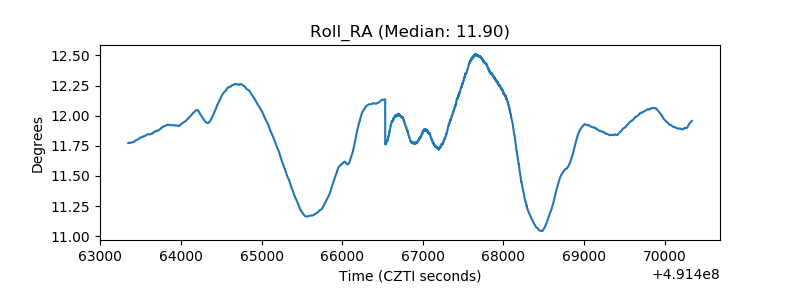 |
| Veto Counter | 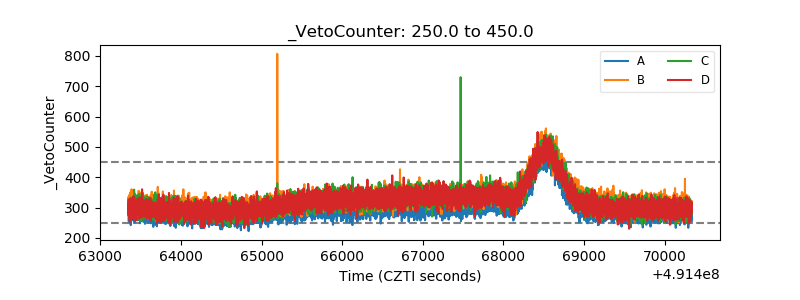 |