| Param | Original file | Final file |
|---|---|---|
| Filename | modeM0/AS1C09_011T06_9000006490_53199cztM0_level2.fits | modeM0/AS1C09_011T06_9000006490_53199cztM0_level2_quad_clean.evt |
| Size (bytes) | 905,984,640 | 81,040,320 |
| Size | 864.0 MB | 77.3 MB |
| Events in quadrant A | 3,207,347 | 655,803 |
| Events in quadrant B | 4,019,128 | 695,149 |
| Events in quadrant C | 7,020,759 | 564,521 |
| Events in quadrant D | 18,740,335 | 44,607 |
| Mode SS | |||
|---|---|---|---|
| Quadrant | BADHDUFLAG | Total packets | Discarded packets |
| A | 0 | 142 | 0 |
| B | 0 | 142 | 0 |
| C | 0 | 142 | 0 |
| D | 0 | 142 | 0 |
| Mode M0 | |||
|---|---|---|---|
| Quadrant | BADHDUFLAG | Total packets | Discarded packets |
| A | 0 | 14998 | 0 |
| B | 0 | 17014 | 0 |
| C | 0 | 25853 | 0 |
| D | 0 | 60250 | 2 |
| Quadrant | Total seconds | Saturated seconds | Saturation percentage |
|---|---|---|---|
| A | 7082 | 43 | 0.607173% |
| B | 7083 | 148 | 2.089510% |
| C | 7083 | 806 | 11.379359% |
| D | 7082 | 6668 | 94.154194% |
Noise dominated data is calculated using 1-second bins in cleaned event files. If a bin has >2000 counts, and if more than 50% of those come from <1% of pixels, then it is considered to be noise-dominated and hence unusable.
| Quadrant | # 1 sec bins | Bins with >0 counts | Bins with >2000 counts | High rate bins dominated by noise | Noise dominated (total time) | Noise dominated (detector-on time) | Marked lightcurve |
|---|---|---|---|---|---|---|---|
| A | 7082 | 7082 | 41 | 41 | 0.58% | 0.58% | 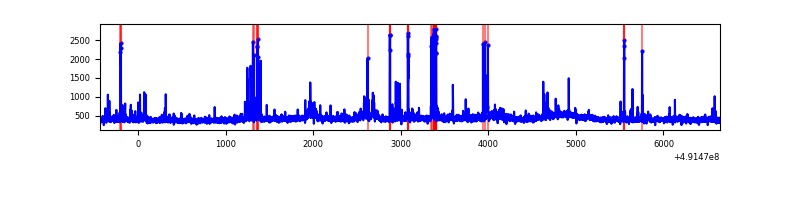 |
| B | 7083 | 7083 | 102 | 102 | 1.44% | 1.44% | 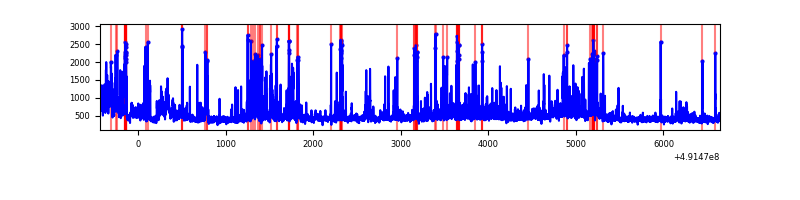 |
| C | 7082 | 7082 | 895 | 895 | 12.64% | 12.64% | 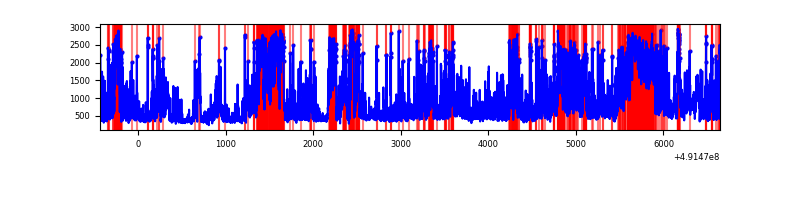 |
| D | 7081 | 7081 | 6702 | 6702 | 94.65% | 94.65% | 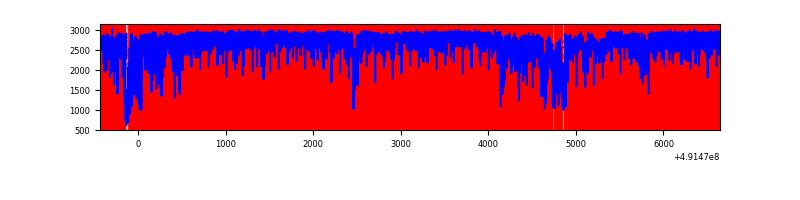 |
Top three noisy pixels from each quadrant. If the there are fewer than three noisy pixels in the level2.evt file, extra rows are filled as -1
| Pixel properties | Quadrant properties | ||||||
|---|---|---|---|---|---|---|---|
| Quadrant | DetID | PixID | Counts | Sigma | Mean | Median | Sigma |
| A | 0 | 8 | 176191 | 972.22 | 720 | 702 | 180.5 |
| A | 7 | 206 | 56907 | 311.38 | 720 | 702 | 180.5 |
| A | 3 | 62 | 44236 | 241.18 | 720 | 702 | 180.5 |
| B | 2 | 249 | 424552 | 2807.67 | 709 | 685 | 151.0 |
| B | 4 | 81 | 254893 | 1683.86 | 709 | 685 | 151.0 |
| B | 1 | 255 | 168640 | 1112.52 | 709 | 685 | 151.0 |
| C | 15 | 224 | 1639647 | 8795.85 | 669 | 661 | 186.3 |
| C | 1 | 241 | 1087228 | 5831.22 | 669 | 661 | 186.3 |
| C | 13 | 3 | 628584 | 3369.84 | 669 | 661 | 186.3 |
| D | 10 | 117 | 10075092 | 135648.98 | 252 | 240 | 74.3 |
| D | 15 | 125 | 7052037 | 94946.22 | 252 | 240 | 74.3 |
| D | 10 | 172 | 262329 | 3528.8 | 252 | 240 | 74.3 |
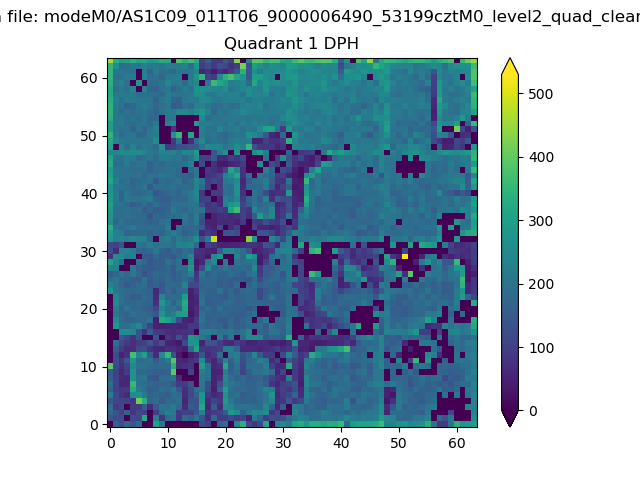
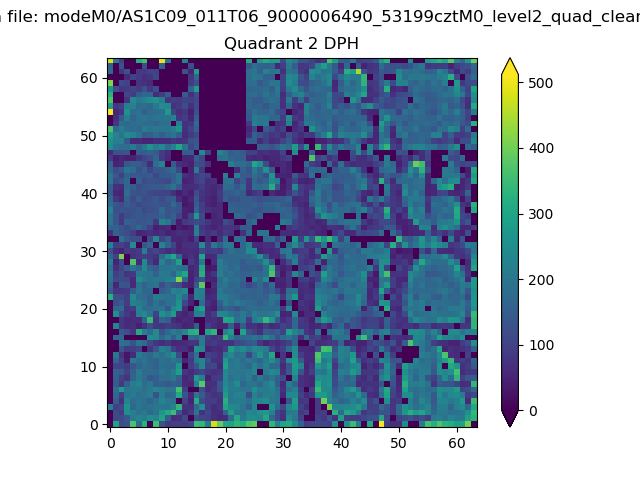
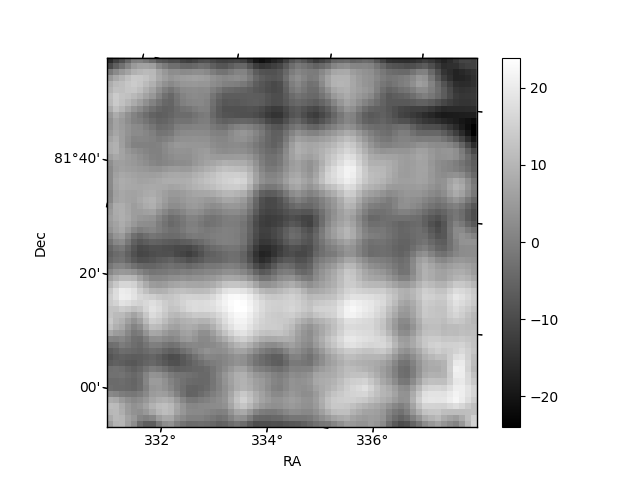
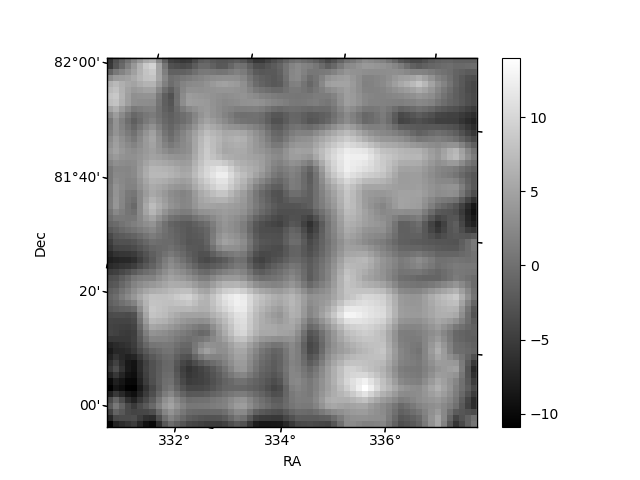
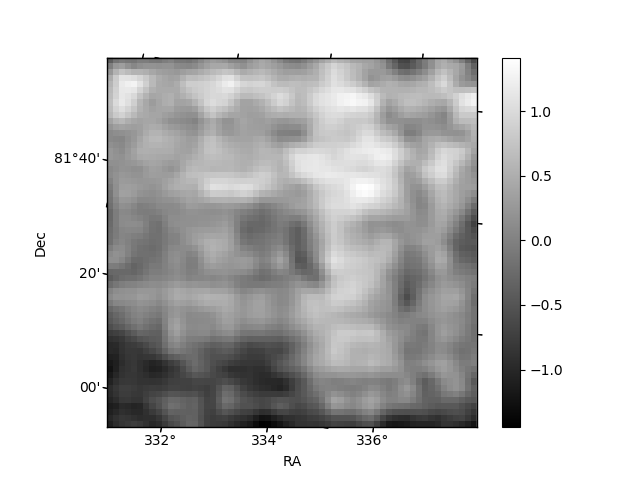
Histogram calculated using DETX and DETY for each event in the final _common_clean file
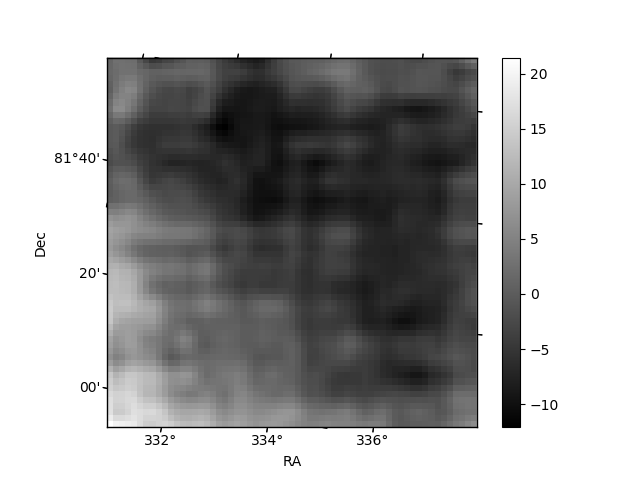
| Quadrant A |  |
 |
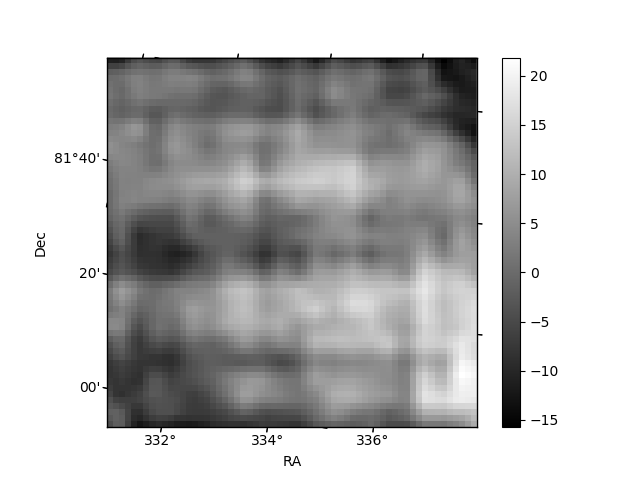
Quadrant B |
|---|---|---|---|
| Quadrant D | 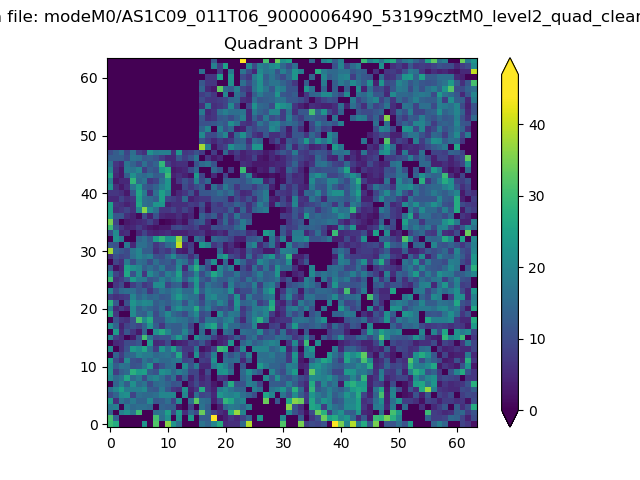 |
 |
Quadrant C |
| Plot type | Count rate plots | Images |
|---|---|---|
| Comparison with Poisson distribution Blue bars denote a histogram of data divided into 1 sec bins. Red curve is a Poisson curve with rate = median count rate of data. |
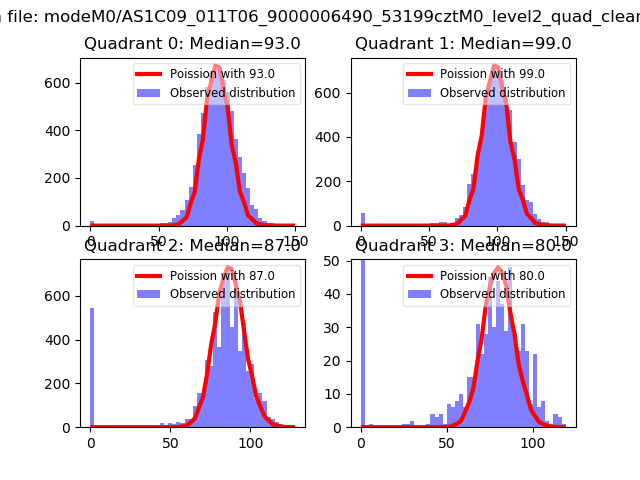 |
 |
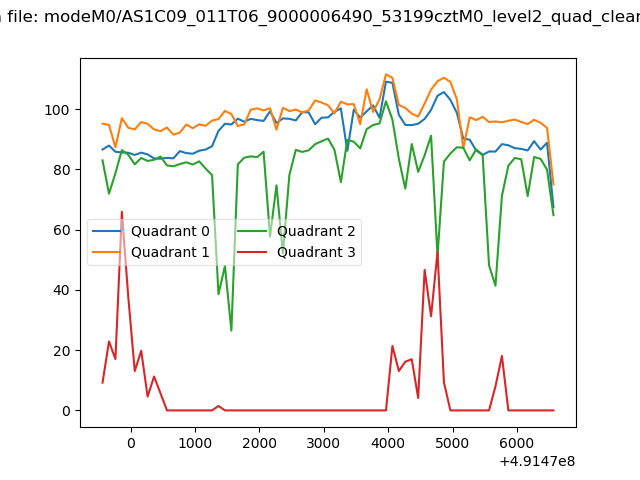
| Quadrant-wise count rates Data is divided into 100 sec bins |
 |
|
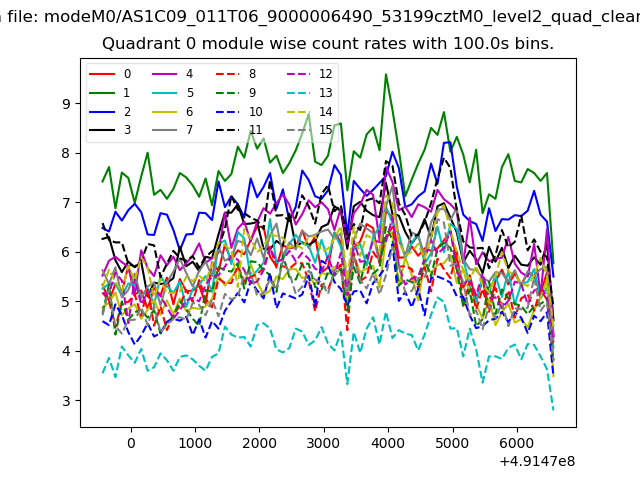
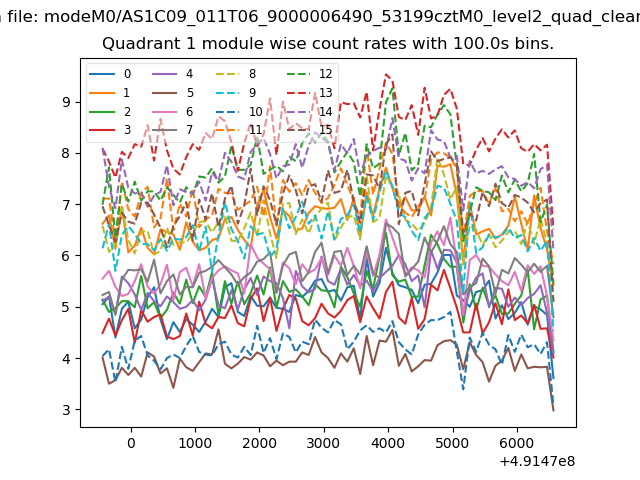
| Module-wise count rates for Quadrant A Data is divided into 100 sec bins |
 |
 |
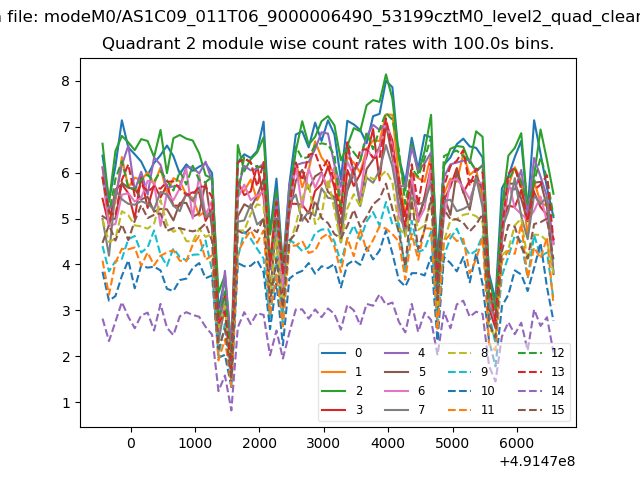
| Module-wise count rates for Quadrant B Data is divided into 100 sec bins |
 |
 |
| Module-wise count rates for Quadrant C Data is divided into 100 sec bins |
 |
 |
| Module-wise count rates for Quadrant D Data is divided into 100 sec bins |
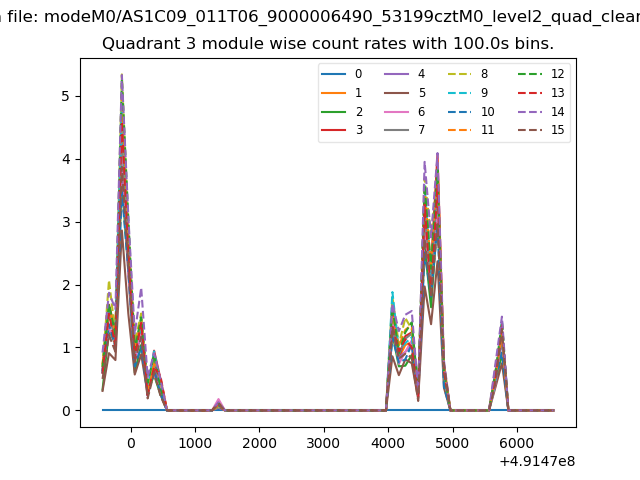 |
 |
| Parameter | Plot |
|---|---|
| CZT HV Monitor | 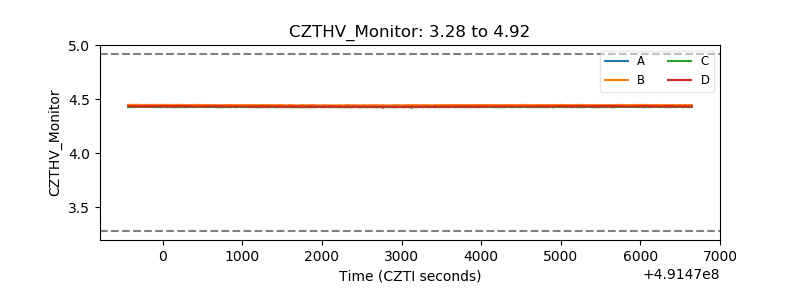 |
| D_VDD | 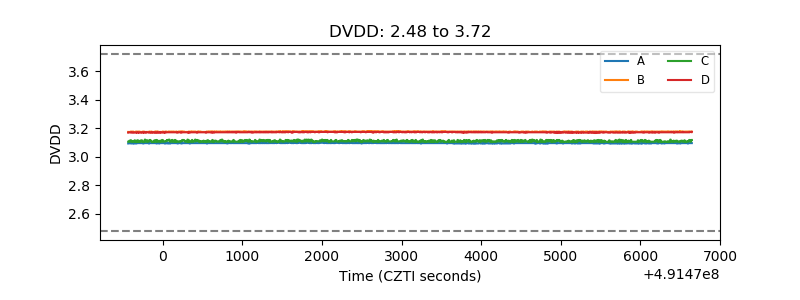 |
| Temperature 1 | 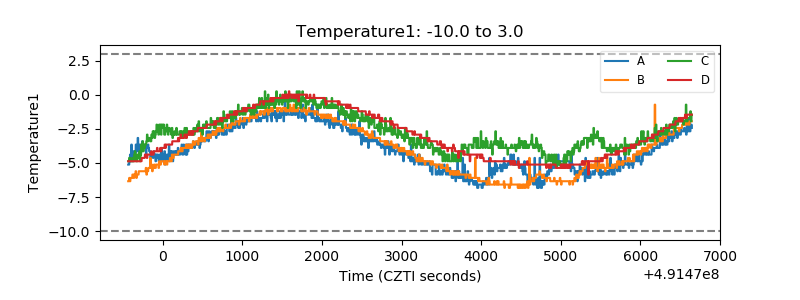 |
| Veto HV Monitor | 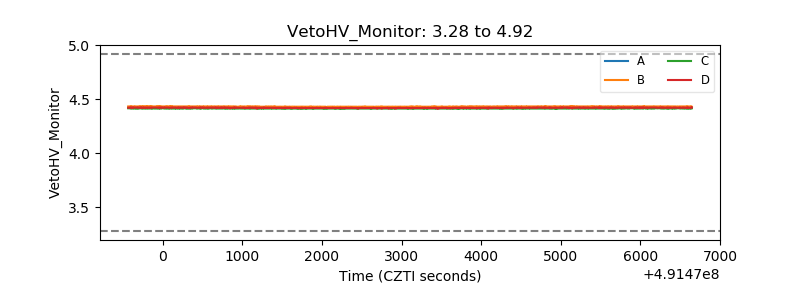 |
| Veto LLD | 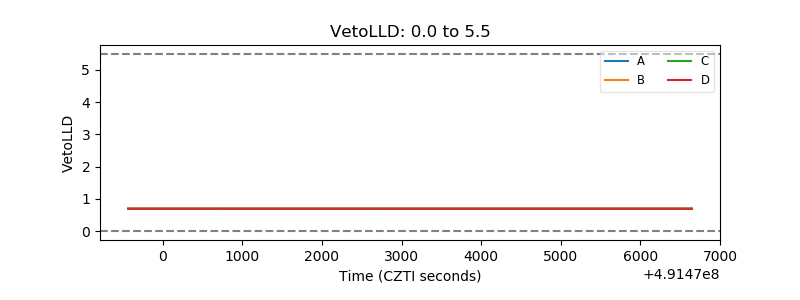 |
| Alpha Counter | 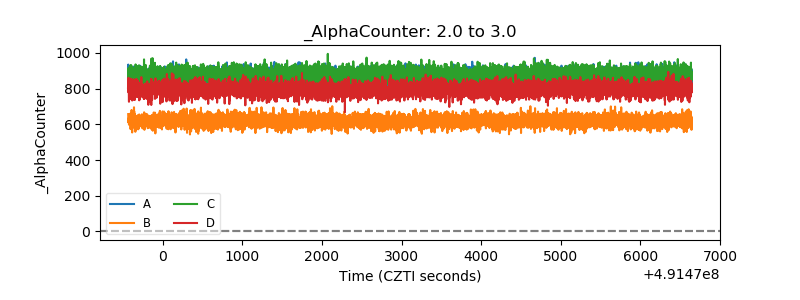 |
| _CPM_Rate | 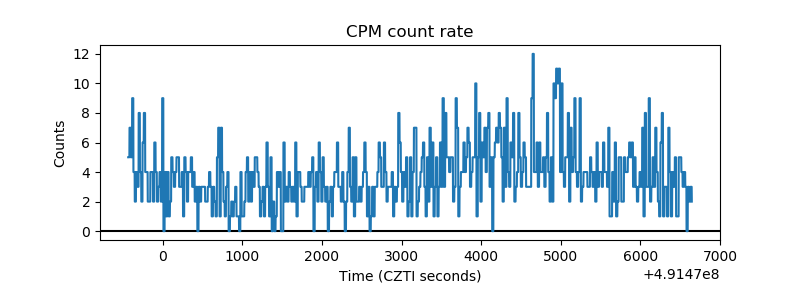 |
| CZT Counter | 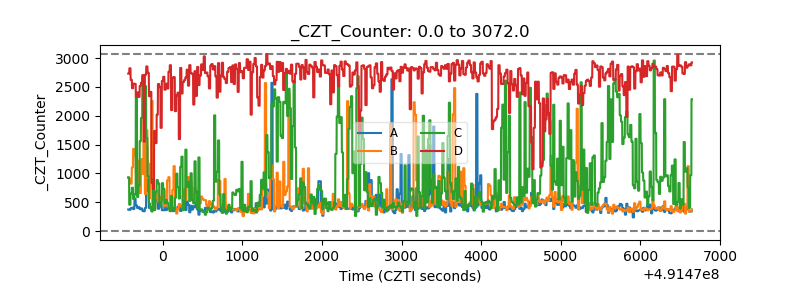 |
| +2.5 Volts monitor |  |
| +5 Volts monitor |  |
| _ROLL_ROT | 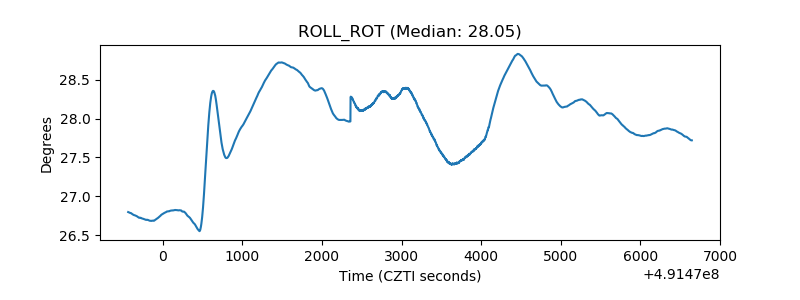 |
| _Roll_DEC | 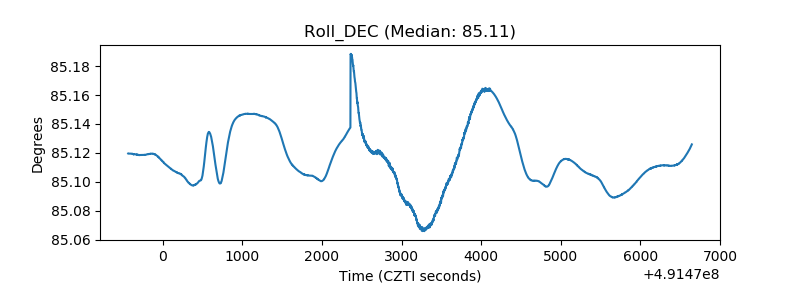 |
| _Roll_RA | 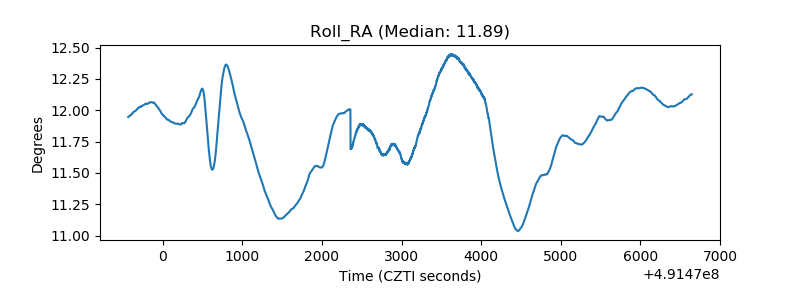 |
| Veto Counter | 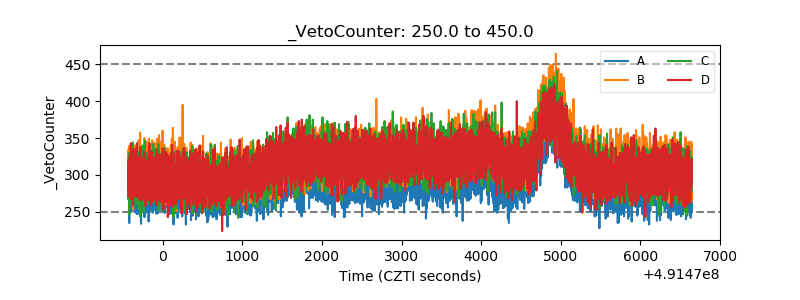 |