| Param | Original file | Final file |
|---|---|---|
| Filename | modeM0/AS1C09_011T06_9000006490_53200cztM0_level2.fits | modeM0/AS1C09_011T06_9000006490_53200cztM0_level2_quad_clean.evt |
| Size (bytes) | 927,731,520 | 81,132,480 |
| Size | 884.8 MB | 77.4 MB |
| Events in quadrant A | 3,379,747 | 647,381 |
| Events in quadrant B | 3,766,323 | 689,102 |
| Events in quadrant C | 10,890,977 | 417,394 |
| Events in quadrant D | 15,763,121 | 214,730 |
| Mode SS | |||
|---|---|---|---|
| Quadrant | BADHDUFLAG | Total packets | Discarded packets |
| A | 0 | 140 | 0 |
| B | 0 | 140 | 0 |
| C | 0 | 140 | 0 |
| D | 0 | 140 | 0 |
| Mode M0 | |||
|---|---|---|---|
| Quadrant | BADHDUFLAG | Total packets | Discarded packets |
| A | 0 | 15386 | 0 |
| B | 0 | 16142 | 0 |
| C | 0 | 37222 | 1 |
| D | 0 | 51593 | 0 |
| Quadrant | Total seconds | Saturated seconds | Saturation percentage |
|---|---|---|---|
| A | 7001 | 52 | 0.742751% |
| B | 7001 | 105 | 1.499786% |
| C | 7001 | 2525 | 36.066276% |
| D | 7001 | 4770 | 68.133124% |
Noise dominated data is calculated using 1-second bins in cleaned event files. If a bin has >2000 counts, and if more than 50% of those come from <1% of pixels, then it is considered to be noise-dominated and hence unusable.
| Quadrant | # 1 sec bins | Bins with >0 counts | Bins with >2000 counts | High rate bins dominated by noise | Noise dominated (total time) | Noise dominated (detector-on time) | Marked lightcurve |
|---|---|---|---|---|---|---|---|
| A | 7000 | 7000 | 37 | 37 | 0.53% | 0.53% | 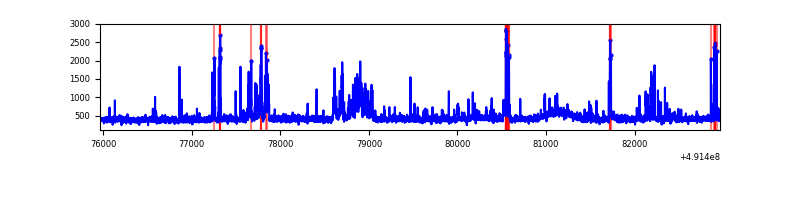 |
| B | 7000 | 7000 | 96 | 96 | 1.37% | 1.37% | 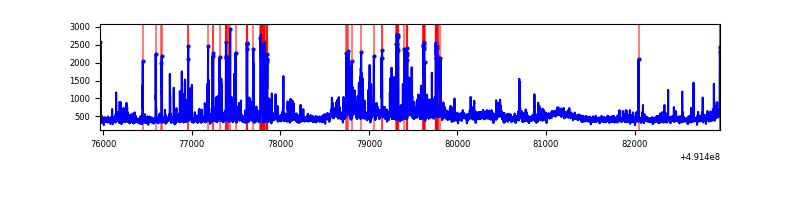 |
| C | 7001 | 7001 | 2617 | 2617 | 37.38% | 37.38% | 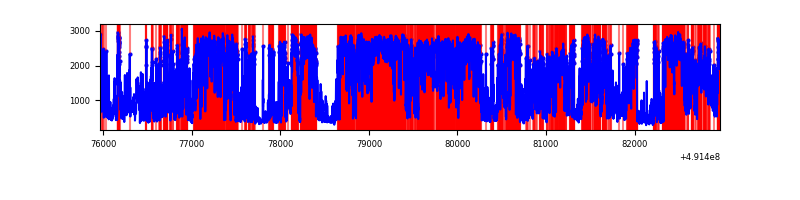 |
| D | 7001 | 7001 | 5102 | 5102 | 72.88% | 72.88% | 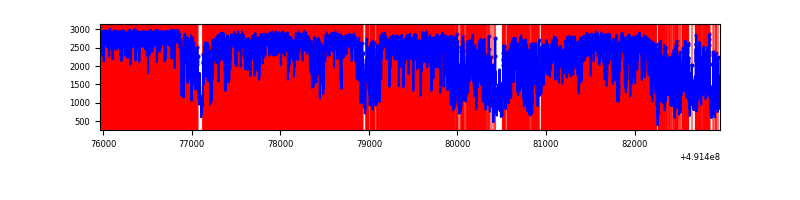 |
Top three noisy pixels from each quadrant. If the there are fewer than three noisy pixels in the level2.evt file, extra rows are filled as -1
| Pixel properties | Quadrant properties | ||||||
|---|---|---|---|---|---|---|---|
| Quadrant | DetID | PixID | Counts | Sigma | Mean | Median | Sigma |
| A | 7 | 206 | 177271 | 981.92 | 720 | 701 | 179.8 |
| A | 15 | 174 | 113095 | 625.03 | 720 | 701 | 179.8 |
| A | 5 | 240 | 60840 | 334.44 | 720 | 701 | 179.8 |
| B | 7 | 0 | 237504 | 1554.82 | 710 | 685 | 152.3 |
| B | 2 | 249 | 191056 | 1249.87 | 710 | 685 | 152.3 |
| B | 5 | 185 | 152057 | 993.82 | 710 | 685 | 152.3 |
| C | 1 | 241 | 4752632 | 28417.84 | 603 | 598 | 167.2 |
| C | 15 | 224 | 1546956 | 9247.44 | 603 | 598 | 167.2 |
| C | 0 | 240 | 1085036 | 6485.09 | 603 | 598 | 167.2 |
| D | 15 | 125 | 11125714 | 80149.35 | 477 | 454 | 138.8 |
| D | 10 | 117 | 1577538 | 11361.73 | 477 | 454 | 138.8 |
| D | 12 | 3 | 392280 | 2822.82 | 477 | 454 | 138.8 |
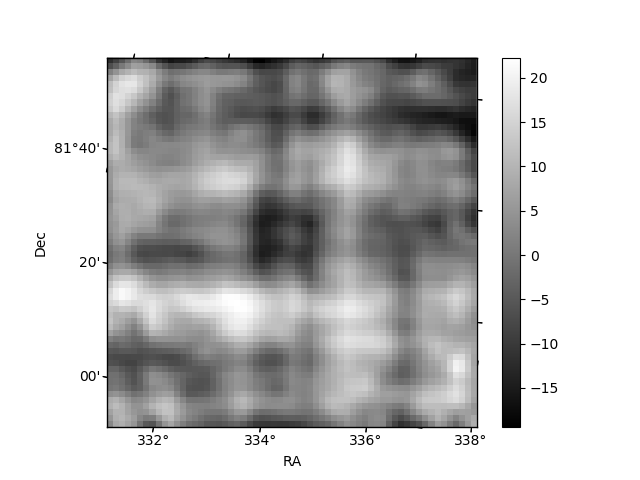
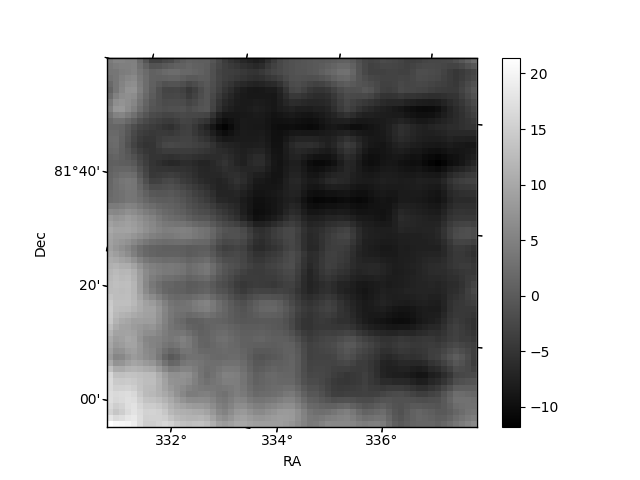
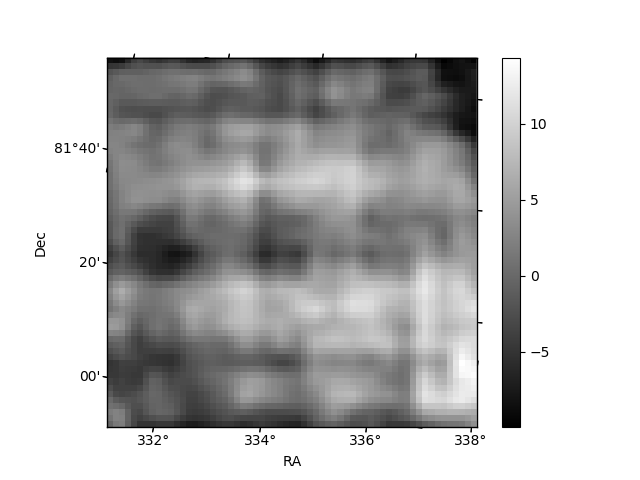
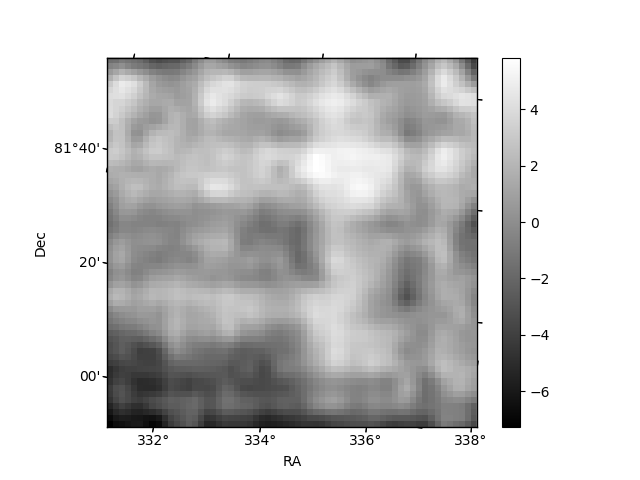
Histogram calculated using DETX and DETY for each event in the final _common_clean file
| Quadrant A | 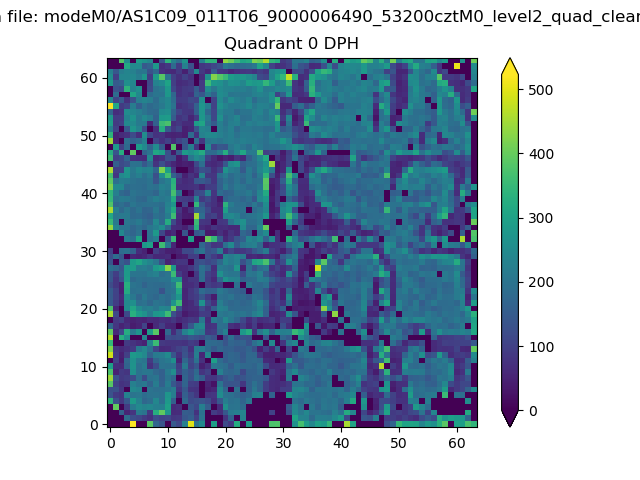 |
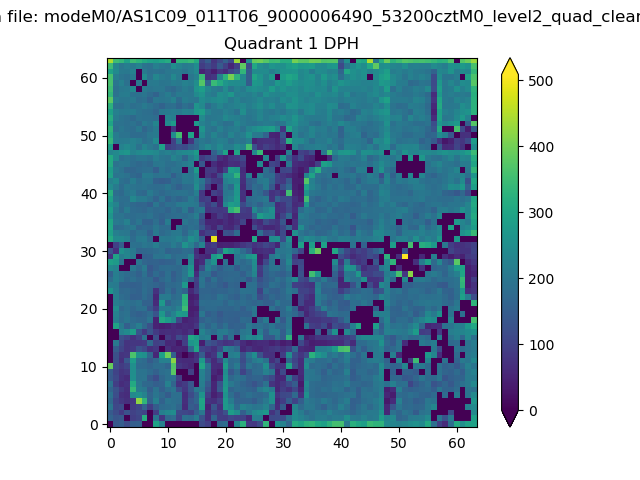 |
Quadrant B |
|---|---|---|---|
| Quadrant D | 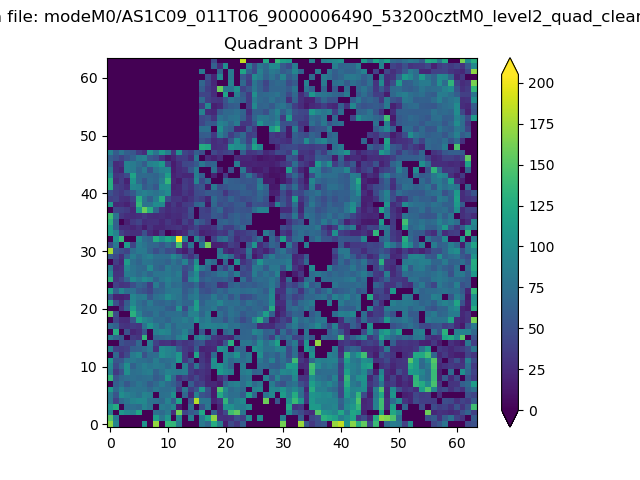 |
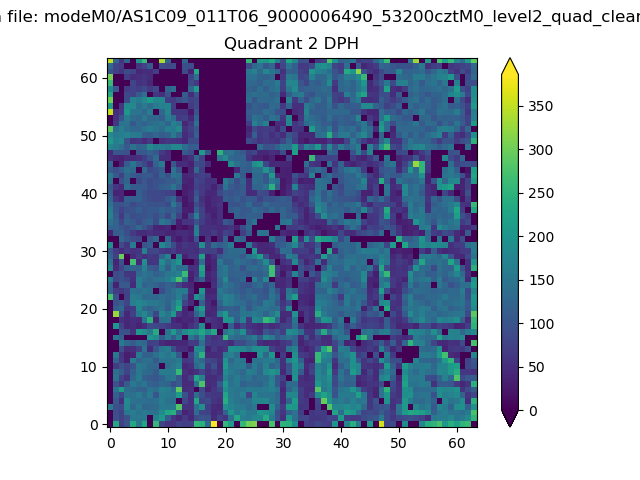 |
Quadrant C |
| Plot type | Count rate plots | Images |
|---|---|---|
| Comparison with Poisson distribution Blue bars denote a histogram of data divided into 1 sec bins. Red curve is a Poisson curve with rate = median count rate of data. |
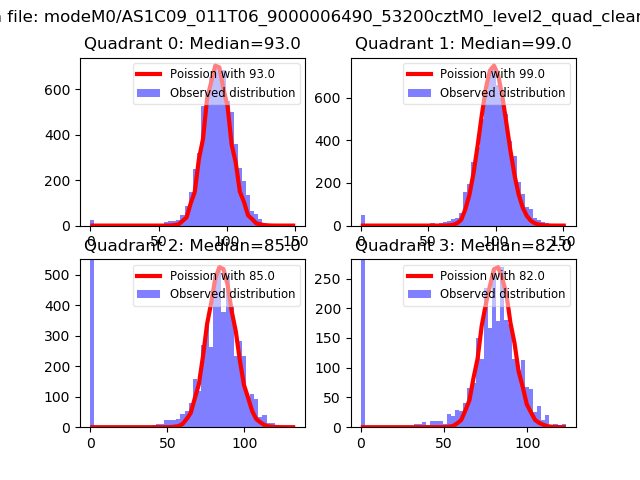 |
 |
| Quadrant-wise count rates Data is divided into 100 sec bins |
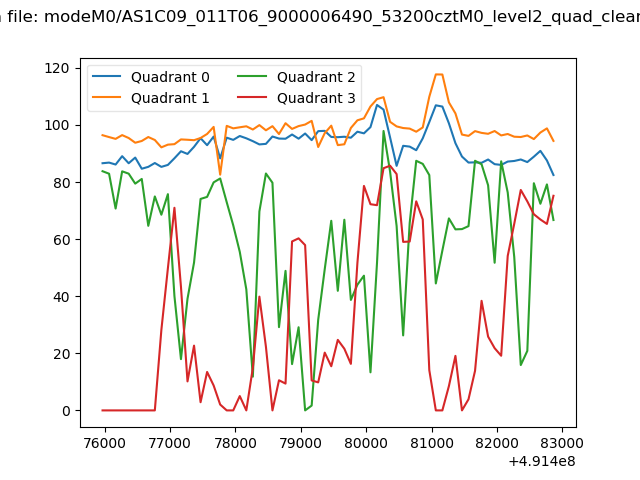 |
|
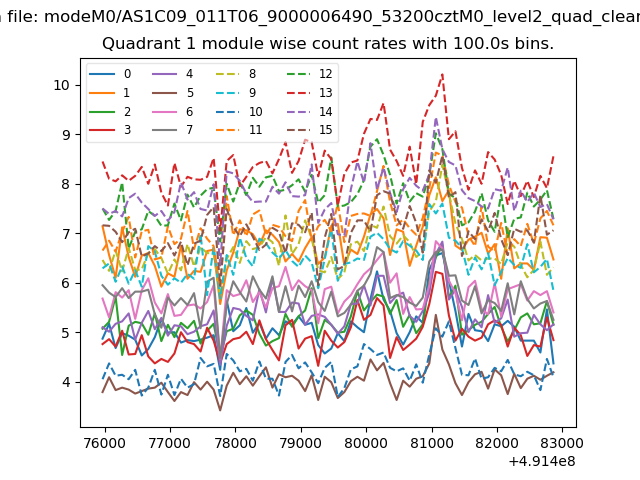
| Module-wise count rates for Quadrant A Data is divided into 100 sec bins |
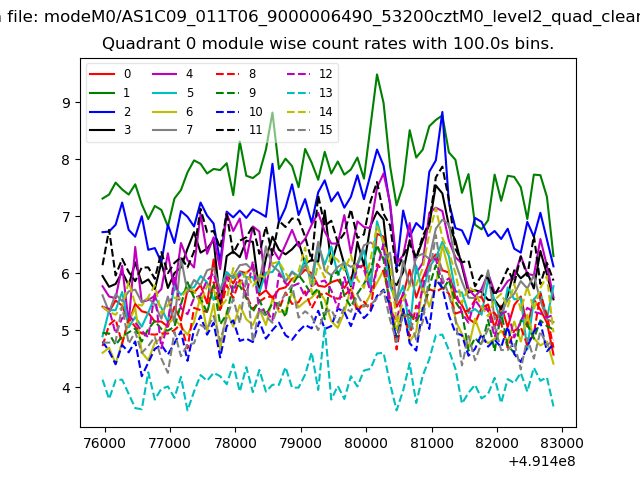 |
 |
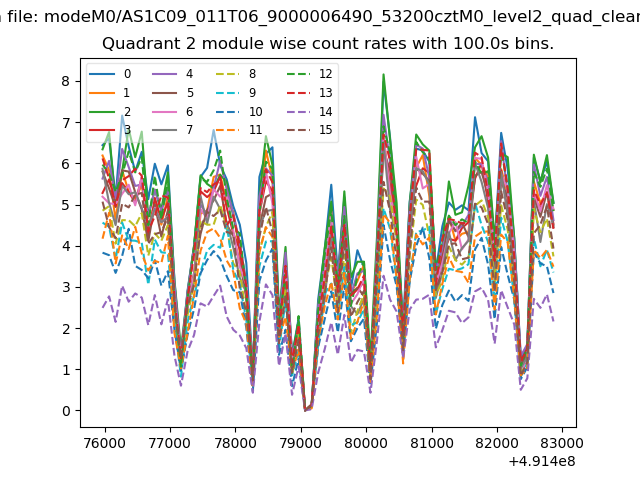
| Module-wise count rates for Quadrant B Data is divided into 100 sec bins |
 |
 |
| Module-wise count rates for Quadrant C Data is divided into 100 sec bins |
 |
 |
| Module-wise count rates for Quadrant D Data is divided into 100 sec bins |
 |
 |
| Parameter | Plot |
|---|---|
| CZT HV Monitor | 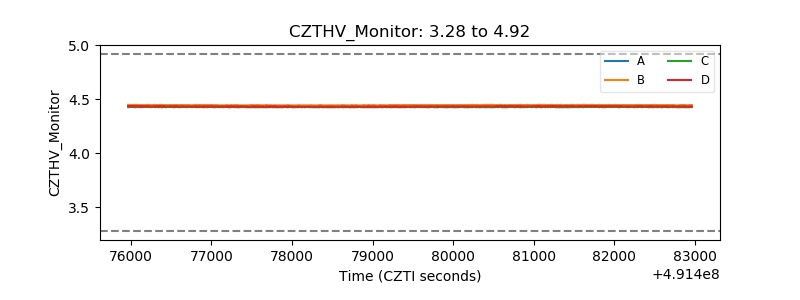 |
| D_VDD | 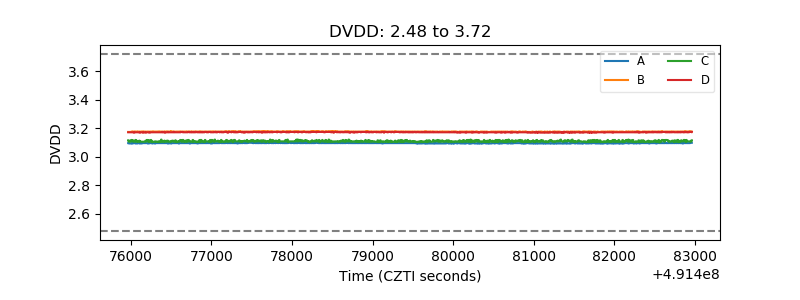 |
| Temperature 1 | 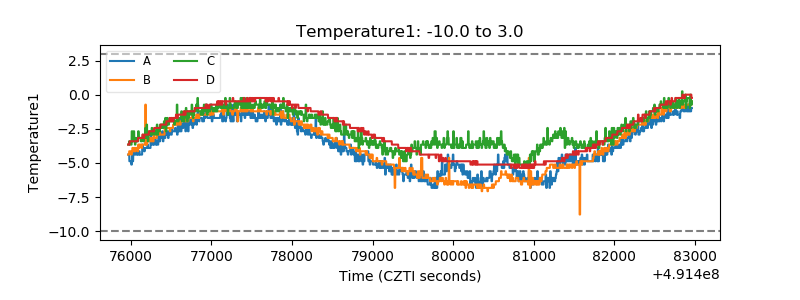 |
| Veto HV Monitor | 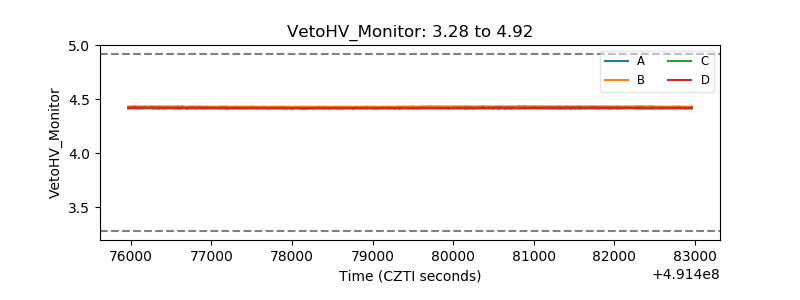 |
| Veto LLD | 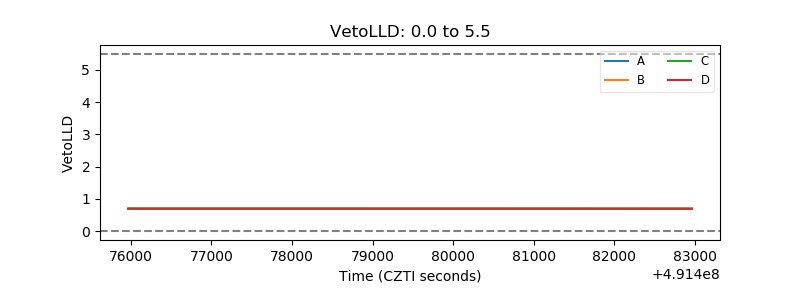 |
| Alpha Counter | 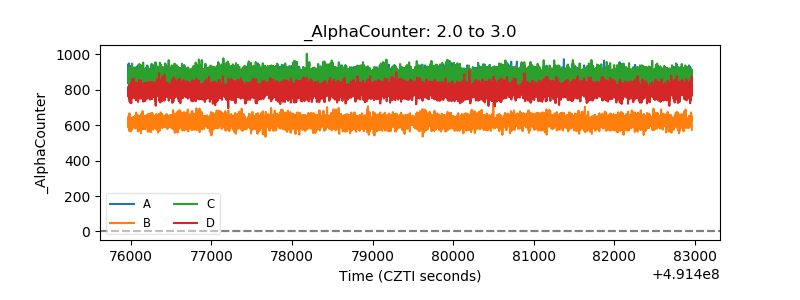 |
| _CPM_Rate | 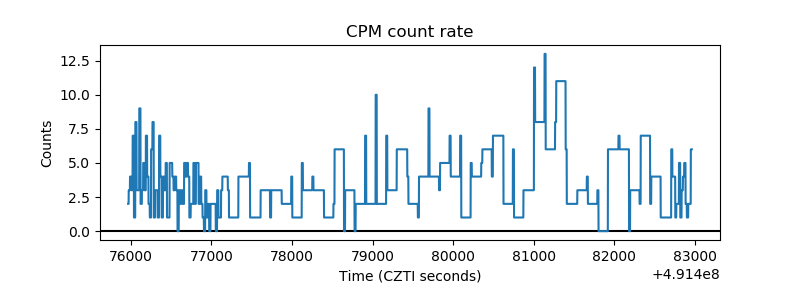 |
| CZT Counter | 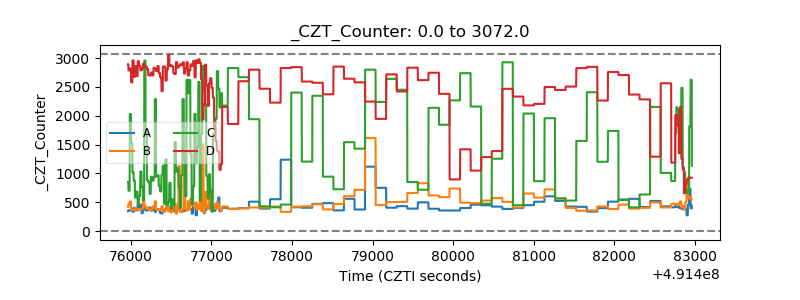 |
| +2.5 Volts monitor |  |
| +5 Volts monitor |  |
| _ROLL_ROT | 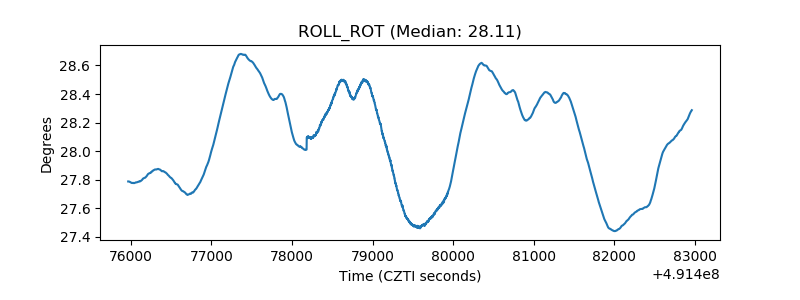 |
| _Roll_DEC | 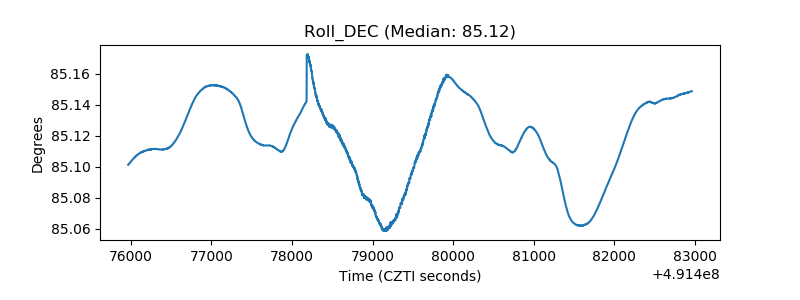 |
| _Roll_RA | 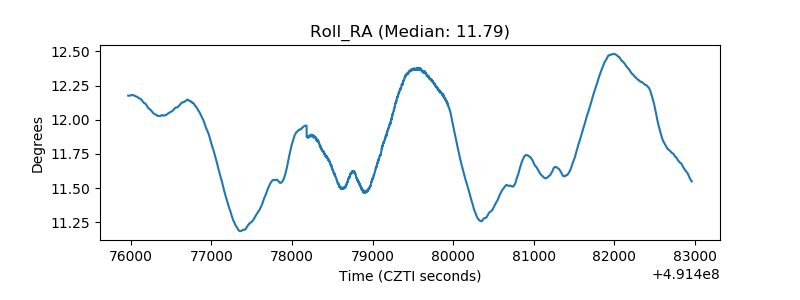 |
| Veto Counter | 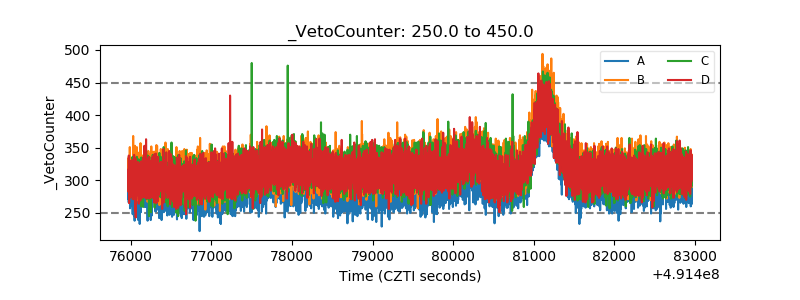 |