| Param | Original file | Final file |
|---|---|---|
| Filename | modeM0/AS1C09_011T06_9000006490_53203cztM0_level2.fits | modeM0/AS1C09_011T06_9000006490_53203cztM0_level2_quad_clean.evt |
| Size (bytes) | 2,046,709,440 | 222,877,440 |
| Size | 1.9 GB | 212.6 MB |
| Events in quadrant A | 10,368,837 | 1,642,757 |
| Events in quadrant B | 9,599,018 | 1,776,961 |
| Events in quadrant C | 18,387,889 | 1,318,891 |
| Events in quadrant D | 36,011,862 | 761,322 |
| Mode M9 | |||
|---|---|---|---|
| Quadrant | BADHDUFLAG | Total packets | Discarded packets |
| A | 0 | 13 | 0 |
| B | 0 | 13 | 0 |
| C | 0 | 13 | 0 |
| D | 0 | 13 | 0 |
| Mode SS | |||
|---|---|---|---|
| Quadrant | BADHDUFLAG | Total packets | Discarded packets |
| A | 0 | 368 | 0 |
| B | 0 | 368 | 0 |
| C | 0 | 368 | 0 |
| D | 0 | 368 | 0 |
| Mode M0 | |||
|---|---|---|---|
| Quadrant | BADHDUFLAG | Total packets | Discarded packets |
| A | 0 | 43631 | 3 |
| B | 0 | 41210 | 3 |
| C | 0 | 67347 | 3 |
| D | 0 | 119467 | 3 |
| Quadrant | Total seconds | Saturated seconds | Saturation percentage |
|---|---|---|---|
| A | 18088 | 578 | 3.195489% |
| B | 18088 | 299 | 1.653030% |
| C | 18088 | 2948 | 16.298098% |
| D | 18088 | 9724 | 53.759398% |
Noise dominated data is calculated using 1-second bins in cleaned event files. If a bin has >2000 counts, and if more than 50% of those come from <1% of pixels, then it is considered to be noise-dominated and hence unusable.
| Quadrant | # 1 sec bins | Bins with >0 counts | Bins with >2000 counts | High rate bins dominated by noise | Noise dominated (total time) | Noise dominated (detector-on time) | Marked lightcurve |
|---|---|---|---|---|---|---|---|
| A | 19352 | 18089 | 306 | 306 | 1.58% | 1.69% | 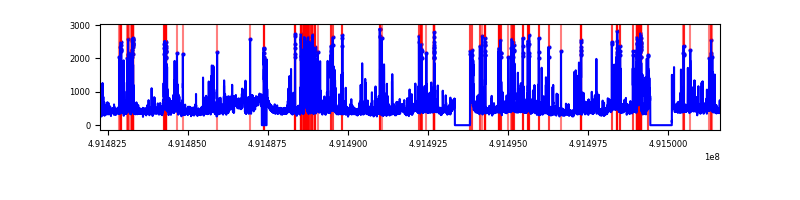 |
| B | 19352 | 18089 | 86 | 86 | 0.44% | 0.48% | 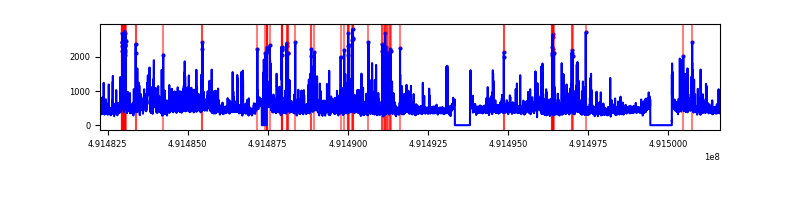 |
| C | 19352 | 18090 | 2762 | 2762 | 14.27% | 15.27% | 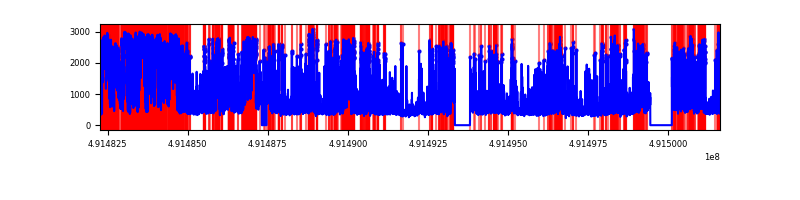 |
| D | 19352 | 18090 | 10446 | 10446 | 53.98% | 57.74% | 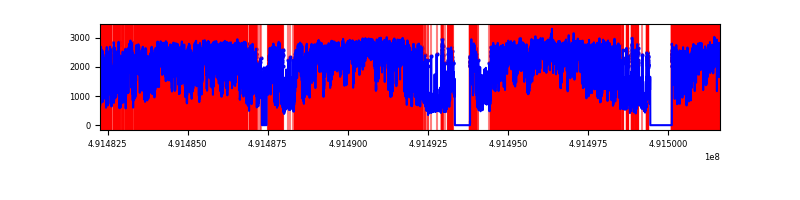 |
Top three noisy pixels from each quadrant. If the there are fewer than three noisy pixels in the level2.evt file, extra rows are filled as -1
| Pixel properties | Quadrant properties | ||||||
|---|---|---|---|---|---|---|---|
| Quadrant | DetID | PixID | Counts | Sigma | Mean | Median | Sigma |
| A | 15 | 174 | 698861 | 1482.16 | 1883 | 1834 | 470.3 |
| A | 7 | 206 | 535676 | 1135.16 | 1883 | 1834 | 470.3 |
| A | 3 | 62 | 427621 | 905.39 | 1883 | 1834 | 470.3 |
| B | 7 | 0 | 528759 | 1348.38 | 1865 | 1805 | 390.8 |
| B | 0 | 213 | 331158 | 842.76 | 1865 | 1805 | 390.8 |
| B | 4 | 81 | 319500 | 812.92 | 1865 | 1805 | 390.8 |
| C | 15 | 224 | 4494750 | 9534.29 | 1717 | 1700 | 471.3 |
| C | 1 | 241 | 2703019 | 5732.22 | 1717 | 1700 | 471.3 |
| C | 13 | 3 | 1426817 | 3024.11 | 1717 | 1700 | 471.3 |
| D | 15 | 125 | 25883802 | 59523.84 | 1495 | 1425 | 434.8 |
| D | 10 | 172 | 790414 | 1814.5 | 1495 | 1425 | 434.8 |
| D | 12 | 3 | 728138 | 1671.28 | 1495 | 1425 | 434.8 |
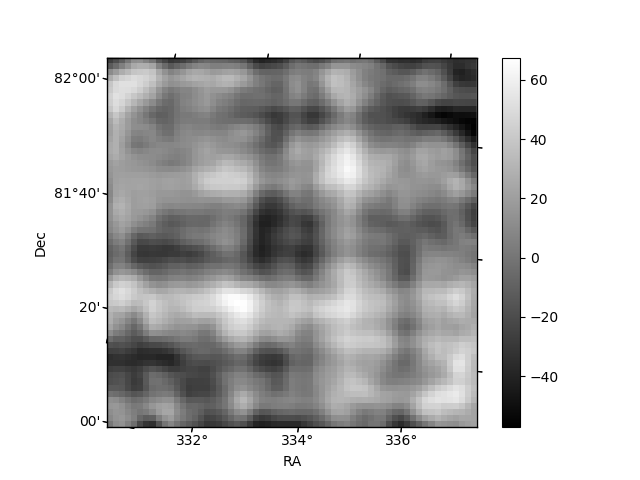
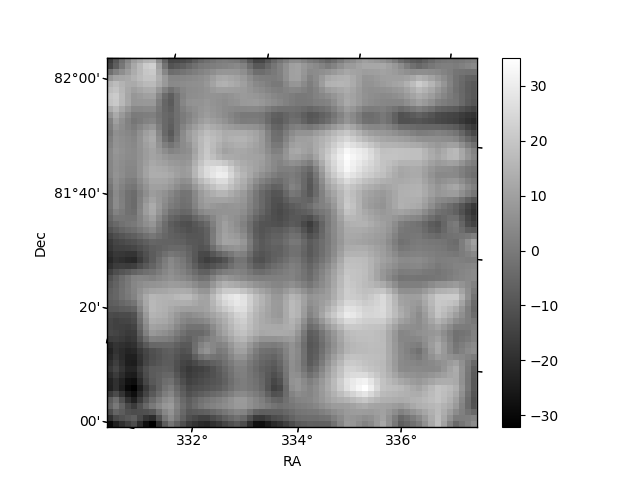
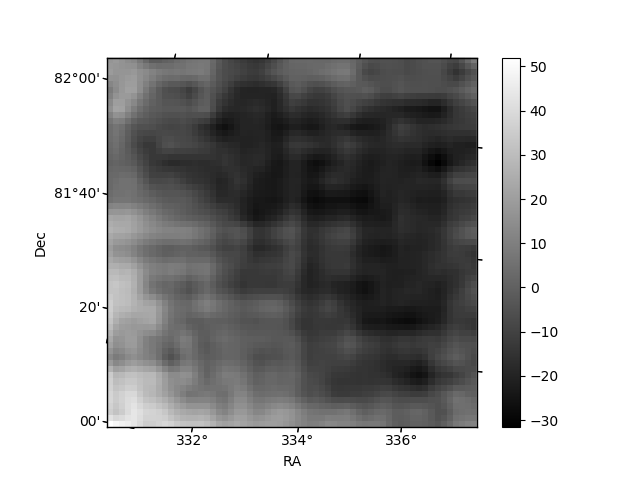
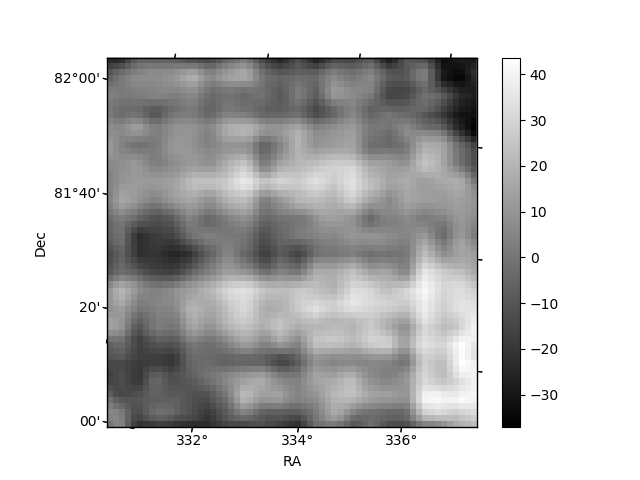
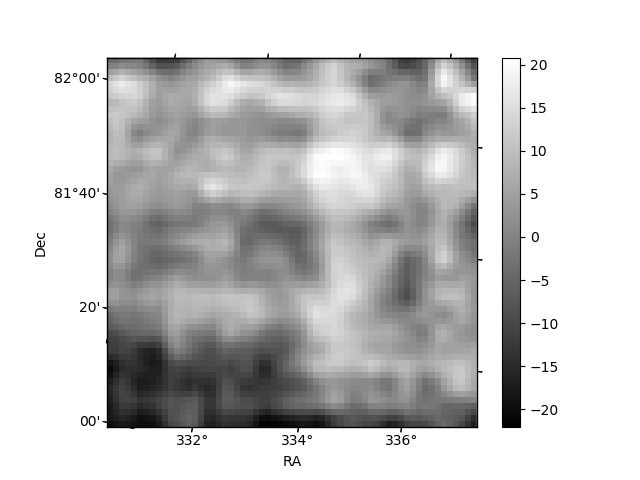
Histogram calculated using DETX and DETY for each event in the final _common_clean file
| Quadrant A | 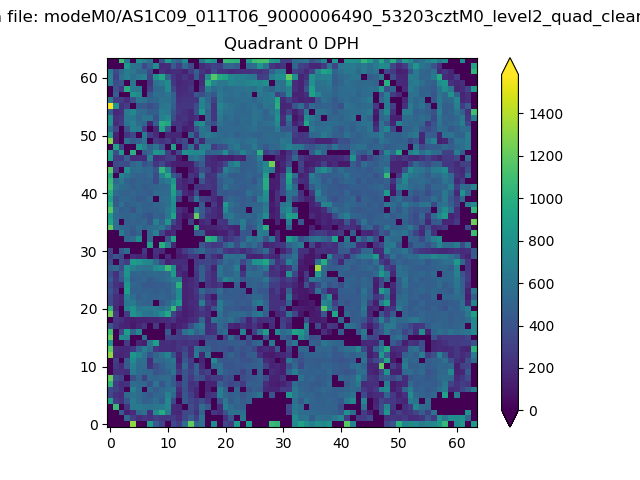 |
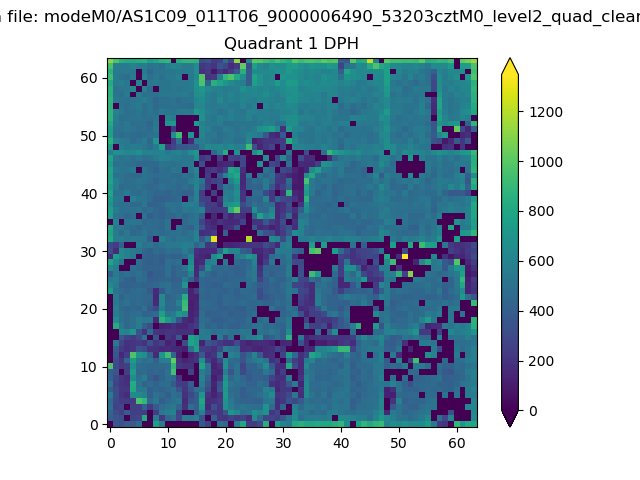 |
Quadrant B |
|---|---|---|---|
| Quadrant D | 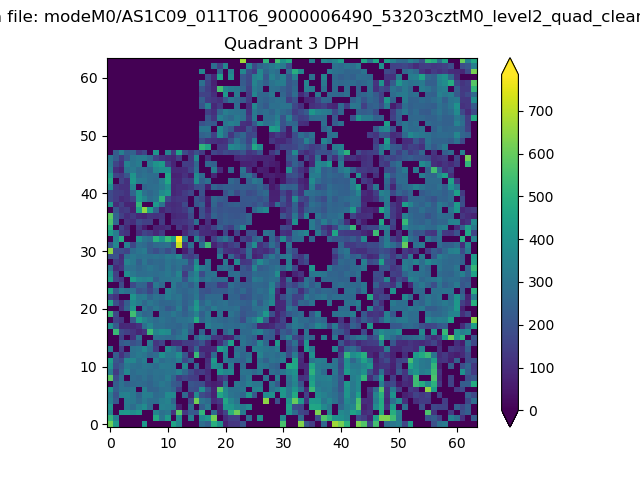 |
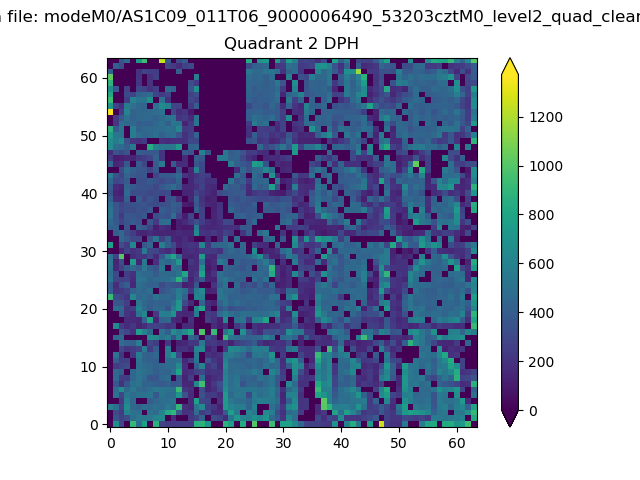 |
Quadrant C |
| Plot type | Count rate plots | Images |
|---|---|---|
| Comparison with Poisson distribution Blue bars denote a histogram of data divided into 1 sec bins. Red curve is a Poisson curve with rate = median count rate of data. |
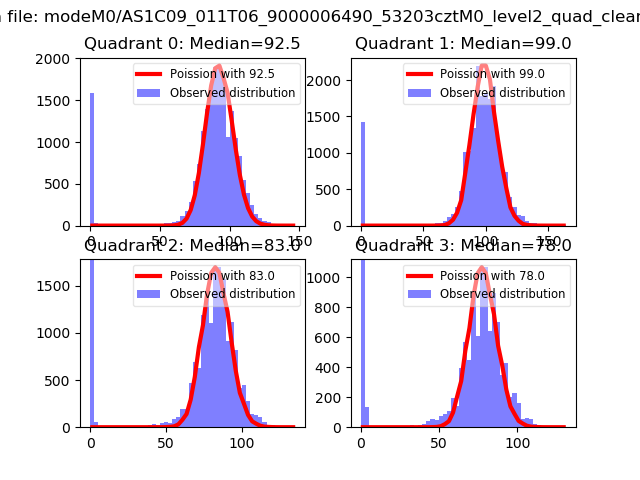 |
 |
| Quadrant-wise count rates Data is divided into 100 sec bins |
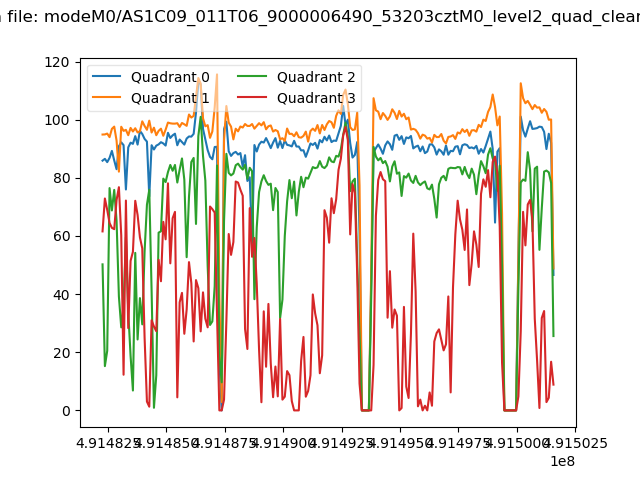 |
|
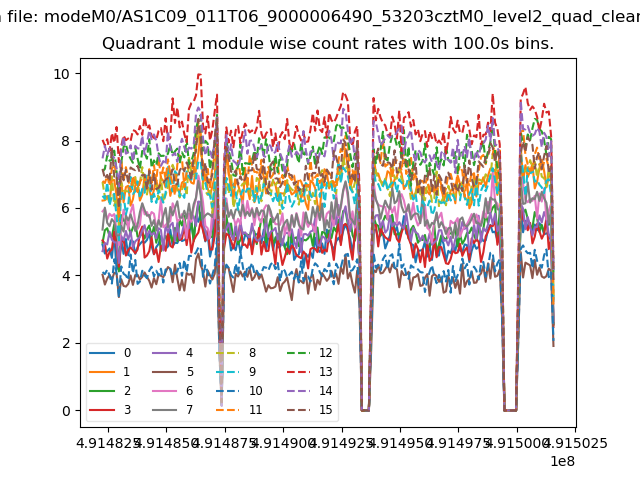
| Module-wise count rates for Quadrant A Data is divided into 100 sec bins |
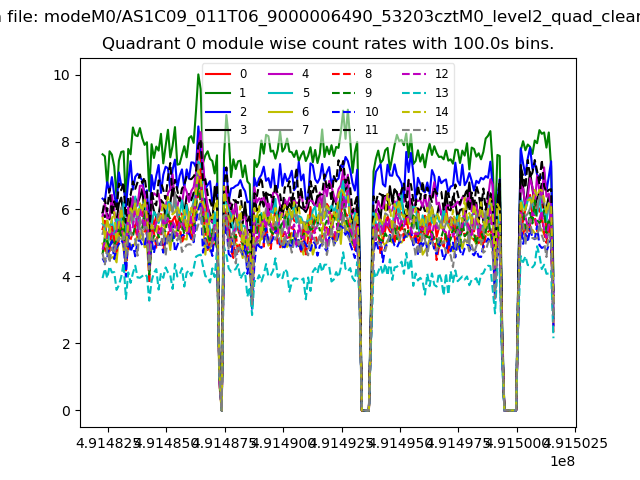 |
 |
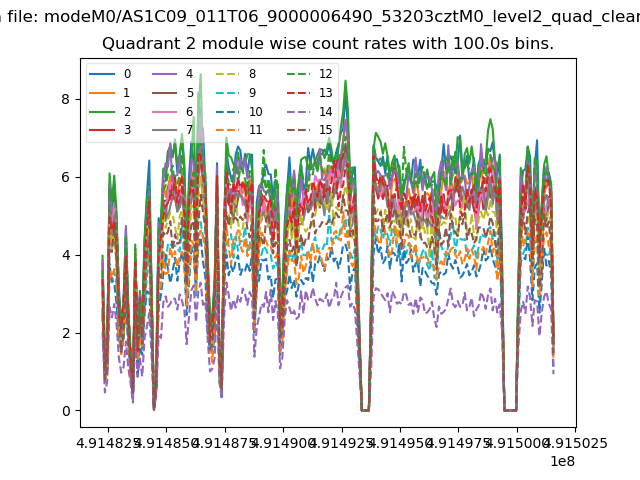
| Module-wise count rates for Quadrant B Data is divided into 100 sec bins |
 |
 |
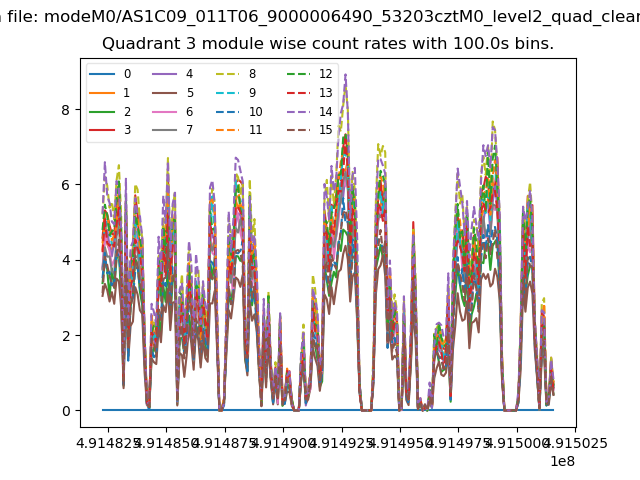
| Module-wise count rates for Quadrant C Data is divided into 100 sec bins |
 |
 |
| Module-wise count rates for Quadrant D Data is divided into 100 sec bins |
 |
 |
| Parameter | Plot |
|---|---|
| CZT HV Monitor |  |
| D_VDD | 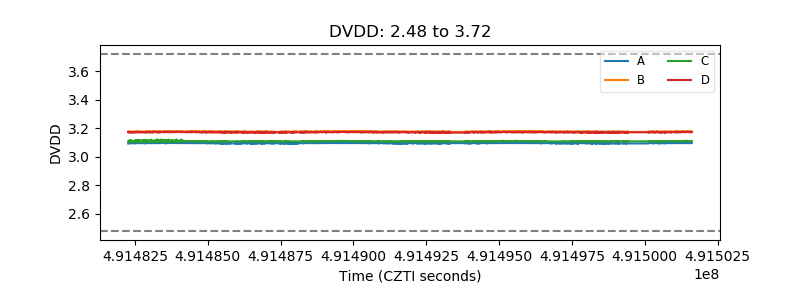 |
| Temperature 1 | 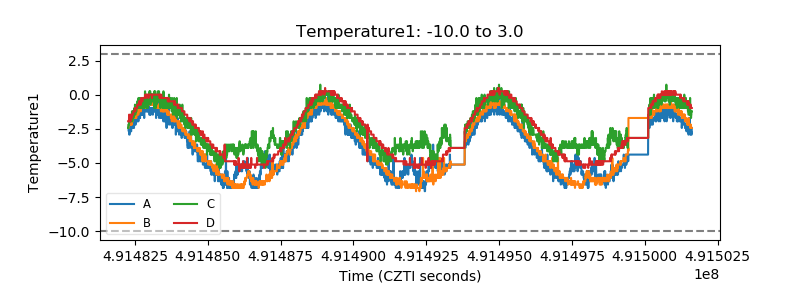 |
| Veto HV Monitor | 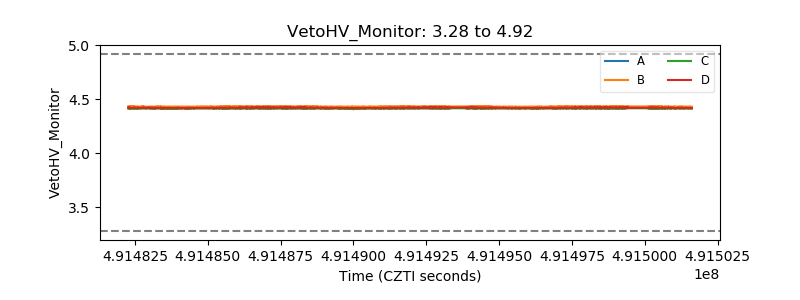 |
| Veto LLD | 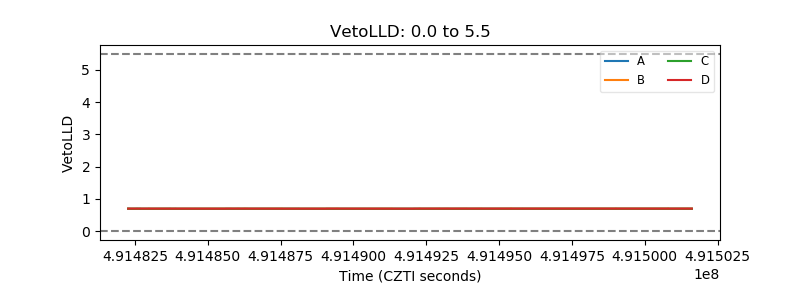 |
| Alpha Counter | 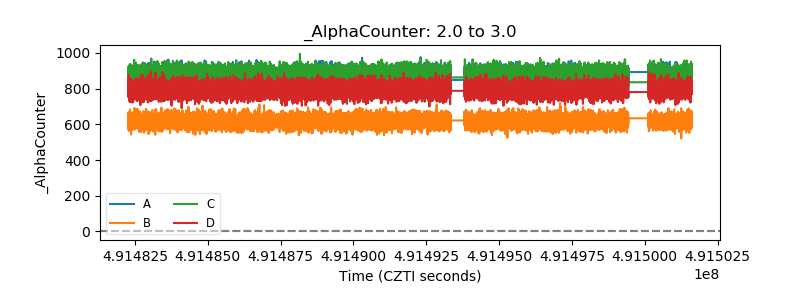 |
| _CPM_Rate | 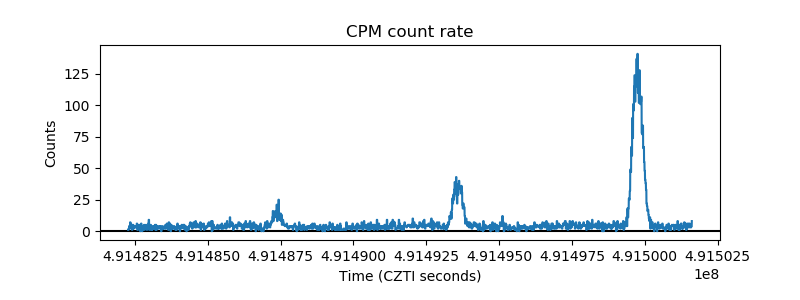 |
| CZT Counter | 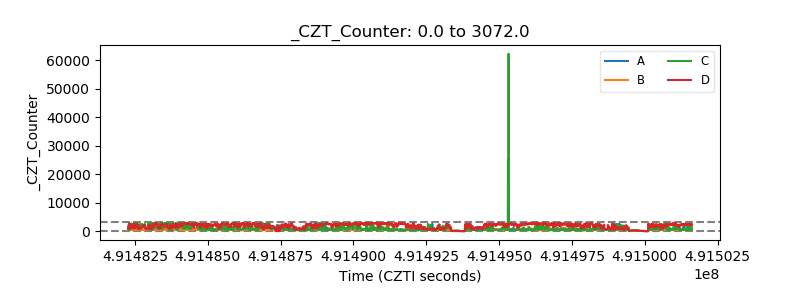 |
| +2.5 Volts monitor | 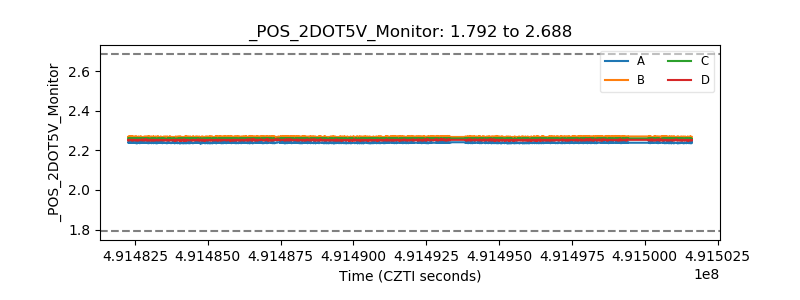 |
| +5 Volts monitor |  |
| _ROLL_ROT | 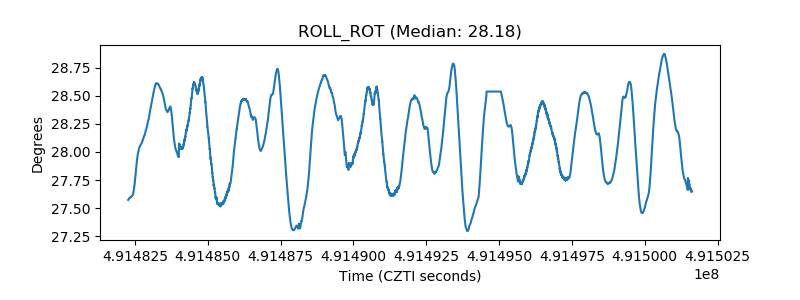 |
| _Roll_DEC | 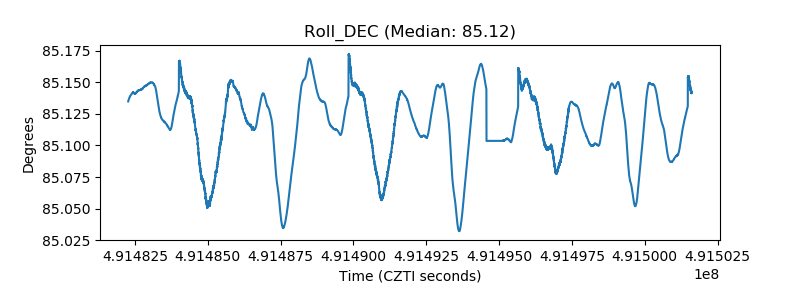 |
| _Roll_RA | 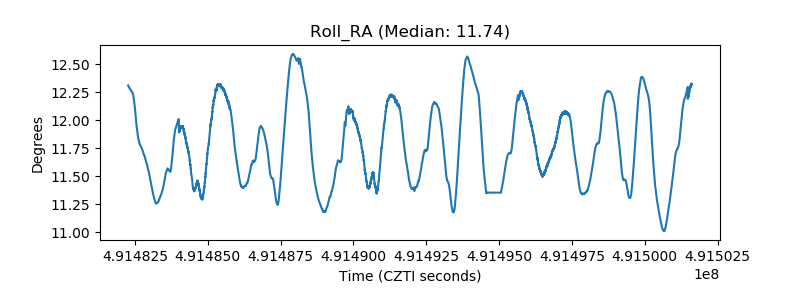 |
| Veto Counter | 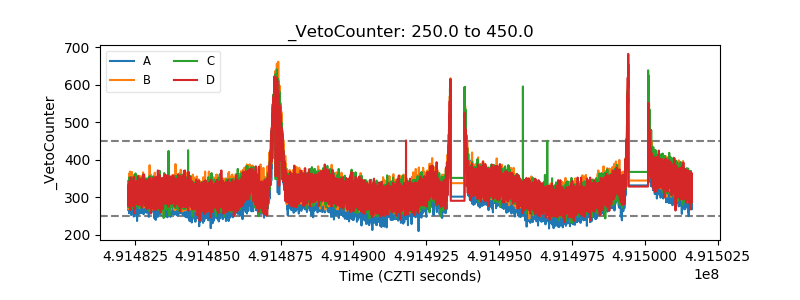 |