| Param | Original file | Final file |
|---|---|---|
| Filename | modeM0/AS1C09_011T06_9000006490_53204cztM0_level2.fits | modeM0/AS1C09_011T06_9000006490_53204cztM0_level2_quad_clean.evt |
| Size (bytes) | 804,781,440 | 75,960,000 |
| Size | 767.5 MB | 72.4 MB |
| Events in quadrant A | 3,649,593 | 616,251 |
| Events in quadrant B | 3,128,970 | 654,867 |
| Events in quadrant C | 7,073,052 | 432,281 |
| Events in quadrant D | 15,434,441 | 142,234 |
| Mode M9 | |||
|---|---|---|---|
| Quadrant | BADHDUFLAG | Total packets | Discarded packets |
| A | 0 | 8 | 0 |
| B | 0 | 8 | 0 |
| C | 0 | 8 | 0 |
| D | 0 | 8 | 0 |
| Mode SS | |||
|---|---|---|---|
| Quadrant | BADHDUFLAG | Total packets | Discarded packets |
| A | 0 | 134 | 0 |
| B | 0 | 134 | 0 |
| C | 0 | 134 | 0 |
| D | 0 | 134 | 0 |
| Mode M0 | |||
|---|---|---|---|
| Quadrant | BADHDUFLAG | Total packets | Discarded packets |
| A | 0 | 15639 | 1 |
| B | 0 | 14051 | 3 |
| C | 0 | 25663 | 1 |
| D | 0 | 50364 | 1 |
| Quadrant | Total seconds | Saturated seconds | Saturation percentage |
|---|---|---|---|
| A | 6502 | 174 | 2.676100% |
| B | 6502 | 70 | 1.076592% |
| C | 6502 | 1724 | 26.514918% |
| D | 6502 | 5140 | 79.052599% |
Noise dominated data is calculated using 1-second bins in cleaned event files. If a bin has >2000 counts, and if more than 50% of those come from <1% of pixels, then it is considered to be noise-dominated and hence unusable.
| Quadrant | # 1 sec bins | Bins with >0 counts | Bins with >2000 counts | High rate bins dominated by noise | Noise dominated (total time) | Noise dominated (detector-on time) | Marked lightcurve |
|---|---|---|---|---|---|---|---|
| A | 7367 | 6503 | 118 | 118 | 1.60% | 1.81% | 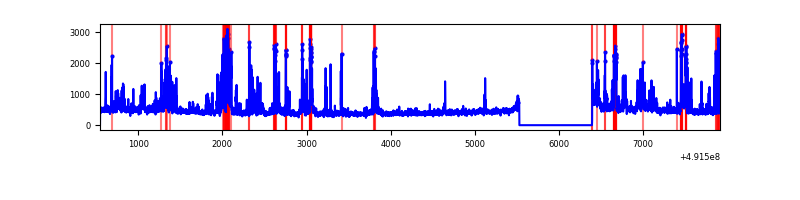 |
| B | 7367 | 6503 | 14 | 14 | 0.19% | 0.22% | 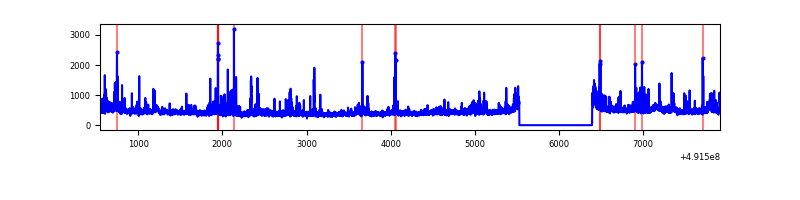 |
| C | 7367 | 6503 | 1340 | 1340 | 18.19% | 20.61% | 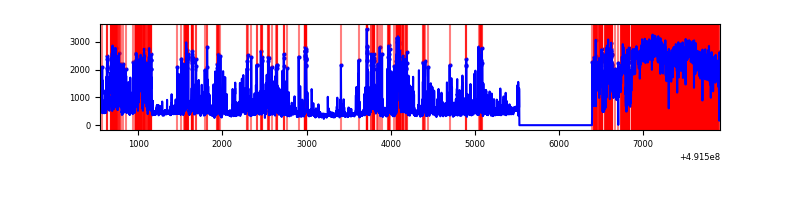 |
| D | 7367 | 6503 | 5355 | 5355 | 72.69% | 82.35% | 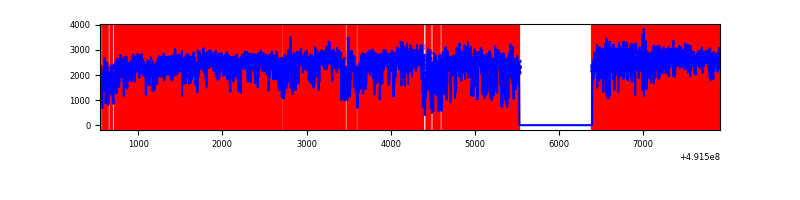 |
Top three noisy pixels from each quadrant. If the there are fewer than three noisy pixels in the level2.evt file, extra rows are filled as -1
| Pixel properties | Quadrant properties | ||||||
|---|---|---|---|---|---|---|---|
| Quadrant | DetID | PixID | Counts | Sigma | Mean | Median | Sigma |
| A | 15 | 174 | 370670 | 2178.53 | 677 | 657 | 169.8 |
| A | 4 | 249 | 172128 | 1009.57 | 677 | 657 | 169.8 |
| A | 3 | 62 | 119975 | 702.51 | 677 | 657 | 169.8 |
| B | 10 | 247 | 107753 | 744.56 | 672 | 648 | 143.9 |
| B | 0 | 213 | 93408 | 644.84 | 672 | 648 | 143.9 |
| B | 5 | 185 | 69974 | 481.93 | 672 | 648 | 143.9 |
| C | 15 | 165 | 3023917 | 20982.79 | 519 | 513 | 144.1 |
| C | 15 | 224 | 1396521 | 9688.46 | 519 | 513 | 144.1 |
| C | 0 | 240 | 237355 | 1643.71 | 519 | 513 | 144.1 |
| D | 15 | 125 | 12412314 | 103750.41 | 409 | 389 | 119.6 |
| D | 2 | 62 | 370115 | 3090.51 | 409 | 389 | 119.6 |
| D | 8 | 176 | 333366 | 2783.33 | 409 | 389 | 119.6 |
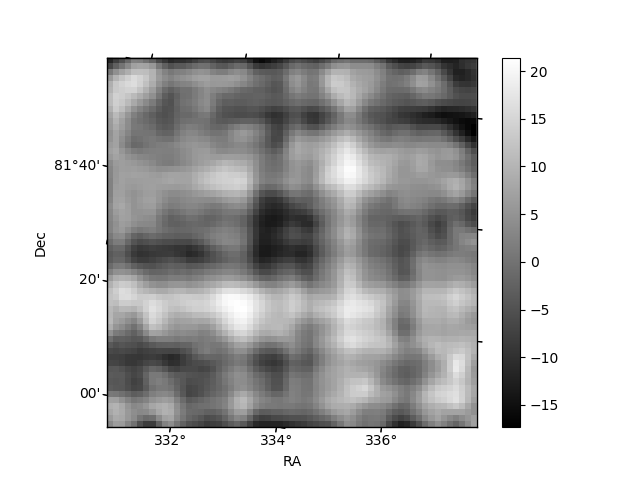
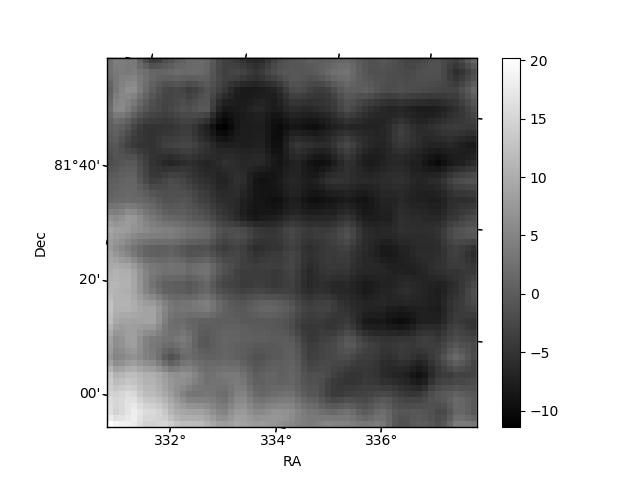
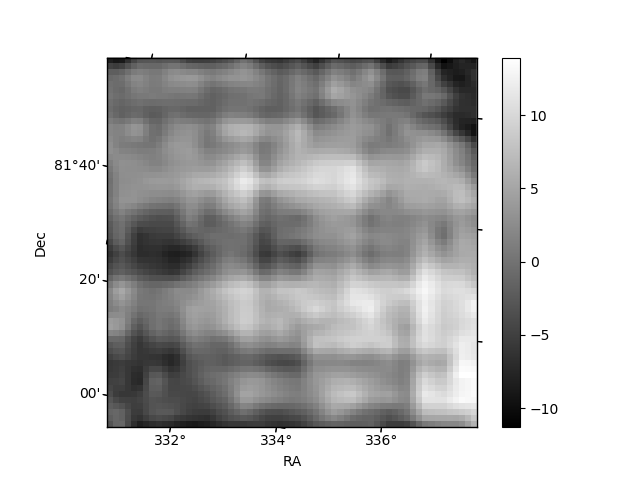
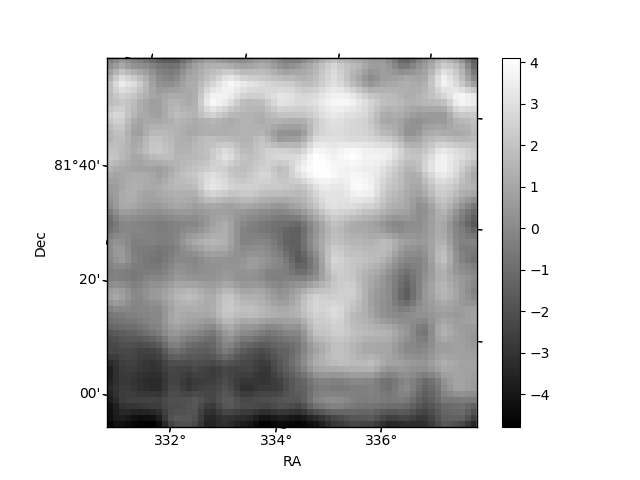
Histogram calculated using DETX and DETY for each event in the final _common_clean file
| Quadrant A | 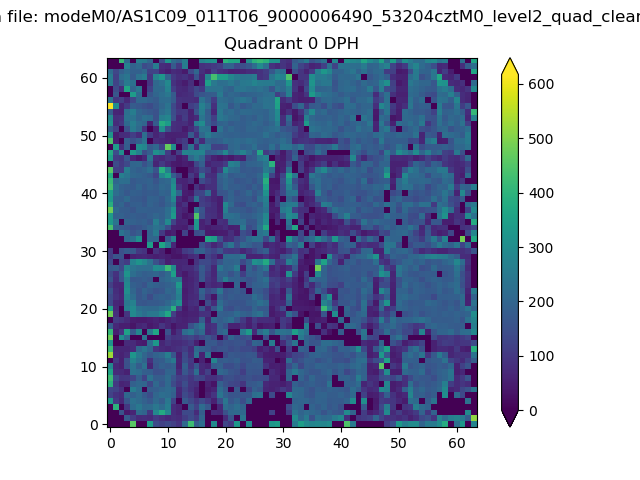 |
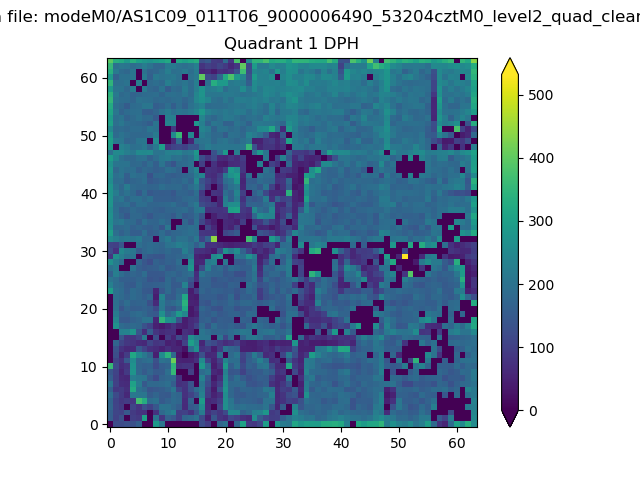 |
Quadrant B |
|---|---|---|---|
| Quadrant D | 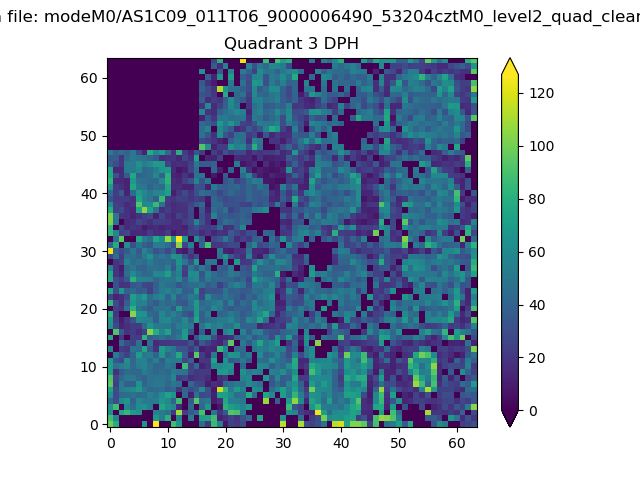 |
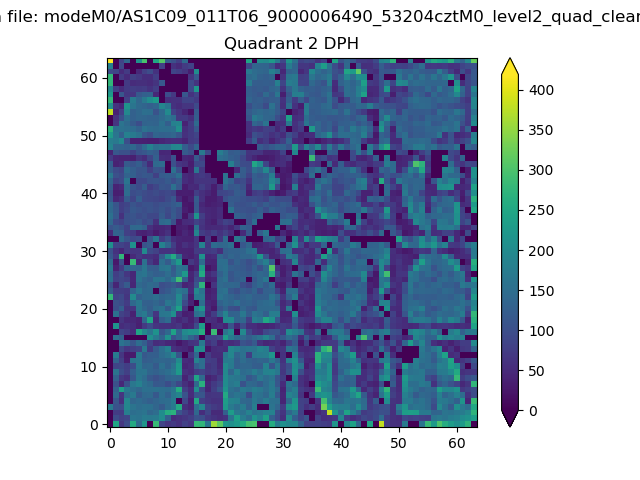 |
Quadrant C |
| Plot type | Count rate plots | Images |
|---|---|---|
| Comparison with Poisson distribution Blue bars denote a histogram of data divided into 1 sec bins. Red curve is a Poisson curve with rate = median count rate of data. |
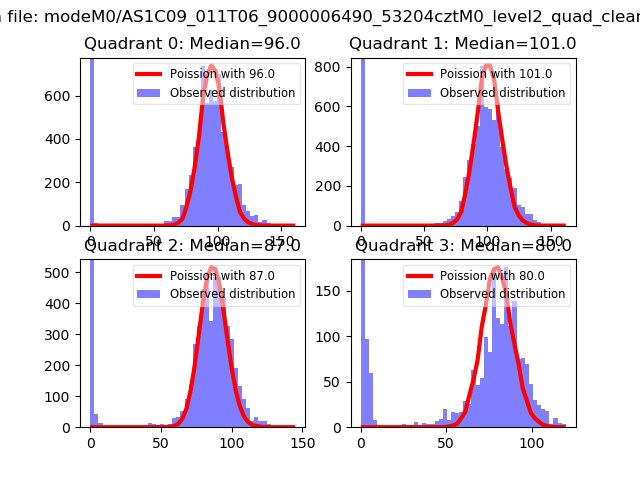 |
 |
| Quadrant-wise count rates Data is divided into 100 sec bins |
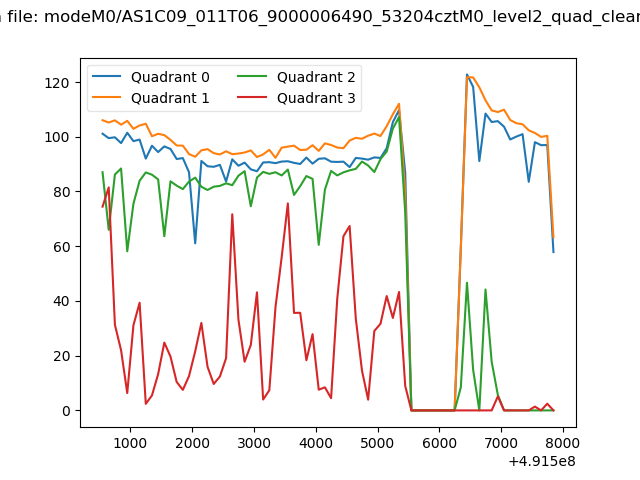 |
|
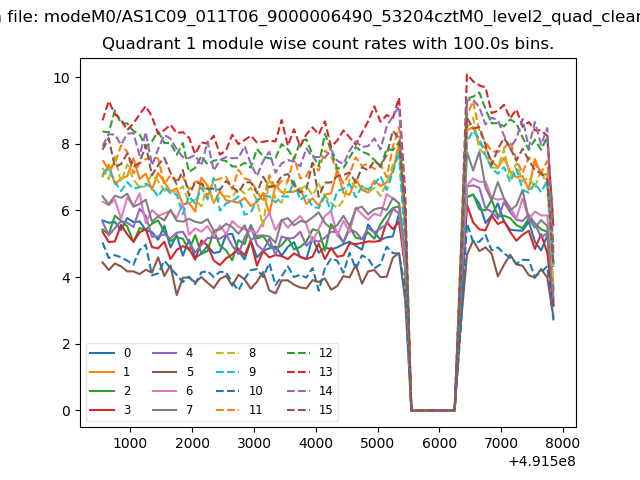
| Module-wise count rates for Quadrant A Data is divided into 100 sec bins |
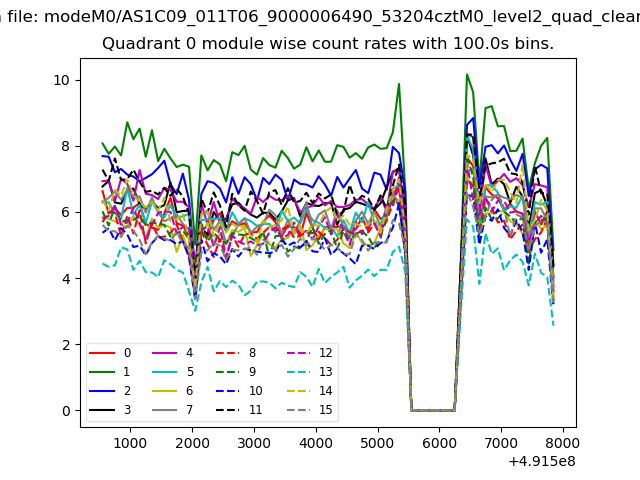 |
 |
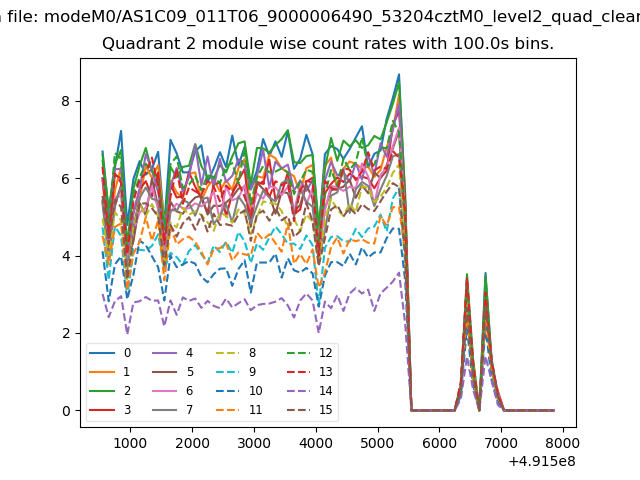
| Module-wise count rates for Quadrant B Data is divided into 100 sec bins |
 |
 |
| Module-wise count rates for Quadrant C Data is divided into 100 sec bins |
 |
 |
| Module-wise count rates for Quadrant D Data is divided into 100 sec bins |
 |
 |
| Parameter | Plot |
|---|---|
| CZT HV Monitor | 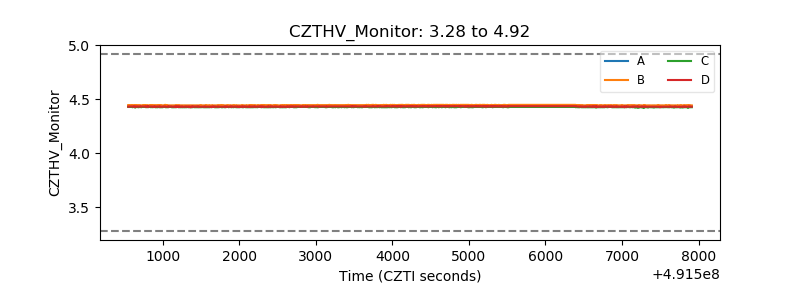 |
| D_VDD | 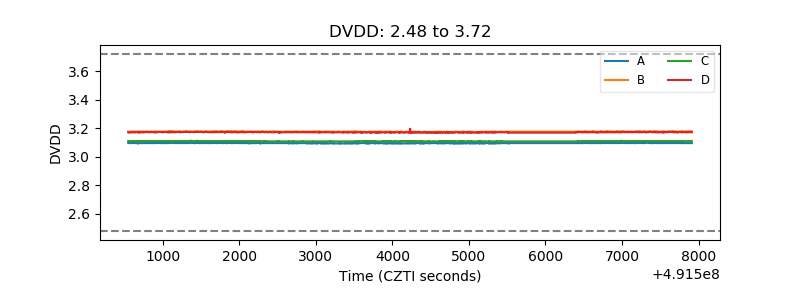 |
| Temperature 1 | 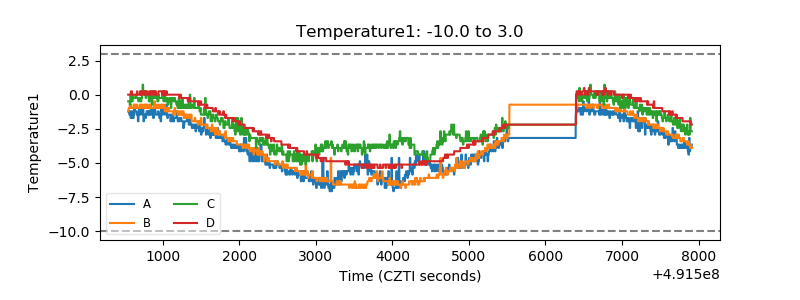 |
| Veto HV Monitor | 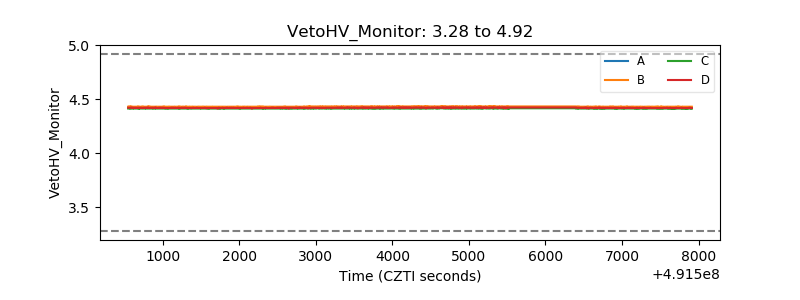 |
| Veto LLD |  |
| Alpha Counter | 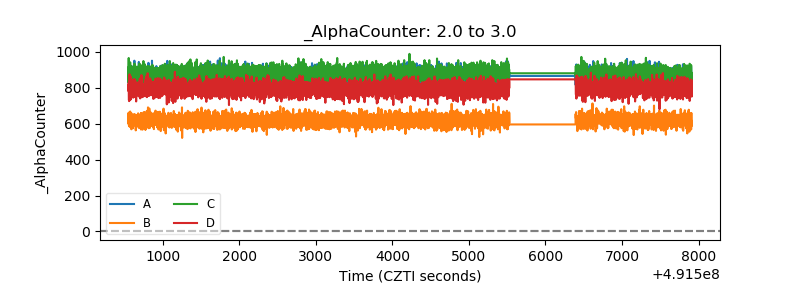 |
| _CPM_Rate | 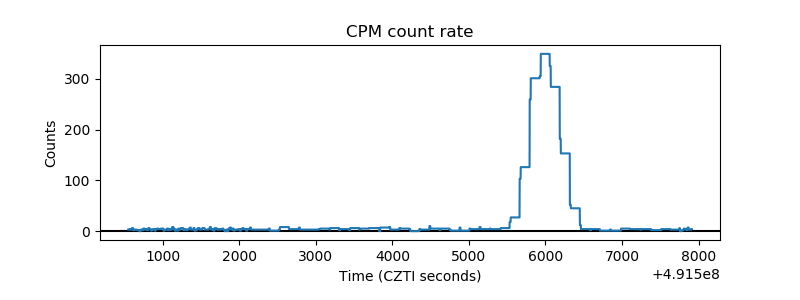 |
| CZT Counter | 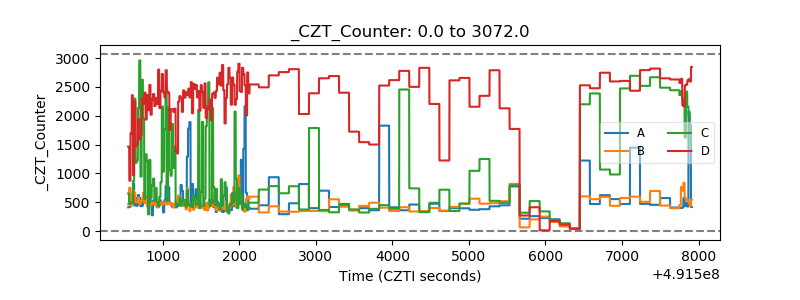 |
| +2.5 Volts monitor |  |
| +5 Volts monitor |  |
| _ROLL_ROT | 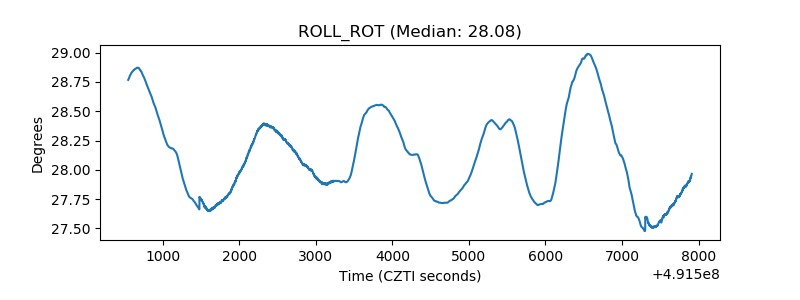 |
| _Roll_DEC | 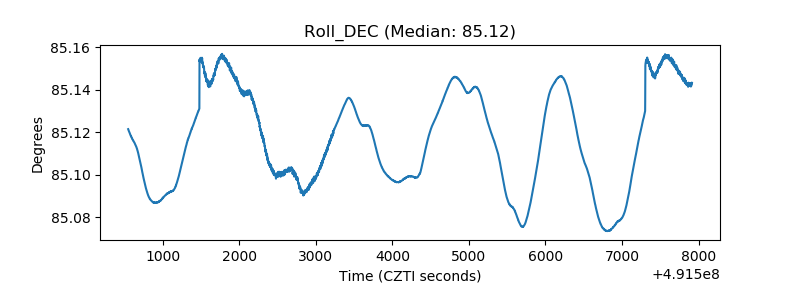 |
| _Roll_RA | 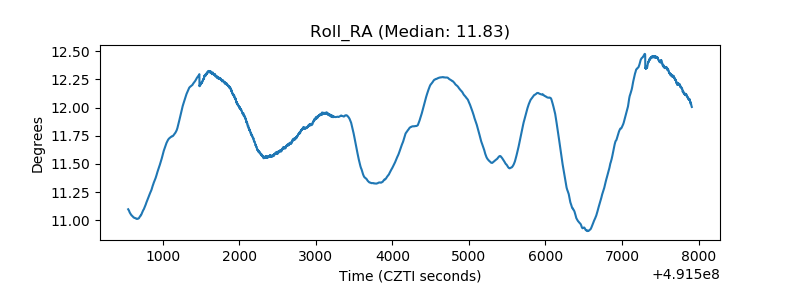 |
| Veto Counter | 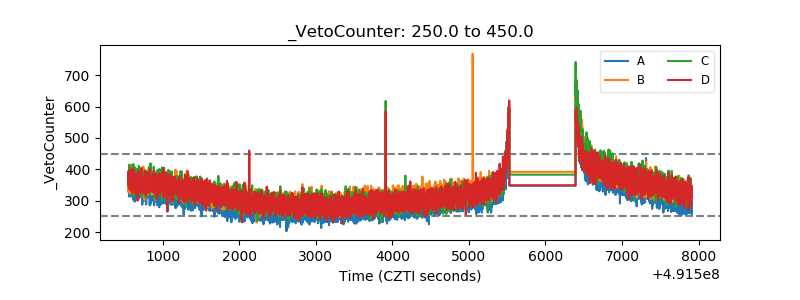 |