| Param | Original file | Final file |
|---|---|---|
| Filename | modeM0/AS1C09_011T06_9000006490_53206cztM0_level2.fits | modeM0/AS1C09_011T06_9000006490_53206cztM0_level2_quad_clean.evt |
| Size (bytes) | 894,908,160 | 68,146,560 |
| Size | 853.5 MB | 65.0 MB |
| Events in quadrant A | 3,775,259 | 587,375 |
| Events in quadrant B | 3,284,887 | 643,719 |
| Events in quadrant C | 11,602,086 | 180,408 |
| Events in quadrant D | 13,980,390 | 215,154 |
| Mode M9 | |||
|---|---|---|---|
| Quadrant | BADHDUFLAG | Total packets | Discarded packets |
| A | 0 | 10 | 0 |
| B | 0 | 10 | 0 |
| C | 0 | 10 | 0 |
| D | 0 | 10 | 0 |
| Mode SS | |||
|---|---|---|---|
| Quadrant | BADHDUFLAG | Total packets | Discarded packets |
| A | 0 | 128 | 0 |
| B | 0 | 128 | 0 |
| C | 0 | 128 | 0 |
| D | 0 | 128 | 0 |
| Mode M0 | |||
|---|---|---|---|
| Quadrant | BADHDUFLAG | Total packets | Discarded packets |
| A | 0 | 15965 | 1 |
| B | 0 | 14165 | 1 |
| C | 0 | 38809 | 1 |
| D | 0 | 45832 | 1 |
| Quadrant | Total seconds | Saturated seconds | Saturation percentage |
|---|---|---|---|
| A | 6246 | 299 | 4.787064% |
| B | 6246 | 52 | 0.832533% |
| C | 6246 | 4592 | 73.519052% |
| D | 6246 | 4212 | 67.435159% |
Noise dominated data is calculated using 1-second bins in cleaned event files. If a bin has >2000 counts, and if more than 50% of those come from <1% of pixels, then it is considered to be noise-dominated and hence unusable.
| Quadrant | # 1 sec bins | Bins with >0 counts | Bins with >2000 counts | High rate bins dominated by noise | Noise dominated (total time) | Noise dominated (detector-on time) | Marked lightcurve |
|---|---|---|---|---|---|---|---|
| A | 7271 | 6247 | 210 | 210 | 2.89% | 3.36% | 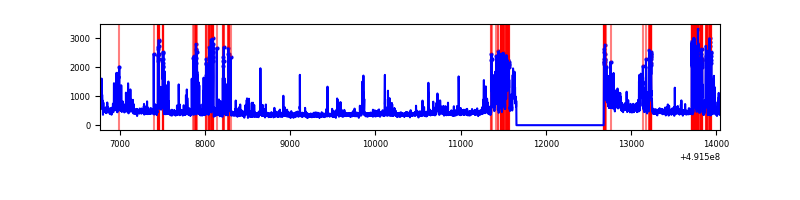 |
| B | 7271 | 6247 | 20 | 20 | 0.28% | 0.32% | 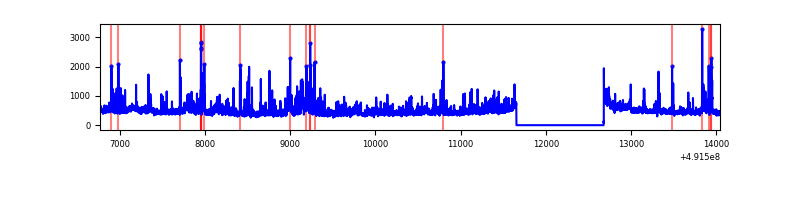 |
| C | 7271 | 6247 | 3232 | 3232 | 44.45% | 51.74% | 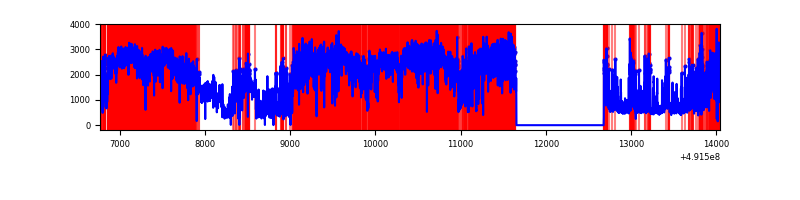 |
| D | 7271 | 6247 | 4377 | 4377 | 60.20% | 70.07% | 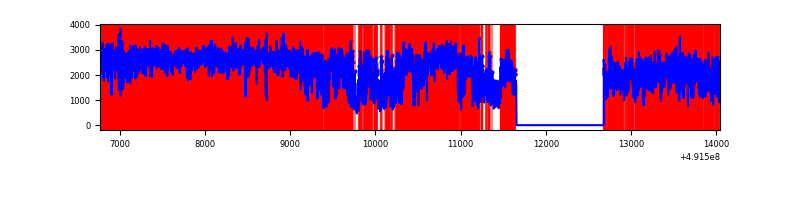 |
Top three noisy pixels from each quadrant. If the there are fewer than three noisy pixels in the level2.evt file, extra rows are filled as -1
| Pixel properties | Quadrant properties | ||||||
|---|---|---|---|---|---|---|---|
| Quadrant | DetID | PixID | Counts | Sigma | Mean | Median | Sigma |
| A | 15 | 174 | 505317 | 3093.38 | 640 | 623 | 163.2 |
| A | 0 | 8 | 318421 | 1947.85 | 640 | 623 | 163.2 |
| A | 3 | 62 | 182865 | 1117.0 | 640 | 623 | 163.2 |
| B | 4 | 81 | 157382 | 1137.06 | 647 | 624 | 137.9 |
| B | 0 | 213 | 139549 | 1007.71 | 647 | 624 | 137.9 |
| B | 10 | 247 | 94778 | 682.96 | 647 | 624 | 137.9 |
| C | 15 | 165 | 9184515 | 109943.15 | 298 | 295 | 83.5 |
| C | 15 | 224 | 578162 | 6917.57 | 298 | 295 | 83.5 |
| C | 4 | 5 | 285604 | 3415.4 | 298 | 295 | 83.5 |
| D | 15 | 125 | 8630981 | 69366.24 | 431 | 410 | 124.4 |
| D | 8 | 176 | 1906739 | 15321.68 | 431 | 410 | 124.4 |
| D | 10 | 172 | 800412 | 6429.83 | 431 | 410 | 124.4 |
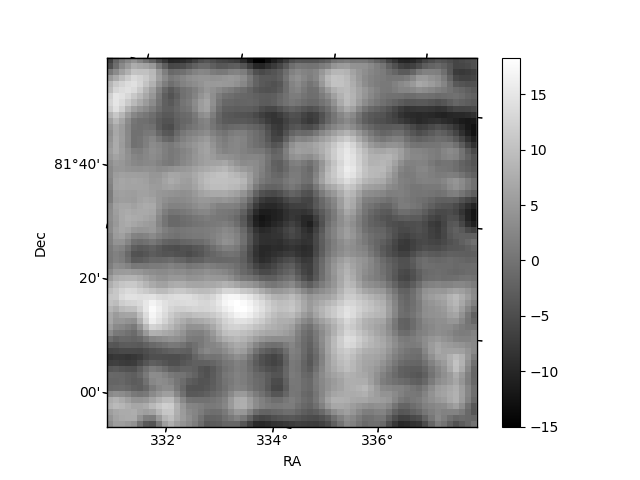
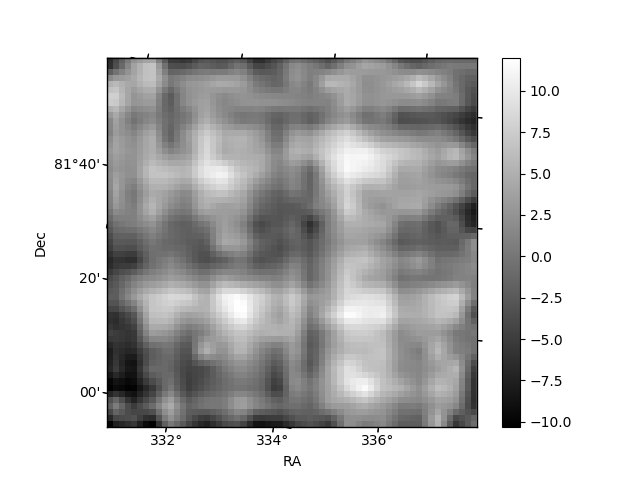
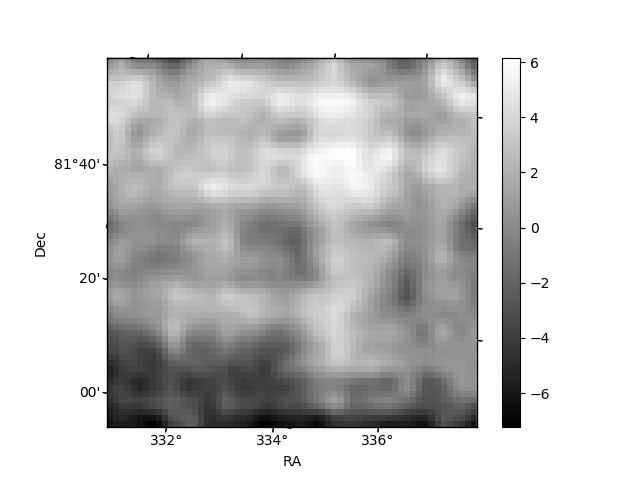
Histogram calculated using DETX and DETY for each event in the final _common_clean file
| Quadrant A | 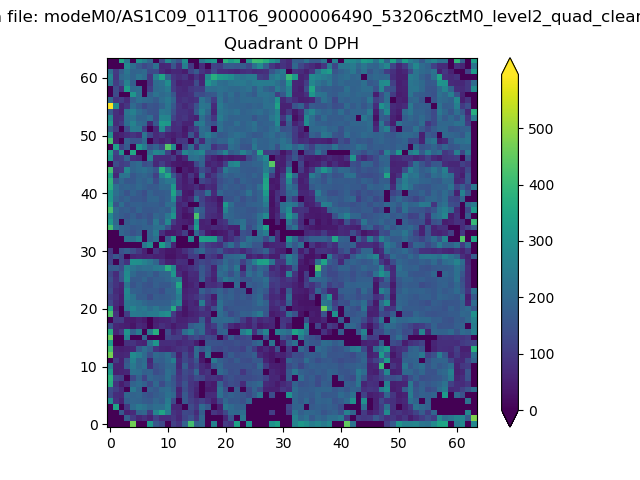 |
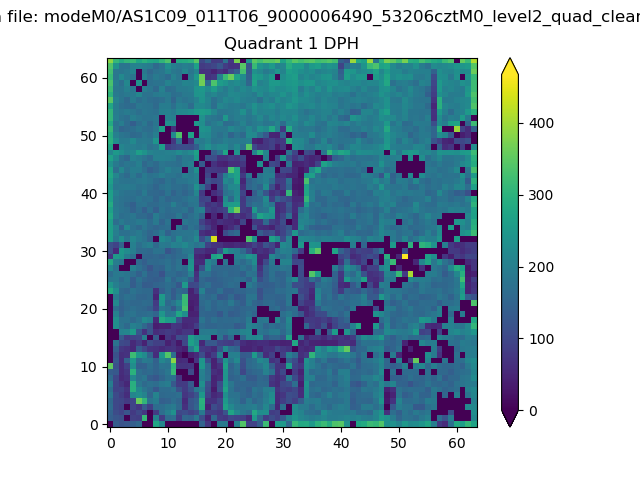 |
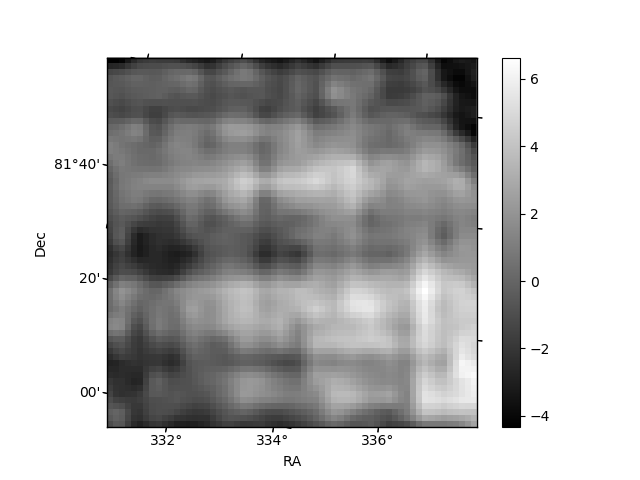
Quadrant B |
|---|---|---|---|
| Quadrant D | 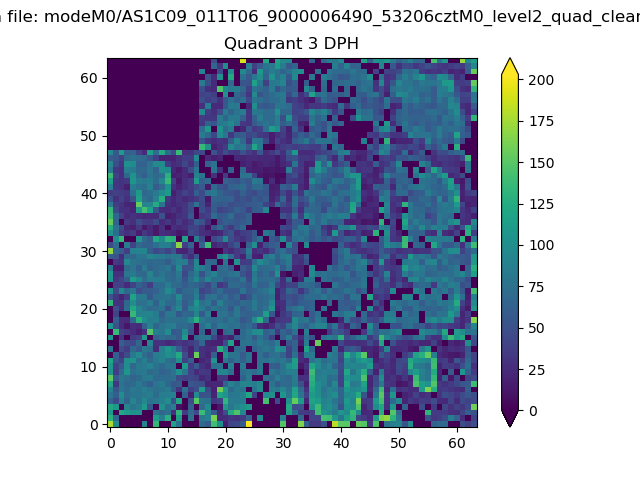 |
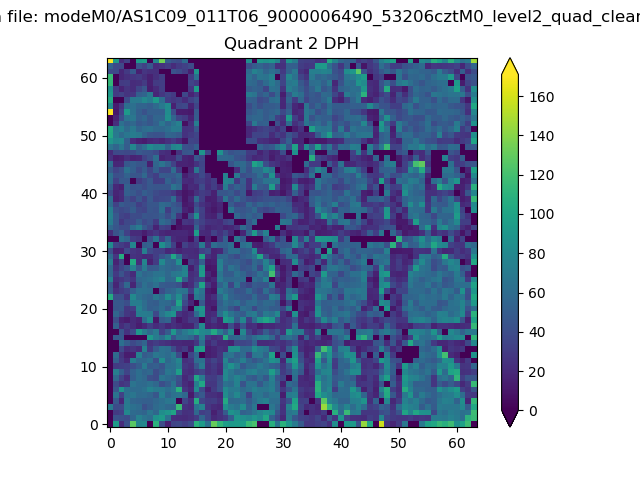 |
Quadrant C |
| Plot type | Count rate plots | Images |
|---|---|---|
| Comparison with Poisson distribution Blue bars denote a histogram of data divided into 1 sec bins. Red curve is a Poisson curve with rate = median count rate of data. |
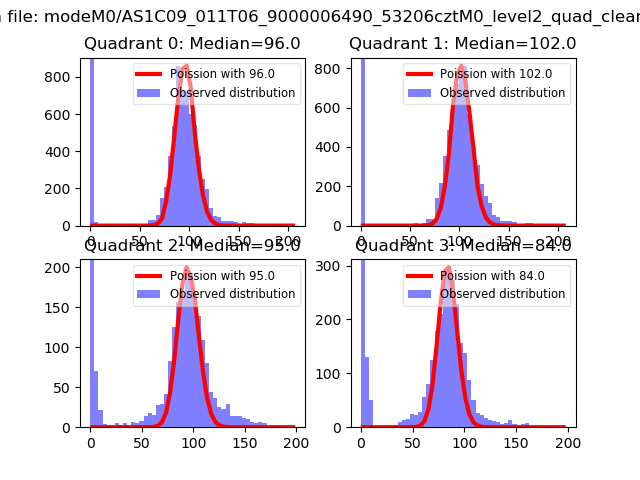 |
 |
| Quadrant-wise count rates Data is divided into 100 sec bins |
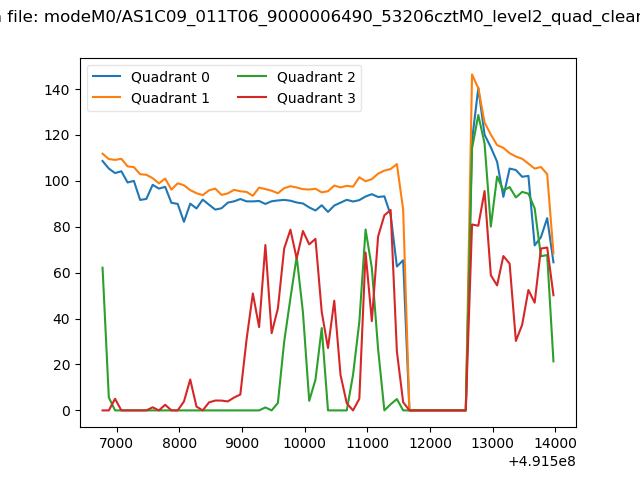 |
|
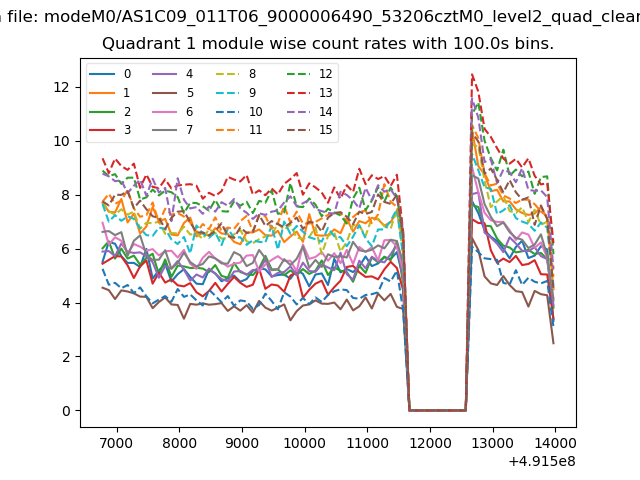
| Module-wise count rates for Quadrant A Data is divided into 100 sec bins |
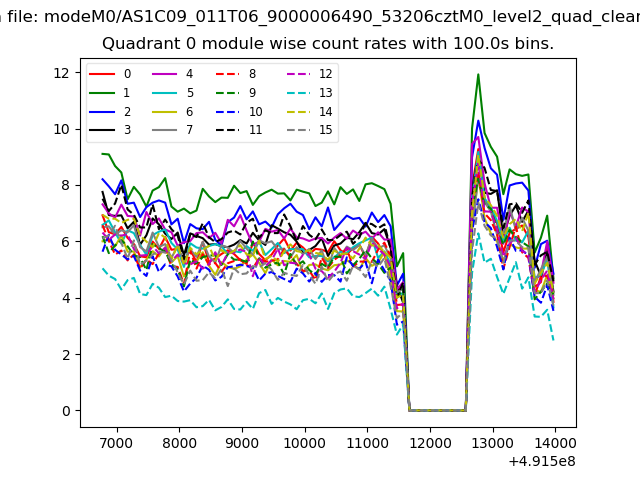 |
 |
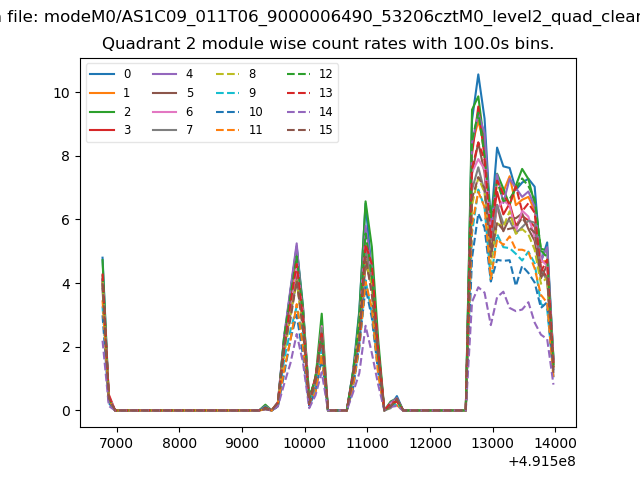
| Module-wise count rates for Quadrant B Data is divided into 100 sec bins |
 |
 |
| Module-wise count rates for Quadrant C Data is divided into 100 sec bins |
 |
 |
| Module-wise count rates for Quadrant D Data is divided into 100 sec bins |
 |
 |
| Parameter | Plot |
|---|---|
| CZT HV Monitor | 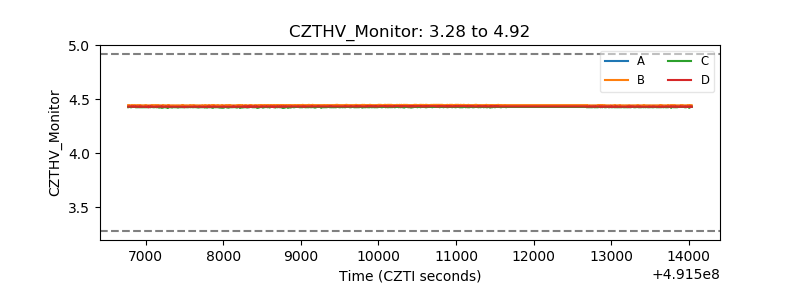 |
| D_VDD | 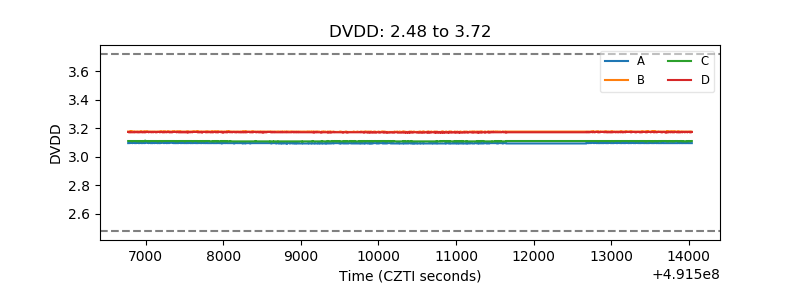 |
| Temperature 1 | 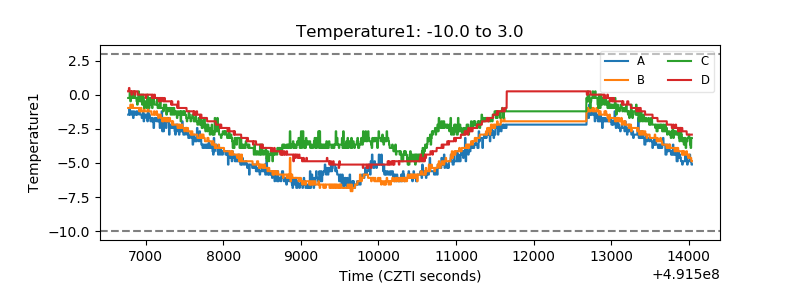 |
| Veto HV Monitor |  |
| Veto LLD | 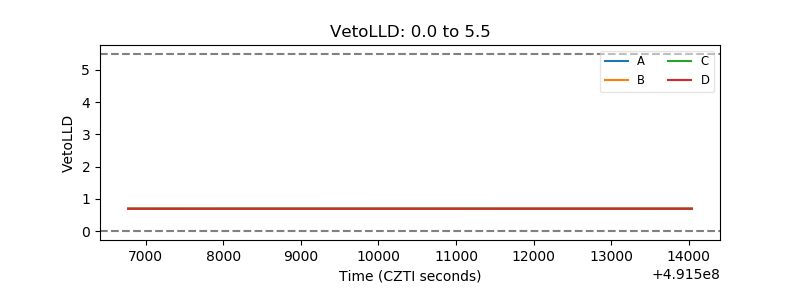 |
| Alpha Counter | 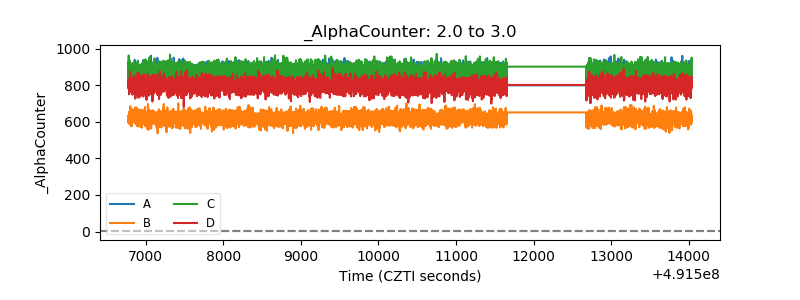 |
| _CPM_Rate | 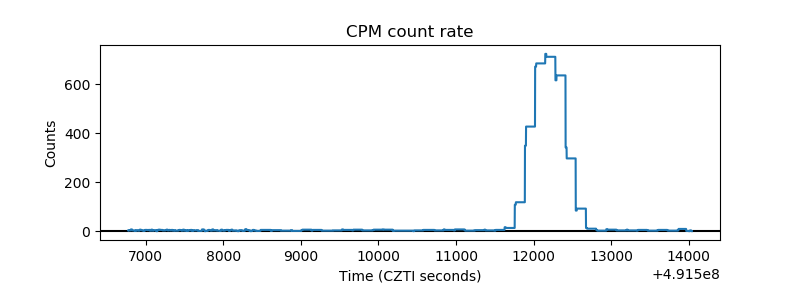 |
| CZT Counter | 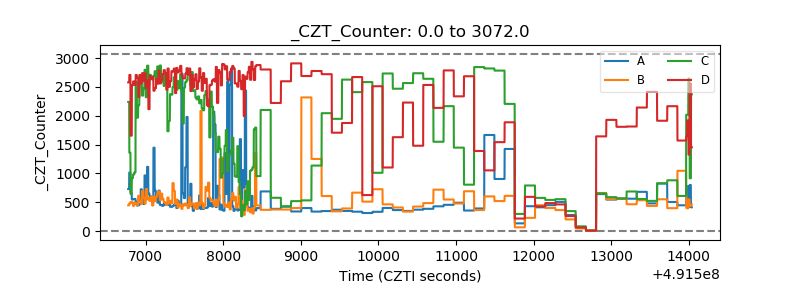 |
| +2.5 Volts monitor |  |
| +5 Volts monitor | 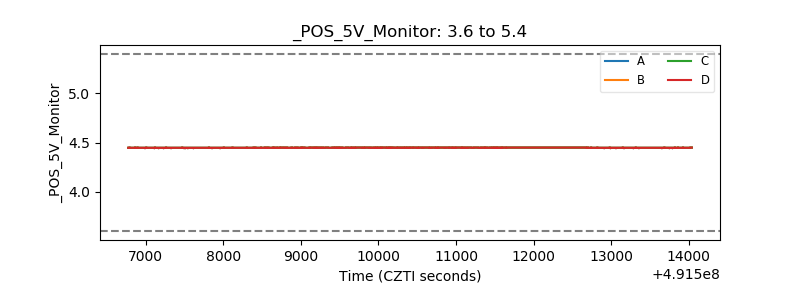 |
| _ROLL_ROT |  |
| _Roll_DEC | 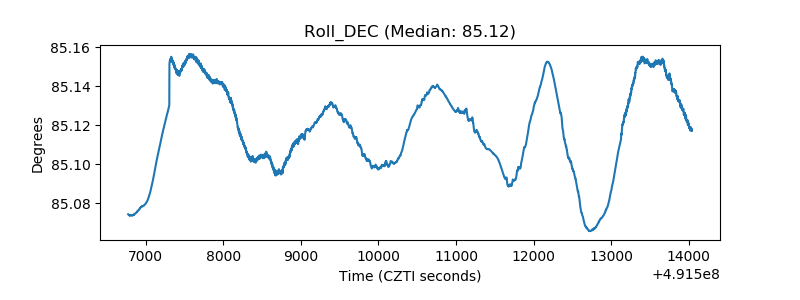 |
| _Roll_RA | 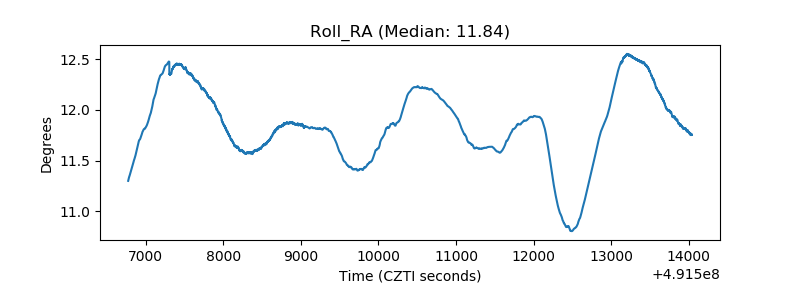 |
| Veto Counter | 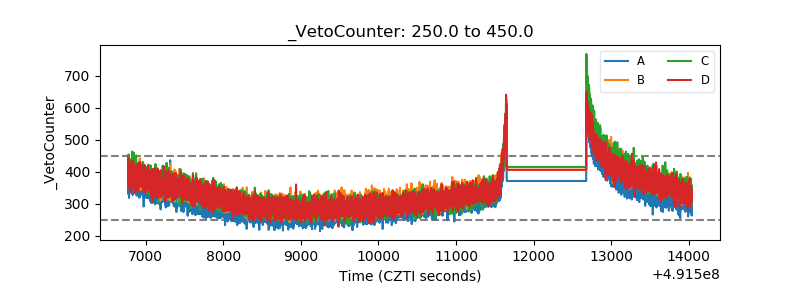 |