| Param | Original file | Final file |
|---|---|---|
| Filename | modeM0/AS1C09_011T06_9000006490_53208cztM0_level2.fits | modeM0/AS1C09_011T06_9000006490_53208cztM0_level2_quad_clean.evt |
| Size (bytes) | 759,274,560 | 80,006,400 |
| Size | 724.1 MB | 76.3 MB |
| Events in quadrant A | 2,924,046 | 626,953 |
| Events in quadrant B | 3,173,733 | 676,097 |
| Events in quadrant C | 6,258,570 | 546,688 |
| Events in quadrant D | 15,260,633 | 132,585 |
| Mode M9 | |||
|---|---|---|---|
| Quadrant | BADHDUFLAG | Total packets | Discarded packets |
| A | 0 | 12 | 0 |
| B | 0 | 12 | 0 |
| C | 0 | 12 | 0 |
| D | 0 | 12 | 0 |
| Mode SS | |||
|---|---|---|---|
| Quadrant | BADHDUFLAG | Total packets | Discarded packets |
| A | 0 | 128 | 0 |
| B | 0 | 128 | 0 |
| C | 0 | 128 | 0 |
| D | 0 | 128 | 0 |
| Mode M0 | |||
|---|---|---|---|
| Quadrant | BADHDUFLAG | Total packets | Discarded packets |
| A | 0 | 13500 | 3 |
| B | 0 | 14163 | 2 |
| C | 0 | 22962 | 2 |
| D | 0 | 49633 | 2 |
| Quadrant | Total seconds | Saturated seconds | Saturation percentage |
|---|---|---|---|
| A | 6303 | 63 | 0.999524% |
| B | 6303 | 109 | 1.729335% |
| C | 6303 | 829 | 13.152467% |
| D | 6304 | 5021 | 79.647843% |
Noise dominated data is calculated using 1-second bins in cleaned event files. If a bin has >2000 counts, and if more than 50% of those come from <1% of pixels, then it is considered to be noise-dominated and hence unusable.
| Quadrant | # 1 sec bins | Bins with >0 counts | Bins with >2000 counts | High rate bins dominated by noise | Noise dominated (total time) | Noise dominated (detector-on time) | Marked lightcurve |
|---|---|---|---|---|---|---|---|
| A | 7508 | 6304 | 21 | 21 | 0.28% | 0.33% | 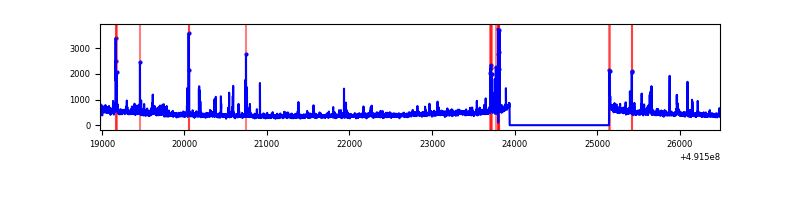 |
| B | 7508 | 6304 | 35 | 35 | 0.47% | 0.56% | 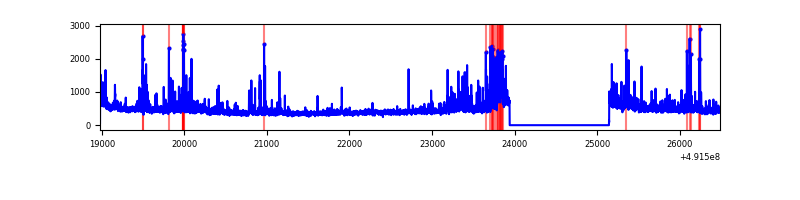 |
| C | 7508 | 6304 | 691 | 691 | 9.20% | 10.96% | 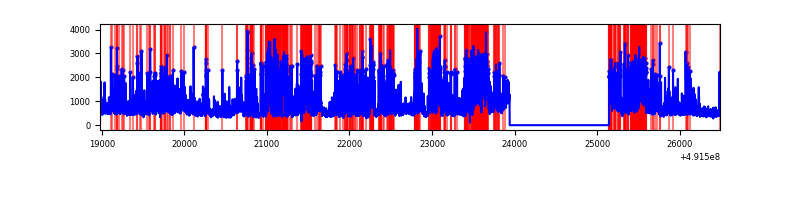 |
| D | 7509 | 6305 | 5235 | 5235 | 69.72% | 83.03% | 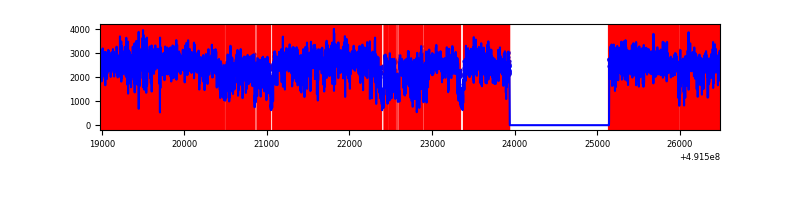 |
Top three noisy pixels from each quadrant. If the there are fewer than three noisy pixels in the level2.evt file, extra rows are filled as -1
| Pixel properties | Quadrant properties | ||||||
|---|---|---|---|---|---|---|---|
| Quadrant | DetID | PixID | Counts | Sigma | Mean | Median | Sigma |
| A | 7 | 112 | 60055 | 356.09 | 662 | 646 | 166.8 |
| A | 5 | 240 | 41681 | 245.96 | 662 | 646 | 166.8 |
| A | 0 | 8 | 40039 | 236.11 | 662 | 646 | 166.8 |
| B | 2 | 249 | 129091 | 923.32 | 661 | 638 | 139.1 |
| B | 10 | 247 | 122835 | 878.35 | 661 | 638 | 139.1 |
| B | 4 | 81 | 92669 | 661.52 | 661 | 638 | 139.1 |
| C | 15 | 224 | 1539712 | 8972.11 | 618 | 615 | 171.5 |
| C | 15 | 198 | 1178793 | 6868.14 | 618 | 615 | 171.5 |
| C | 15 | 165 | 387710 | 2256.56 | 618 | 615 | 171.5 |
| D | 15 | 125 | 12260329 | 111508.16 | 374 | 356 | 109.9 |
| D | 12 | 3 | 310443 | 2820.33 | 374 | 356 | 109.9 |
| D | 11 | 176 | 303176 | 2754.24 | 374 | 356 | 109.9 |
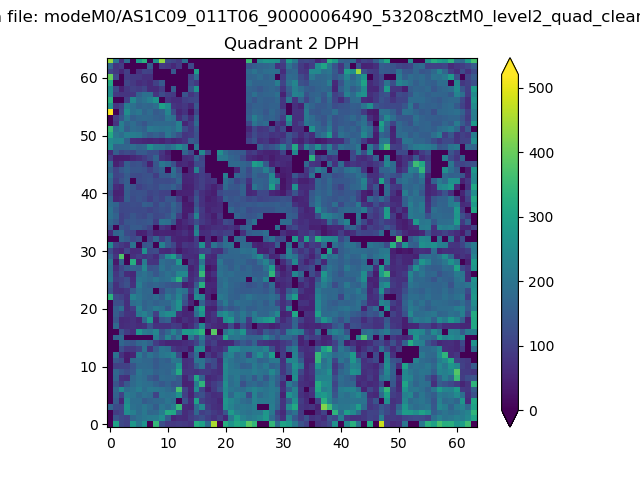
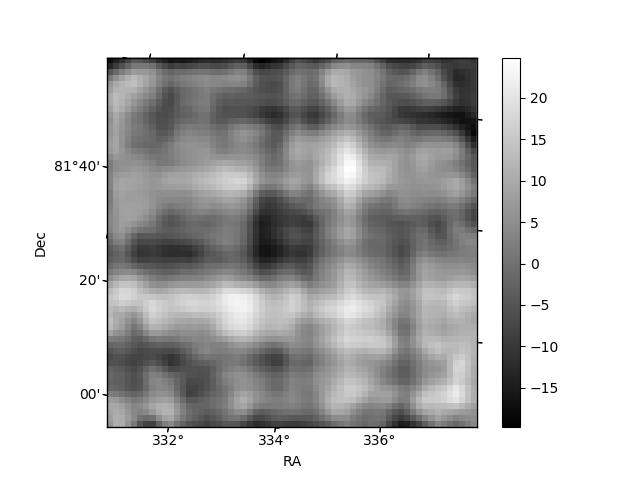
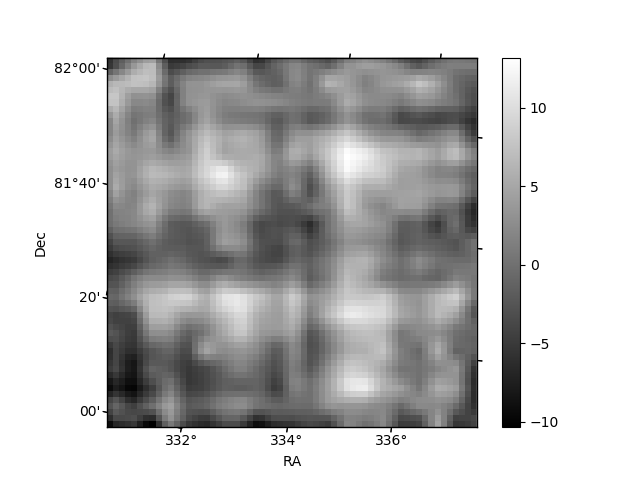
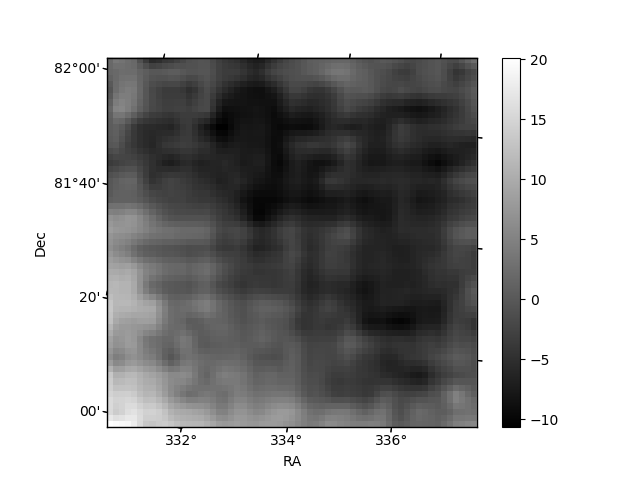
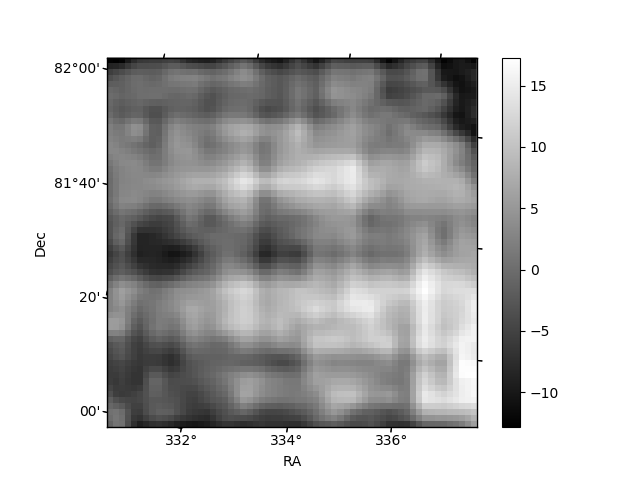
Histogram calculated using DETX and DETY for each event in the final _common_clean file
| Quadrant A | 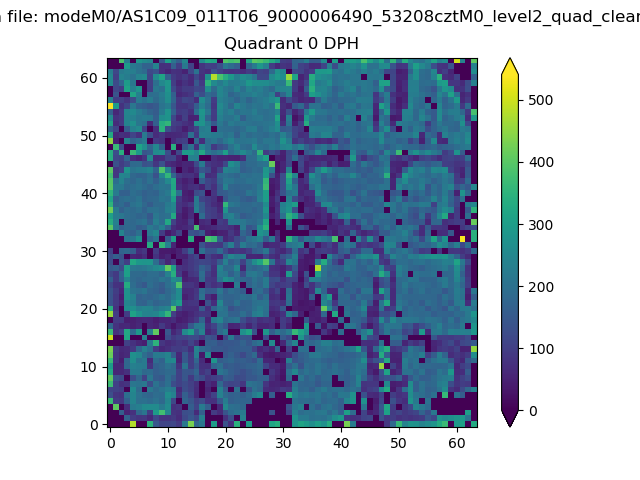 |
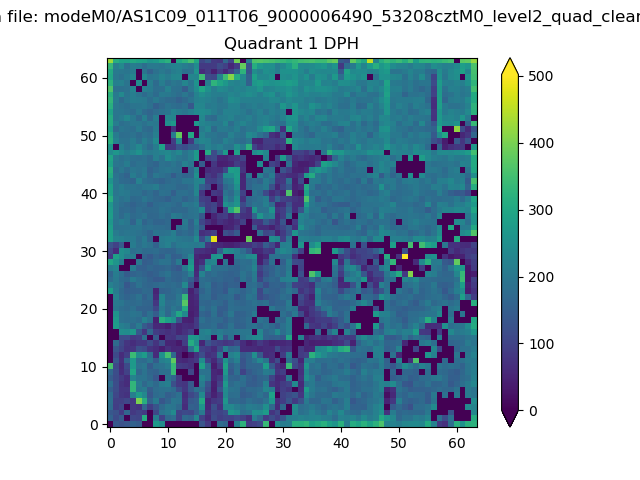 |
Quadrant B |
|---|---|---|---|
| Quadrant D | 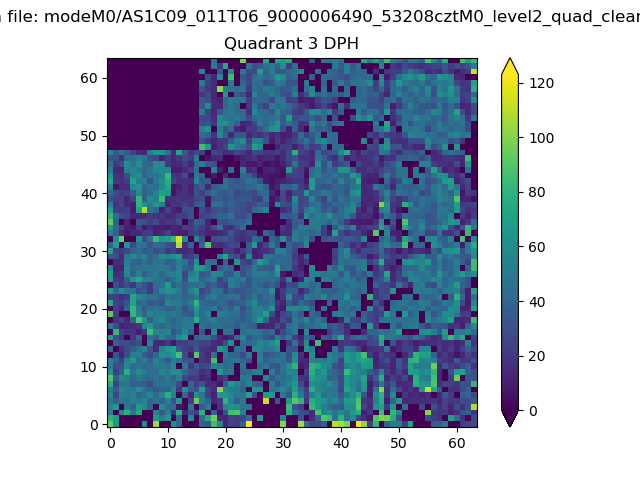 |
 |
Quadrant C |
| Plot type | Count rate plots | Images |
|---|---|---|
| Comparison with Poisson distribution Blue bars denote a histogram of data divided into 1 sec bins. Red curve is a Poisson curve with rate = median count rate of data. |
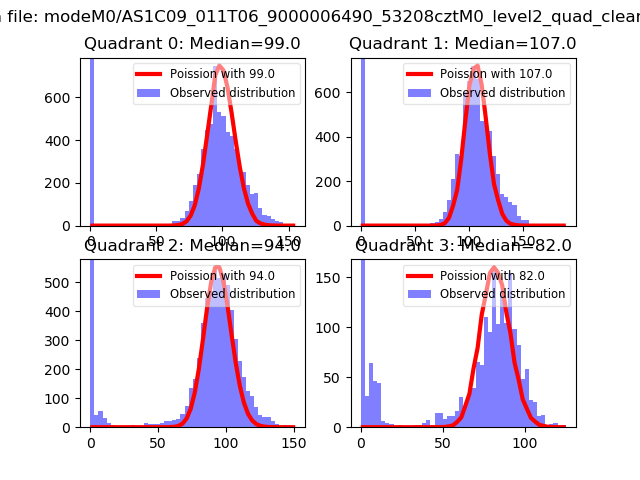 |
 |
| Quadrant-wise count rates Data is divided into 100 sec bins |
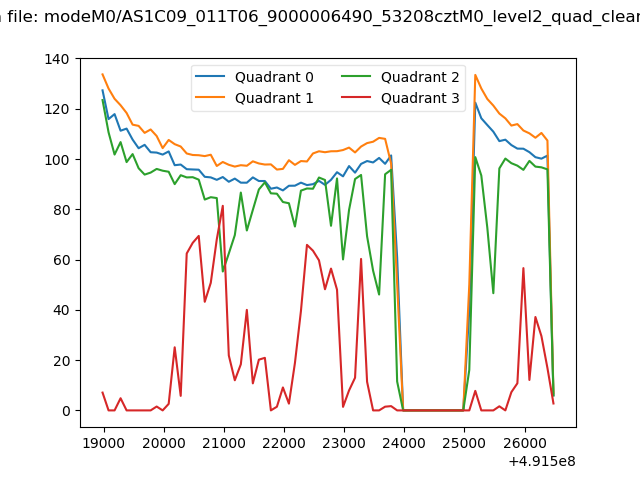 |
|
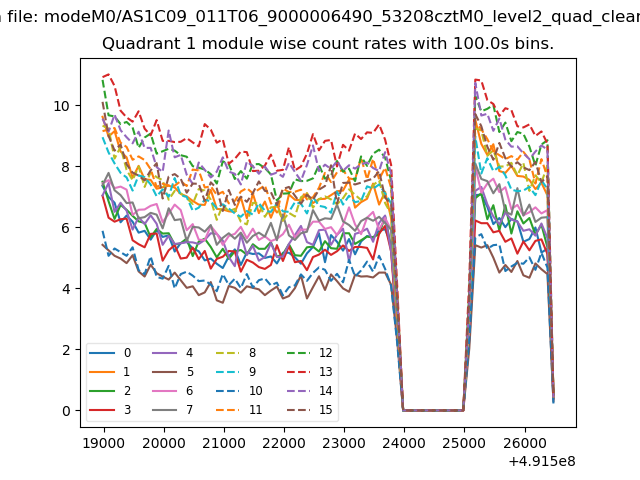
| Module-wise count rates for Quadrant A Data is divided into 100 sec bins |
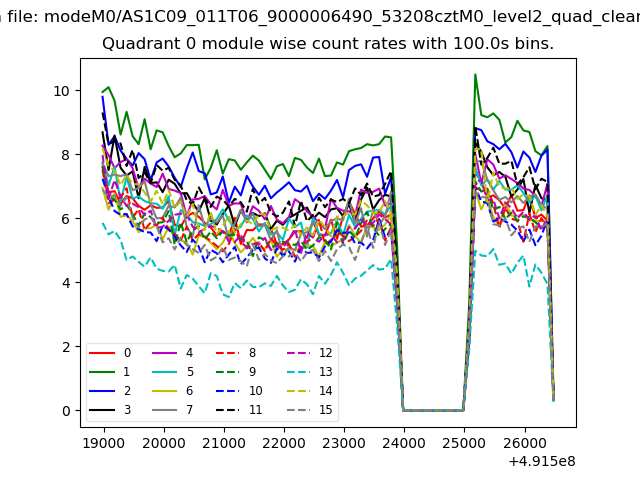 |
 |
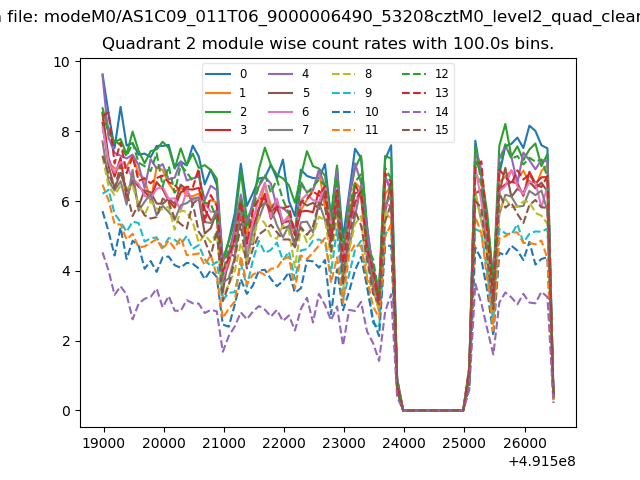
| Module-wise count rates for Quadrant B Data is divided into 100 sec bins |
 |
 |
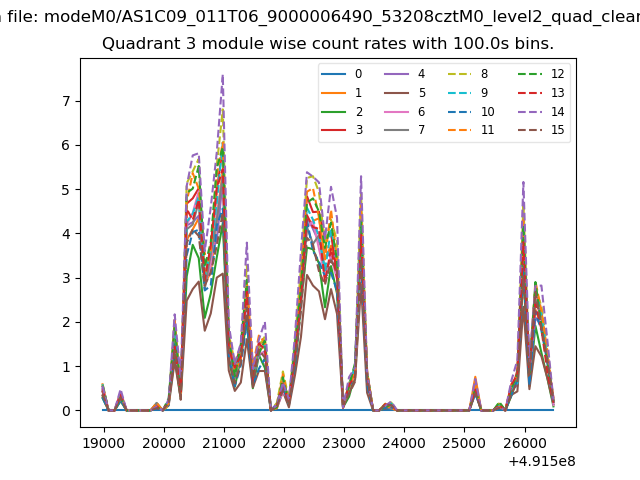
| Module-wise count rates for Quadrant C Data is divided into 100 sec bins |
 |
 |
| Module-wise count rates for Quadrant D Data is divided into 100 sec bins |
 |
 |
| Parameter | Plot |
|---|---|
| CZT HV Monitor | 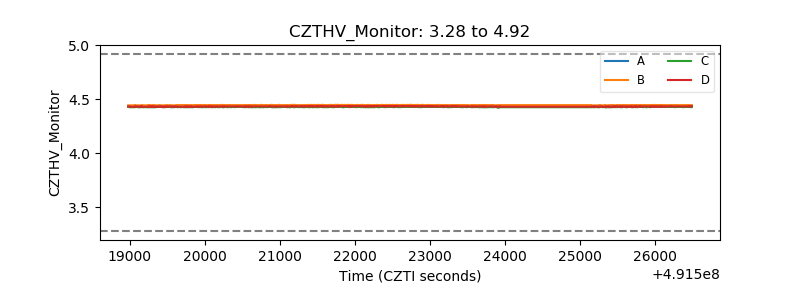 |
| D_VDD | 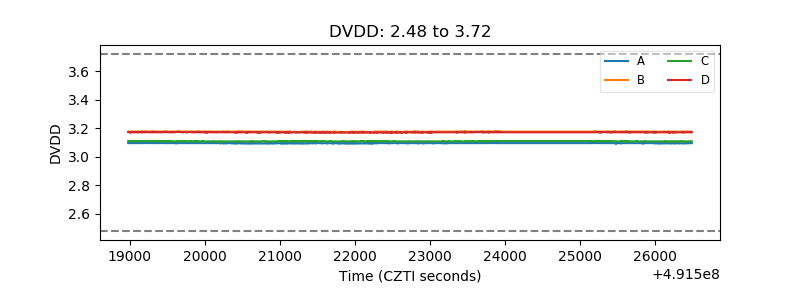 |
| Temperature 1 | 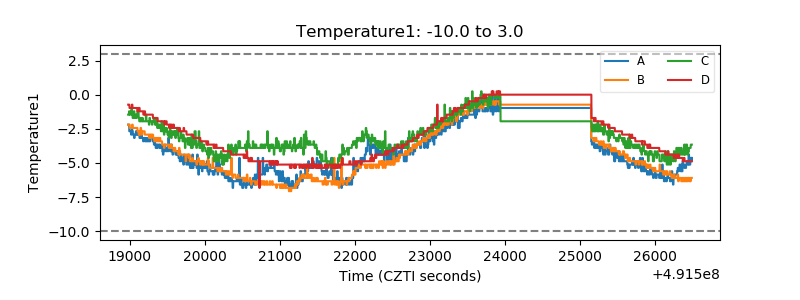 |
| Veto HV Monitor | 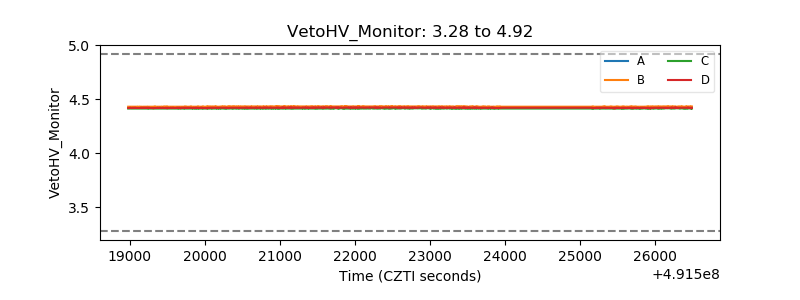 |
| Veto LLD | 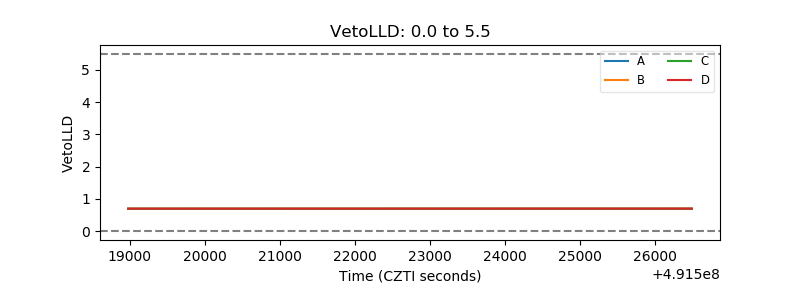 |
| Alpha Counter | 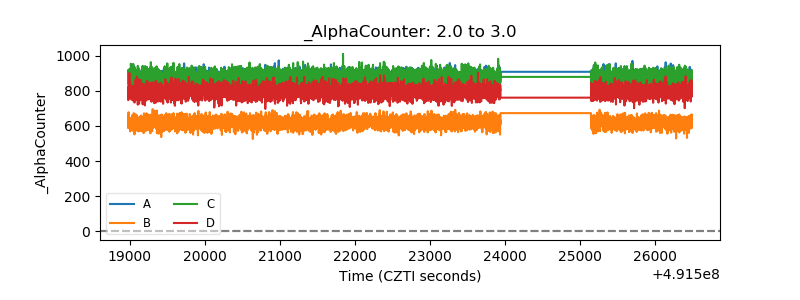 |
| _CPM_Rate | 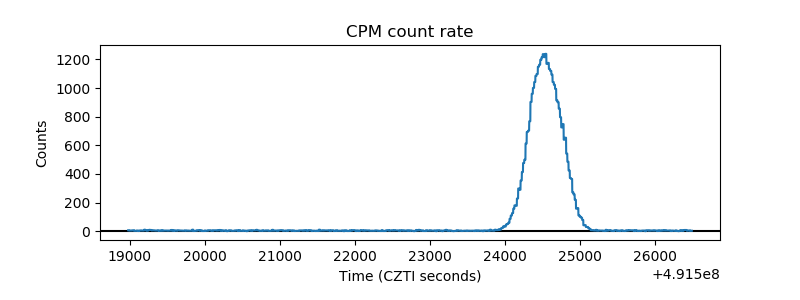 |
| CZT Counter | 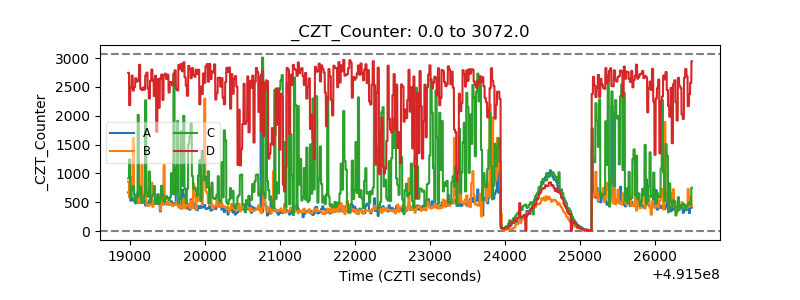 |
| +2.5 Volts monitor | 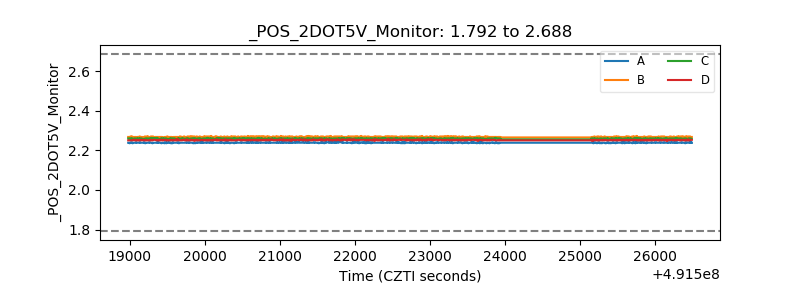 |
| +5 Volts monitor |  |
| _ROLL_ROT | 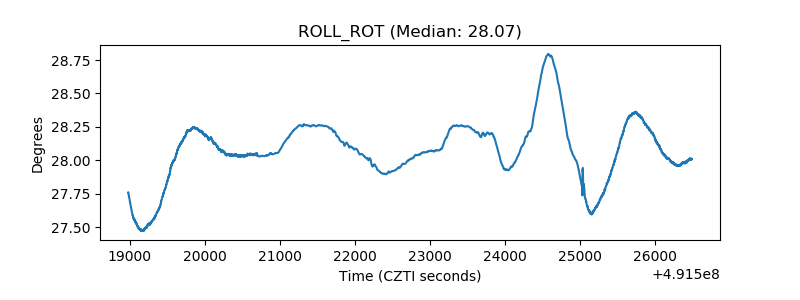 |
| _Roll_DEC | 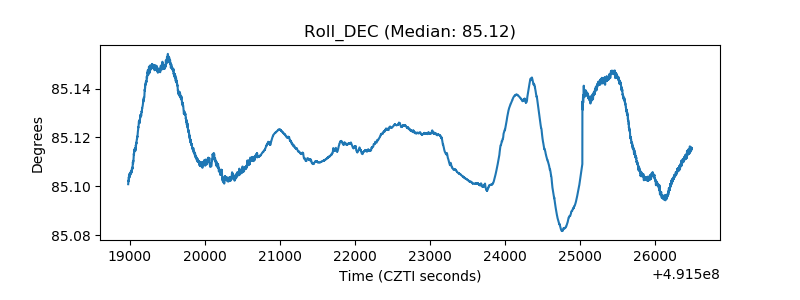 |
| _Roll_RA | 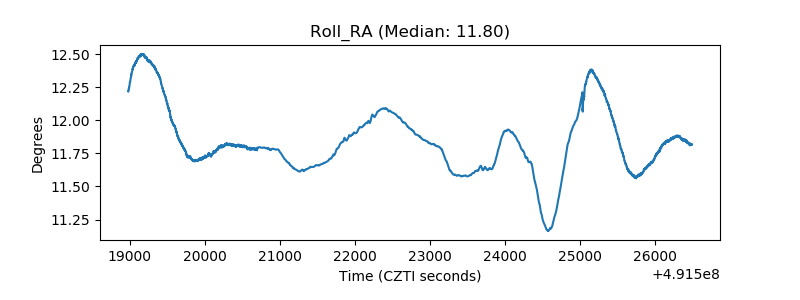 |
| Veto Counter | 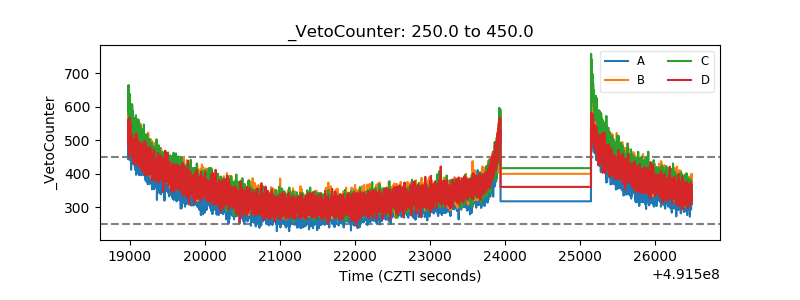 |