| Param | Original file | Final file |
|---|---|---|
| Filename | modeM0/AS1C09_011T06_9000006490_53209cztM0_level2.fits | modeM0/AS1C09_011T06_9000006490_53209cztM0_level2_quad_clean.evt |
| Size (bytes) | 803,946,240 | 80,334,720 |
| Size | 766.7 MB | 76.6 MB |
| Events in quadrant A | 3,303,318 | 628,572 |
| Events in quadrant B | 4,452,466 | 663,211 |
| Events in quadrant C | 6,718,455 | 527,367 |
| Events in quadrant D | 14,794,295 | 170,994 |
| Mode M9 | |||
|---|---|---|---|
| Quadrant | BADHDUFLAG | Total packets | Discarded packets |
| A | 0 | 21 | 0 |
| B | 0 | 21 | 0 |
| C | 0 | 22 | 0 |
| D | 0 | 22 | 0 |
| Mode SS | |||
|---|---|---|---|
| Quadrant | BADHDUFLAG | Total packets | Discarded packets |
| A | 0 | 128 | 0 |
| B | 0 | 128 | 0 |
| C | 0 | 128 | 0 |
| D | 0 | 128 | 0 |
| Mode M0 | |||
|---|---|---|---|
| Quadrant | BADHDUFLAG | Total packets | Discarded packets |
| A | 0 | 14681 | 2 |
| B | 0 | 17580 | 2 |
| C | 0 | 24382 | 2 |
| D | 0 | 48281 | 5 |
| Quadrant | Total seconds | Saturated seconds | Saturation percentage |
|---|---|---|---|
| A | 6336 | 123 | 1.941288% |
| B | 6336 | 388 | 6.123737% |
| C | 6336 | 1046 | 16.508838% |
| D | 6335 | 4724 | 74.569850% |
Noise dominated data is calculated using 1-second bins in cleaned event files. If a bin has >2000 counts, and if more than 50% of those come from <1% of pixels, then it is considered to be noise-dominated and hence unusable.
| Quadrant | # 1 sec bins | Bins with >0 counts | Bins with >2000 counts | High rate bins dominated by noise | Noise dominated (total time) | Noise dominated (detector-on time) | Marked lightcurve |
|---|---|---|---|---|---|---|---|
| A | 7541 | 6337 | 85 | 85 | 1.13% | 1.34% | 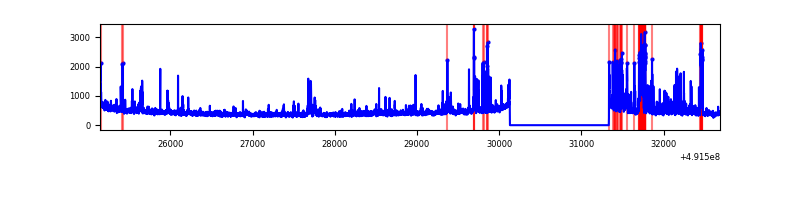 |
| B | 7541 | 6337 | 292 | 292 | 3.87% | 4.61% | 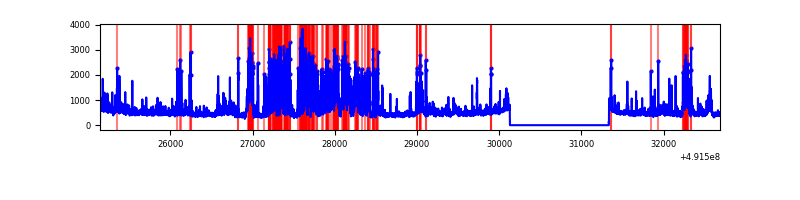 |
| C | 7541 | 6336 | 922 | 922 | 12.23% | 14.55% | 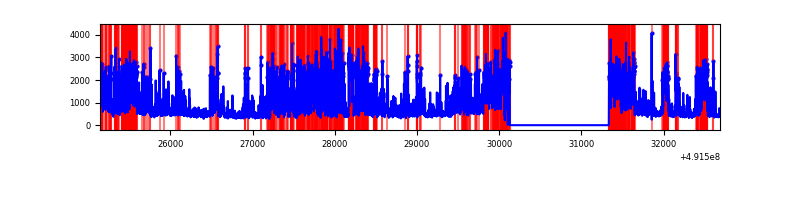 |
| D | 7540 | 6336 | 4950 | 4950 | 65.65% | 78.12% | 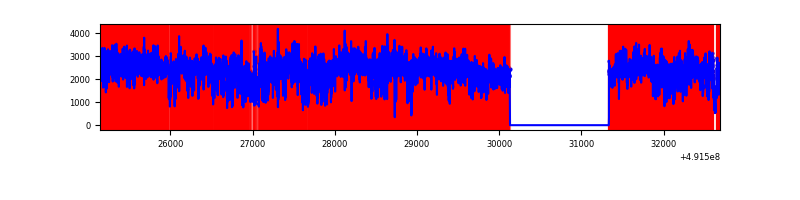 |
Top three noisy pixels from each quadrant. If the there are fewer than three noisy pixels in the level2.evt file, extra rows are filled as -1
| Pixel properties | Quadrant properties | ||||||
|---|---|---|---|---|---|---|---|
| Quadrant | DetID | PixID | Counts | Sigma | Mean | Median | Sigma |
| A | 4 | 249 | 295937 | 1792.55 | 661 | 644 | 164.7 |
| A | 0 | 8 | 160696 | 971.58 | 661 | 644 | 164.7 |
| A | 15 | 174 | 54740 | 328.38 | 661 | 644 | 164.7 |
| B | 2 | 249 | 1271391 | 9304.2 | 656 | 635 | 136.6 |
| B | 4 | 81 | 240503 | 1756.26 | 656 | 635 | 136.6 |
| B | 10 | 247 | 102571 | 746.35 | 656 | 635 | 136.6 |
| C | 15 | 224 | 2212528 | 13126.53 | 604 | 600 | 168.5 |
| C | 4 | 5 | 934277 | 5540.84 | 604 | 600 | 168.5 |
| C | 15 | 165 | 331196 | 1961.9 | 604 | 600 | 168.5 |
| D | 15 | 125 | 10826637 | 86003.24 | 421 | 400 | 125.9 |
| D | 2 | 62 | 830927 | 6597.68 | 421 | 400 | 125.9 |
| D | 2 | 153 | 287563 | 2281.21 | 421 | 400 | 125.9 |
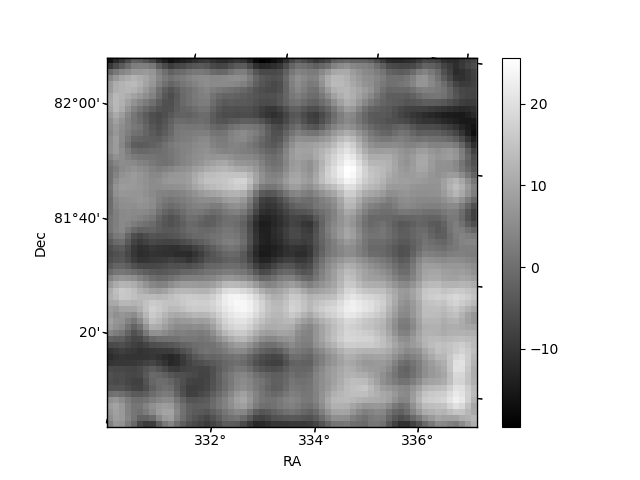
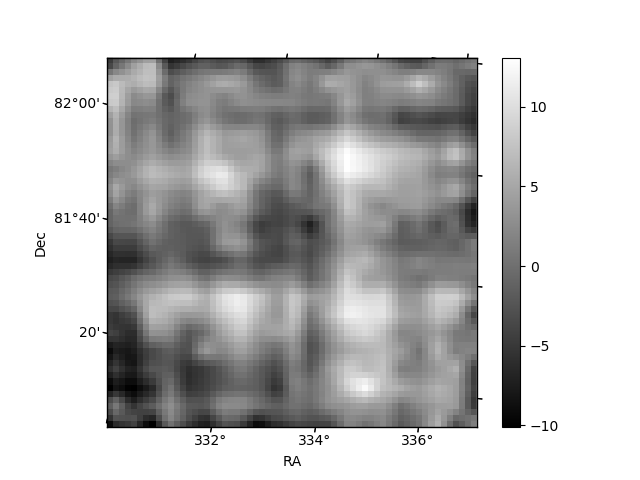
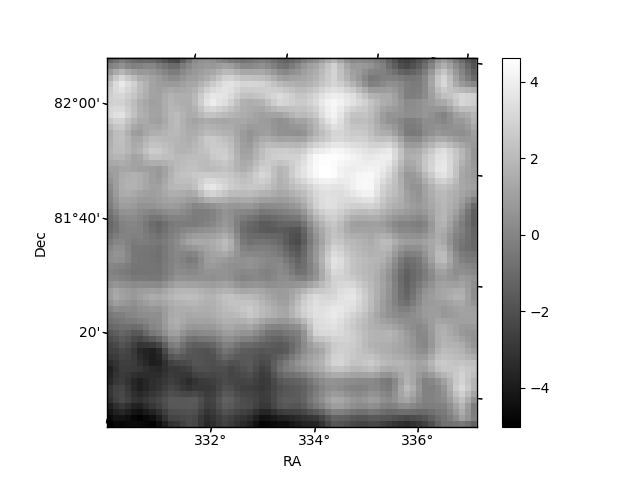
Histogram calculated using DETX and DETY for each event in the final _common_clean file
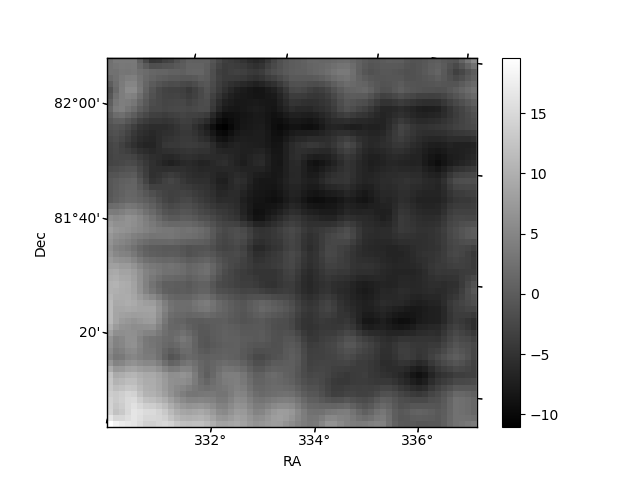
| Quadrant A | 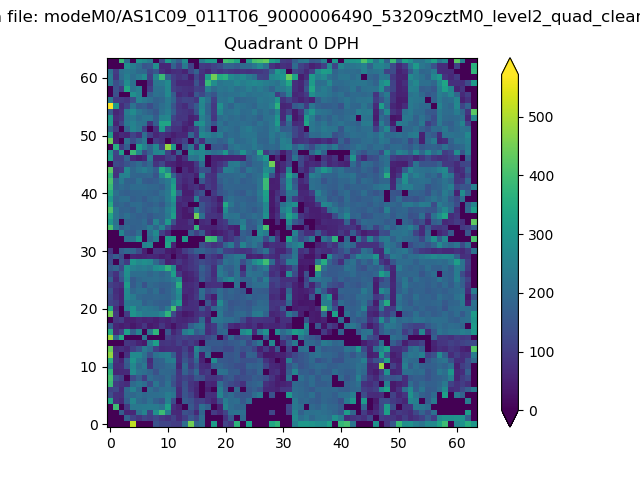 |
 |
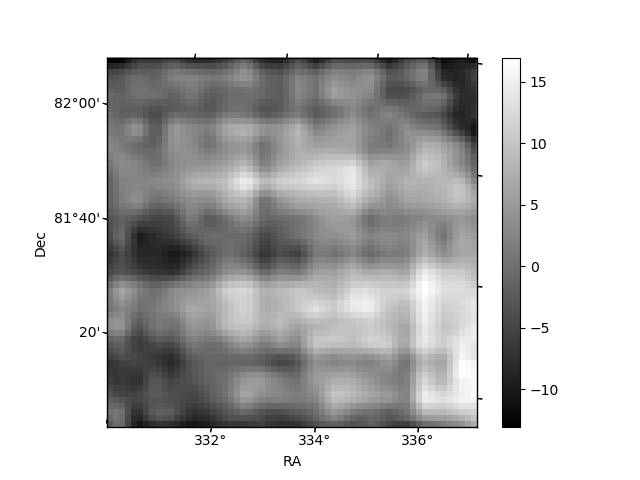
Quadrant B |
|---|---|---|---|
| Quadrant D | 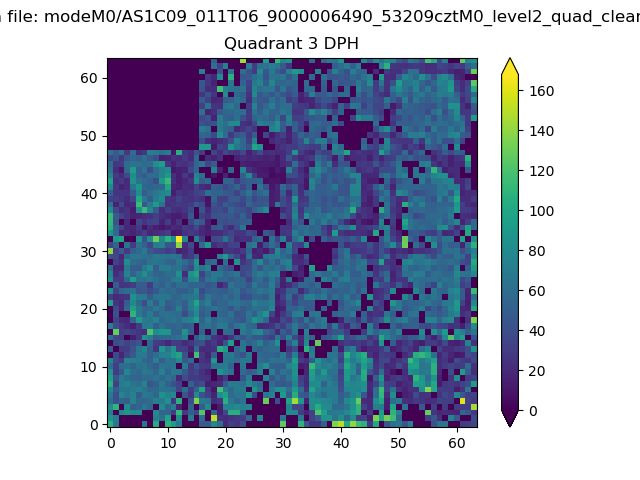 |
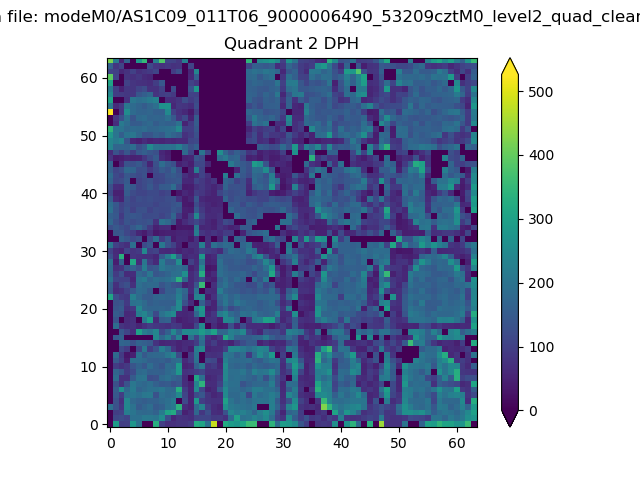 |
Quadrant C |
| Plot type | Count rate plots | Images |
|---|---|---|
| Comparison with Poisson distribution Blue bars denote a histogram of data divided into 1 sec bins. Red curve is a Poisson curve with rate = median count rate of data. |
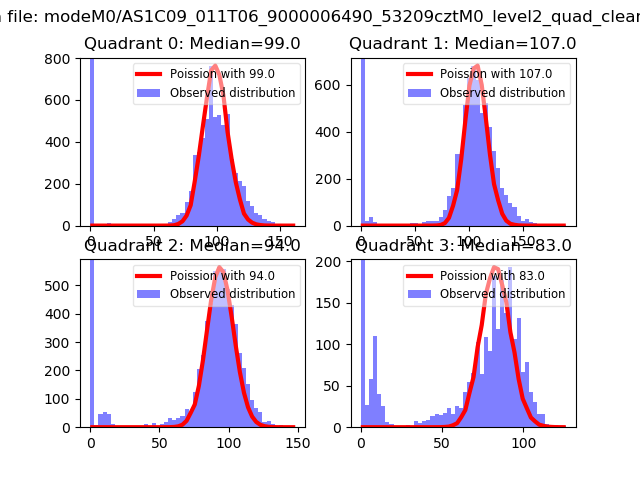 |
 |
| Quadrant-wise count rates Data is divided into 100 sec bins |
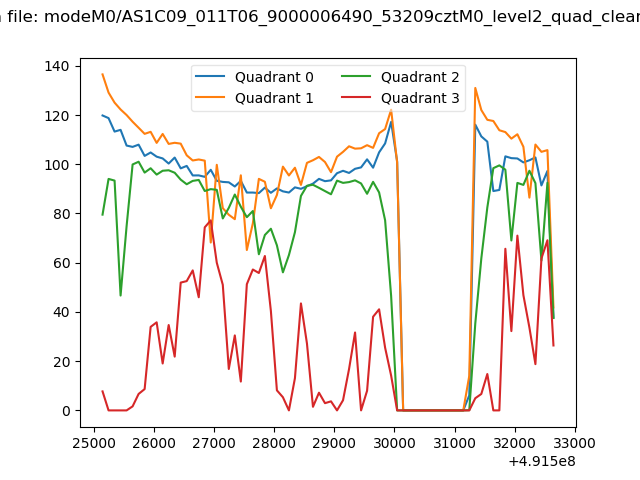 |
|
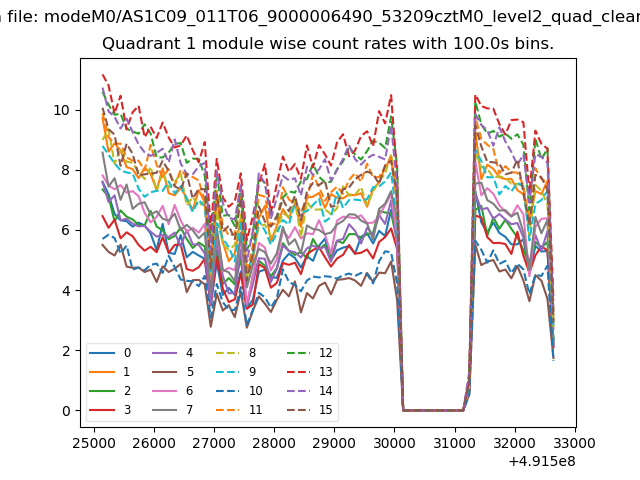
| Module-wise count rates for Quadrant A Data is divided into 100 sec bins |
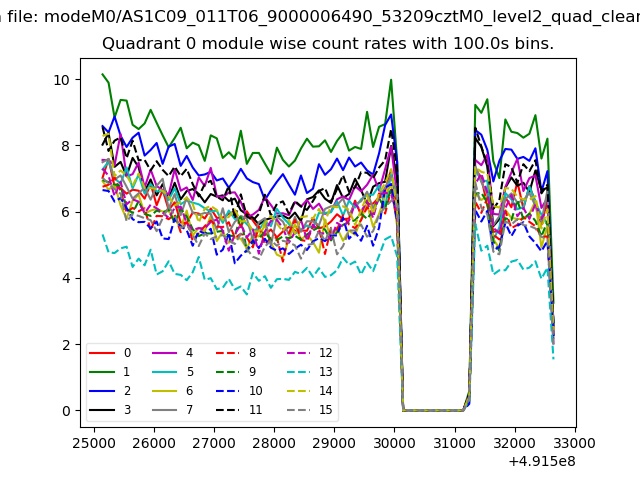 |
 |
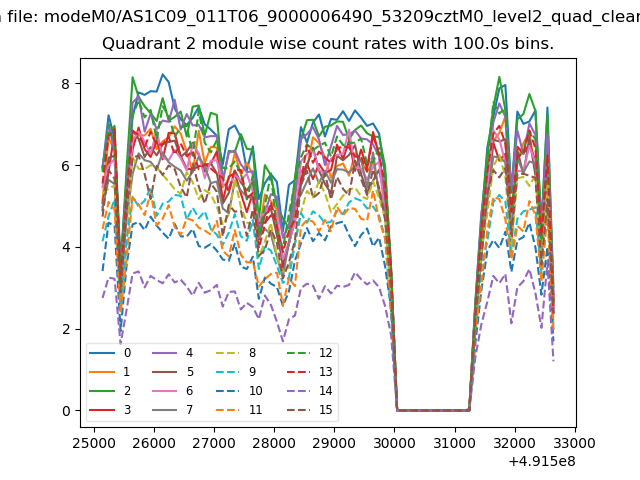
| Module-wise count rates for Quadrant B Data is divided into 100 sec bins |
 |
 |
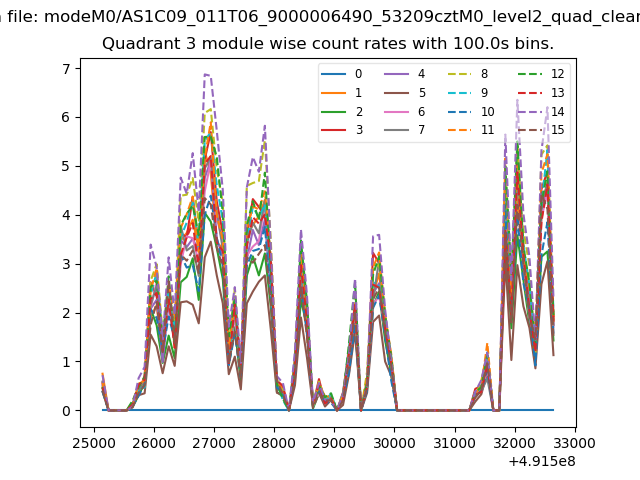
| Module-wise count rates for Quadrant C Data is divided into 100 sec bins |
 |
 |
| Module-wise count rates for Quadrant D Data is divided into 100 sec bins |
 |
 |
| Parameter | Plot |
|---|---|
| CZT HV Monitor | 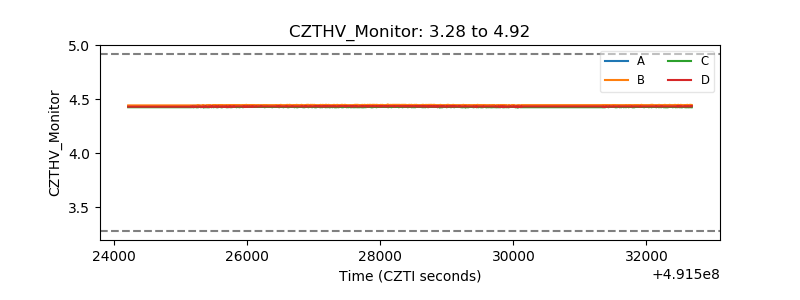 |
| D_VDD | 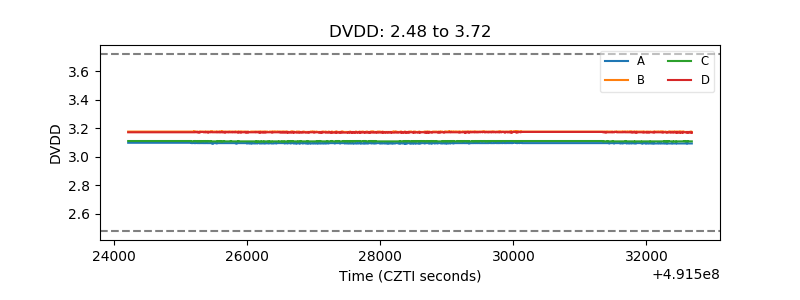 |
| Temperature 1 | 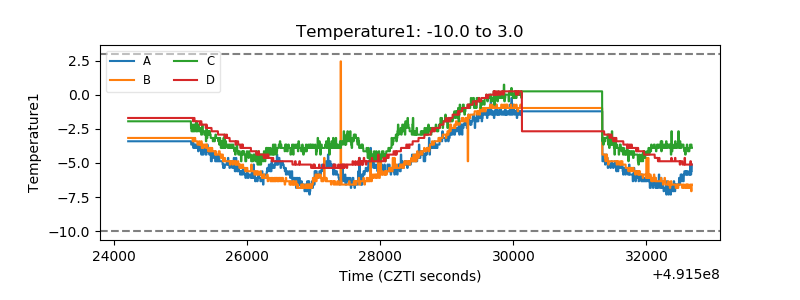 |
| Veto HV Monitor | 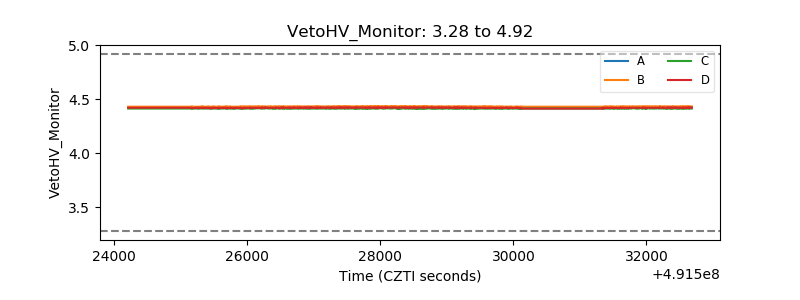 |
| Veto LLD | 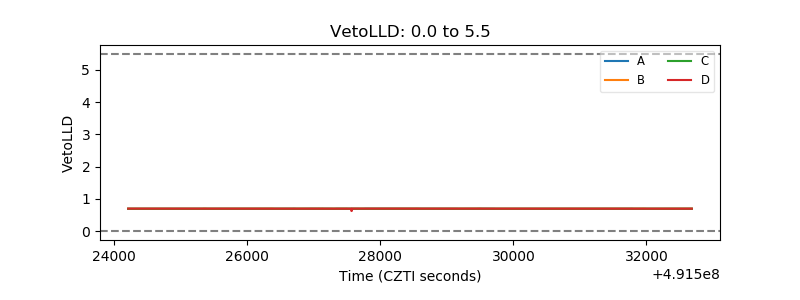 |
| Alpha Counter | 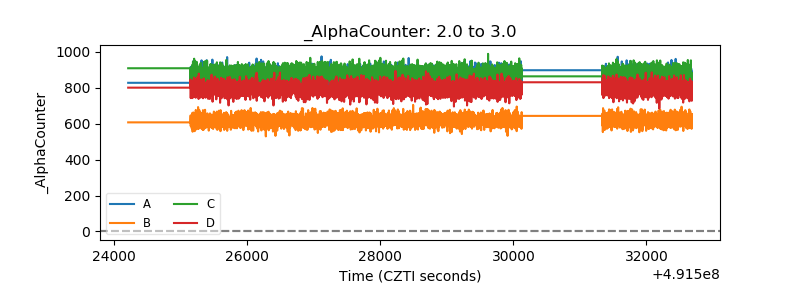 |
| _CPM_Rate | 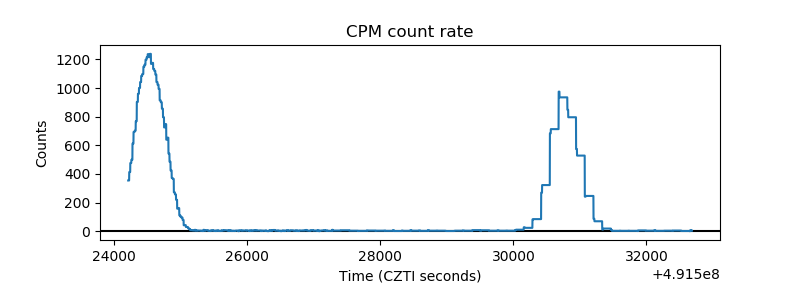 |
| CZT Counter | 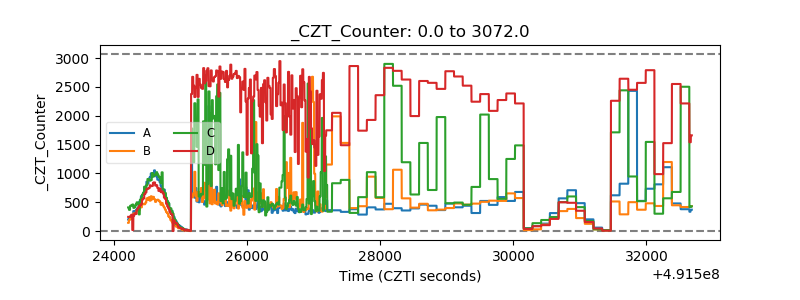 |
| +2.5 Volts monitor |  |
| +5 Volts monitor |  |
| _ROLL_ROT | 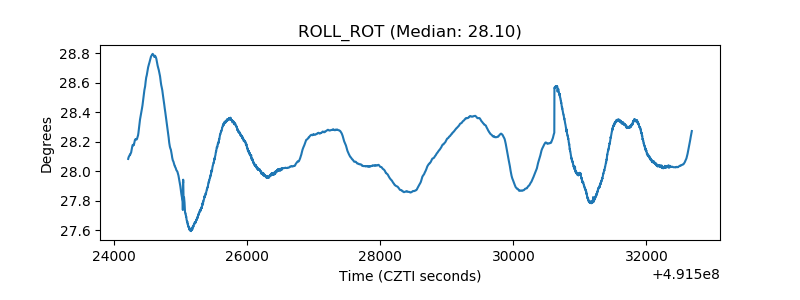 |
| _Roll_DEC | 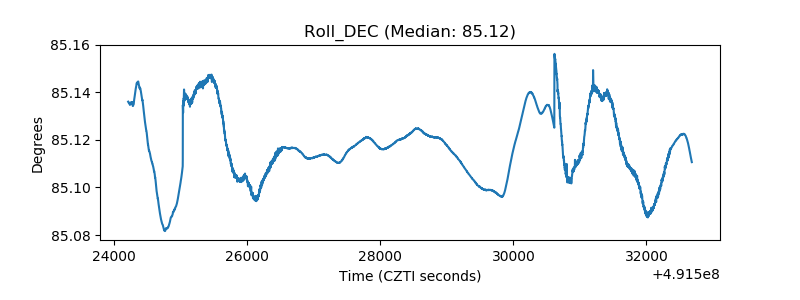 |
| _Roll_RA | 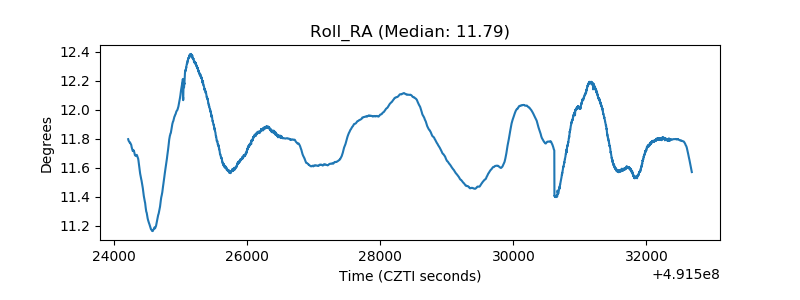 |
| Veto Counter | 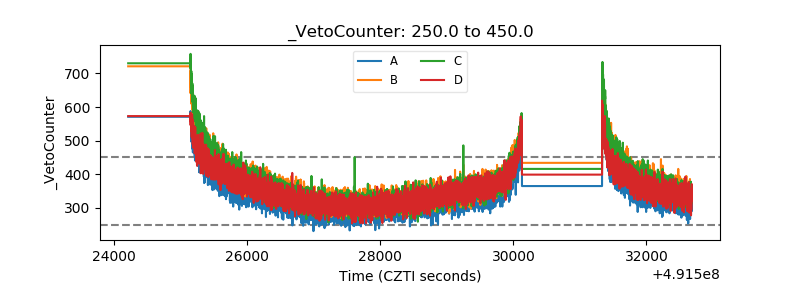 |