| Param | Original file | Final file |
|---|---|---|
| Filename | modeM0/AS1C09_011T06_9000006490_53211cztM0_level2.fits | modeM0/AS1C09_011T06_9000006490_53211cztM0_level2_quad_clean.evt |
| Size (bytes) | 791,542,080 | 73,992,960 |
| Size | 754.9 MB | 70.6 MB |
| Events in quadrant A | 3,321,600 | 576,890 |
| Events in quadrant B | 4,799,969 | 591,086 |
| Events in quadrant C | 9,594,738 | 288,319 |
| Events in quadrant D | 11,100,270 | 348,558 |
| Mode M9 | |||
|---|---|---|---|
| Quadrant | BADHDUFLAG | Total packets | Discarded packets |
| A | 0 | 10 | 0 |
| B | 0 | 10 | 0 |
| C | 0 | 10 | 0 |
| D | 0 | 10 | 0 |
| Mode SS | |||
|---|---|---|---|
| Quadrant | BADHDUFLAG | Total packets | Discarded packets |
| A | 0 | 124 | 0 |
| B | 0 | 124 | 0 |
| C | 0 | 124 | 0 |
| D | 0 | 124 | 0 |
| Mode M0 | |||
|---|---|---|---|
| Quadrant | BADHDUFLAG | Total packets | Discarded packets |
| A | 0 | 14697 | 1 |
| B | 0 | 18784 | 1 |
| C | 0 | 32860 | 1 |
| D | 0 | 37335 | 1 |
| Quadrant | Total seconds | Saturated seconds | Saturation percentage |
|---|---|---|---|
| A | 6246 | 164 | 2.625680% |
| B | 6246 | 569 | 9.109830% |
| C | 6247 | 3151 | 50.440211% |
| D | 6247 | 2467 | 39.490956% |
Noise dominated data is calculated using 1-second bins in cleaned event files. If a bin has >2000 counts, and if more than 50% of those come from <1% of pixels, then it is considered to be noise-dominated and hence unusable.
| Quadrant | # 1 sec bins | Bins with >0 counts | Bins with >2000 counts | High rate bins dominated by noise | Noise dominated (total time) | Noise dominated (detector-on time) | Marked lightcurve |
|---|---|---|---|---|---|---|---|
| A | 7171 | 6247 | 131 | 131 | 1.83% | 2.10% | 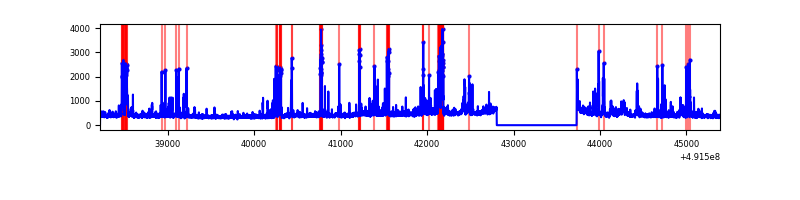 |
| B | 7171 | 6247 | 447 | 447 | 6.23% | 7.16% | 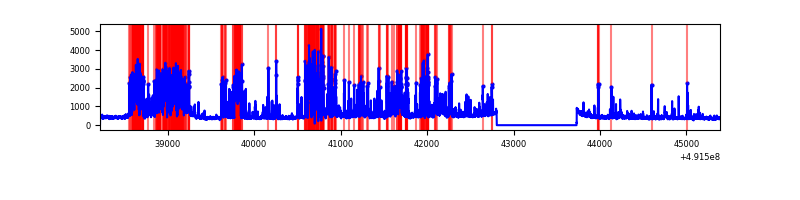 |
| C | 7172 | 6246 | 2240 | 2240 | 31.23% | 35.86% | 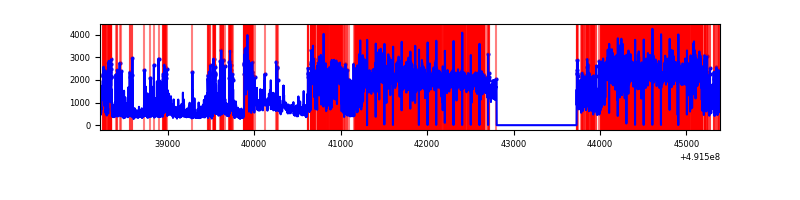 |
| D | 7172 | 6248 | 2714 | 2714 | 37.84% | 43.44% | 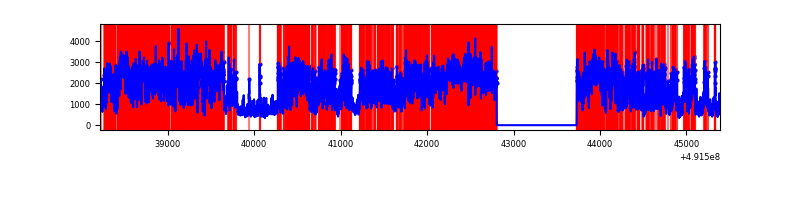 |
Top three noisy pixels from each quadrant. If the there are fewer than three noisy pixels in the level2.evt file, extra rows are filled as -1
| Pixel properties | Quadrant properties | ||||||
|---|---|---|---|---|---|---|---|
| Quadrant | DetID | PixID | Counts | Sigma | Mean | Median | Sigma |
| A | 4 | 249 | 270555 | 1748.23 | 622 | 605 | 154.4 |
| A | 15 | 174 | 190829 | 1231.91 | 622 | 605 | 154.4 |
| A | 3 | 62 | 93447 | 601.26 | 622 | 605 | 154.4 |
| B | 2 | 249 | 1833976 | 14180.29 | 607 | 586 | 129.3 |
| B | 10 | 247 | 158111 | 1218.37 | 607 | 586 | 129.3 |
| B | 0 | 197 | 88832 | 682.54 | 607 | 586 | 129.3 |
| C | 15 | 198 | 5560566 | 56670.86 | 350 | 346 | 98.1 |
| C | 15 | 224 | 975742 | 9941.43 | 350 | 346 | 98.1 |
| C | 4 | 5 | 933199 | 9507.82 | 350 | 346 | 98.1 |
| D | 15 | 125 | 7657003 | 51570.49 | 509 | 484 | 148.5 |
| D | 3 | 12 | 477380 | 3212.13 | 509 | 484 | 148.5 |
| D | 12 | 3 | 222305 | 1494.08 | 509 | 484 | 148.5 |
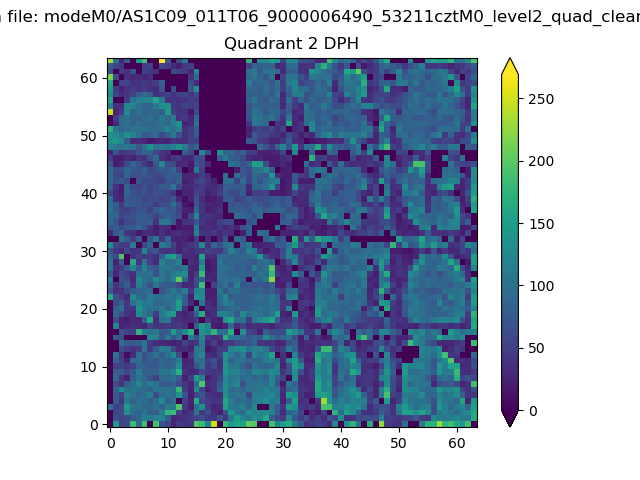
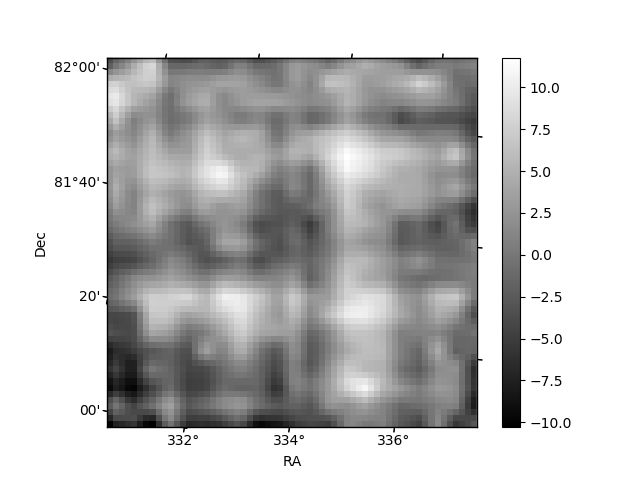
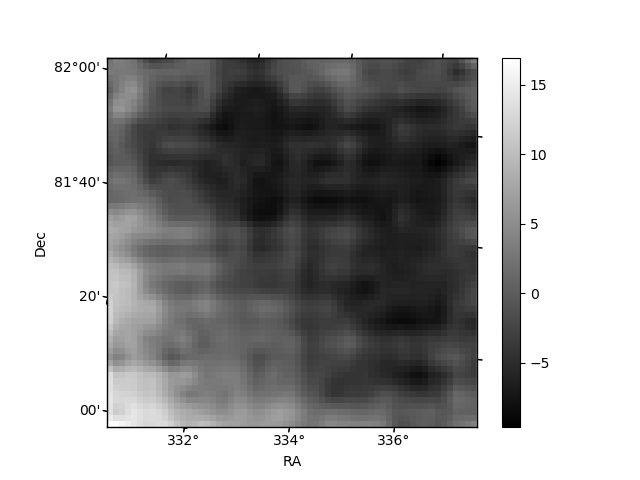
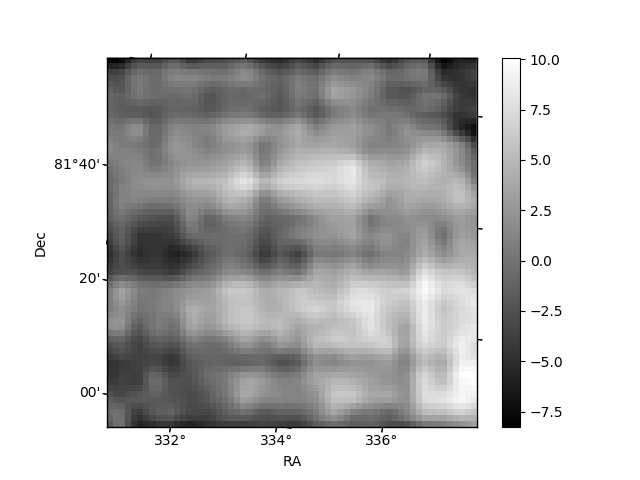
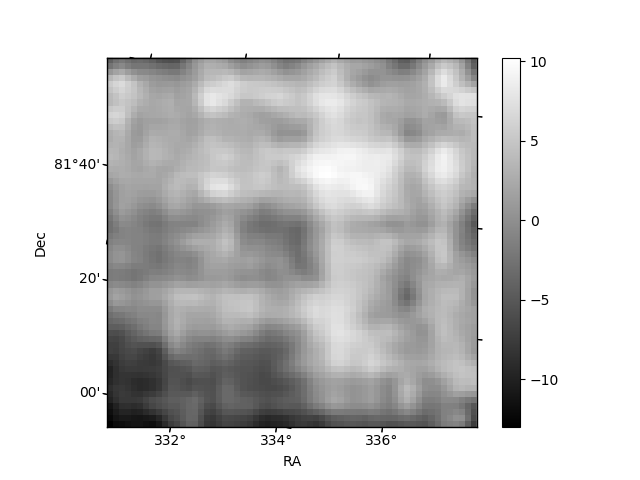
Histogram calculated using DETX and DETY for each event in the final _common_clean file
| Quadrant A | 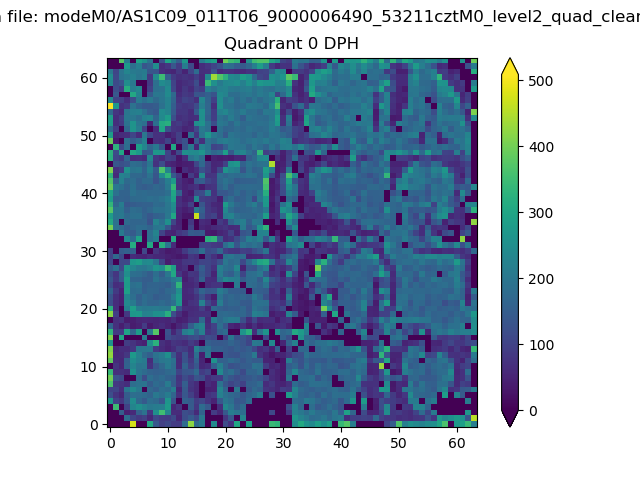 |
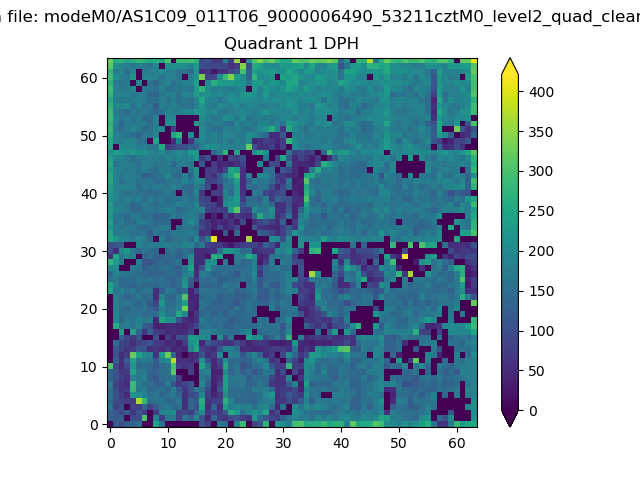 |
Quadrant B |
|---|---|---|---|
| Quadrant D | 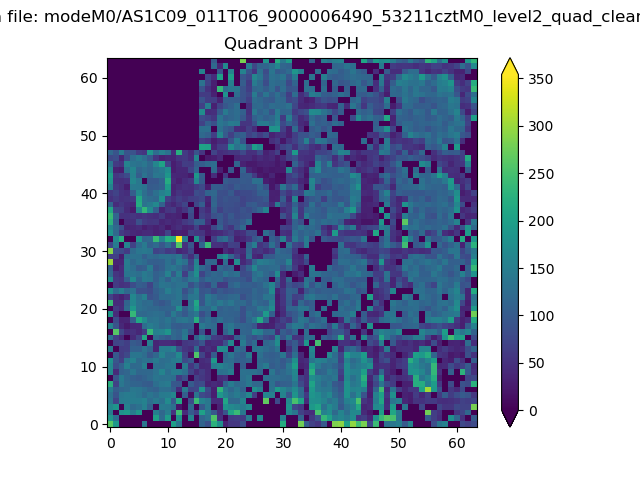 |
 |
Quadrant C |
| Plot type | Count rate plots | Images |
|---|---|---|
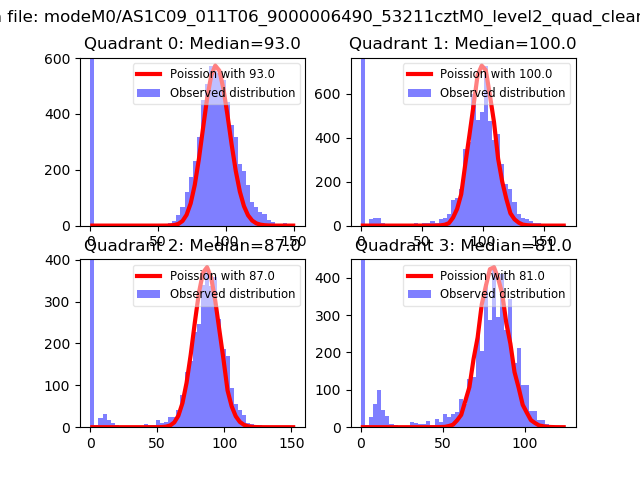
| Comparison with Poisson distribution Blue bars denote a histogram of data divided into 1 sec bins. Red curve is a Poisson curve with rate = median count rate of data. |
 |
 |
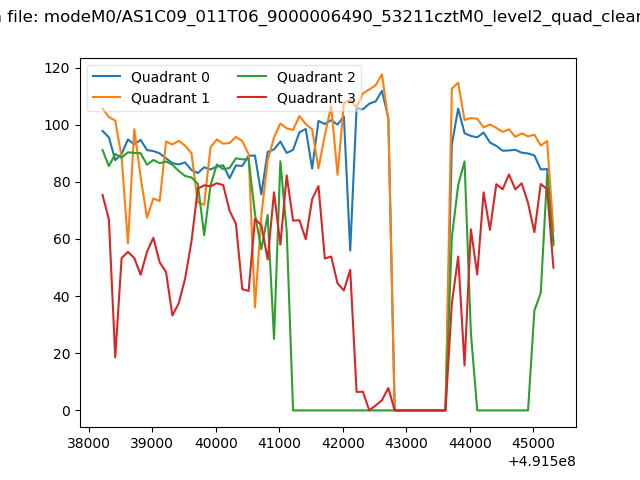
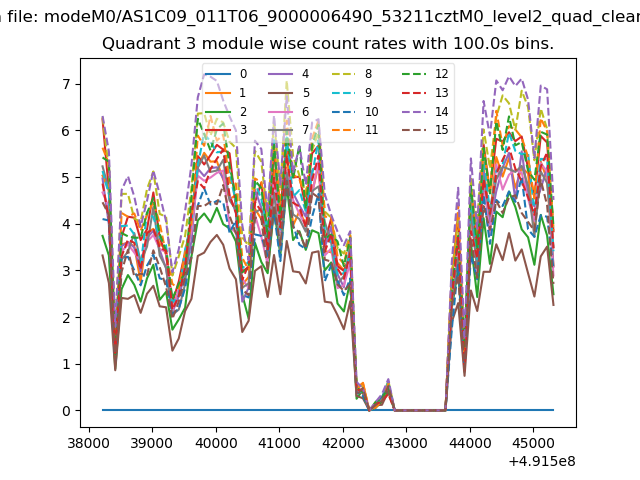
| Quadrant-wise count rates Data is divided into 100 sec bins |
 |
|
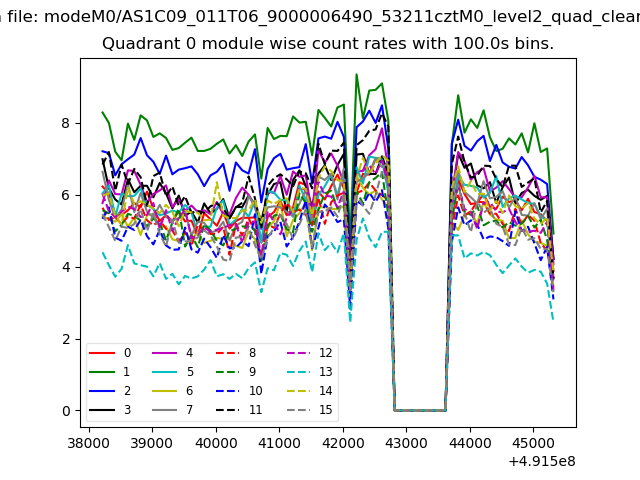
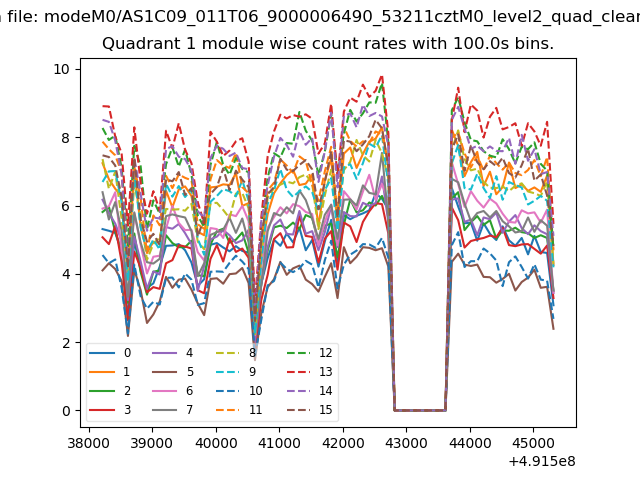
| Module-wise count rates for Quadrant A Data is divided into 100 sec bins |
 |
 |
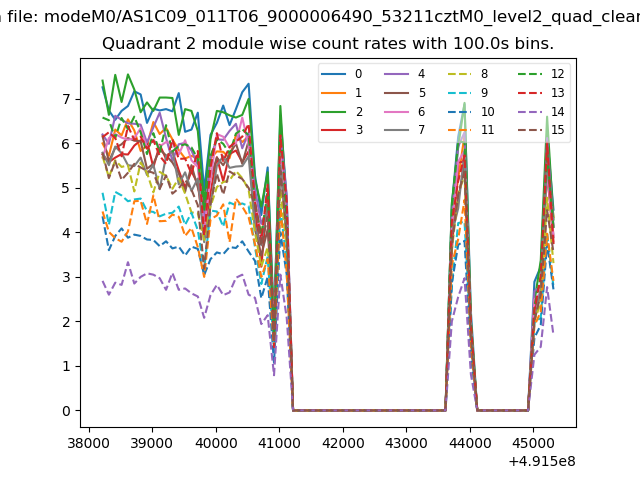
| Module-wise count rates for Quadrant B Data is divided into 100 sec bins |
 |
 |
| Module-wise count rates for Quadrant C Data is divided into 100 sec bins |
 |
 |
| Module-wise count rates for Quadrant D Data is divided into 100 sec bins |
 |
 |
| Parameter | Plot |
|---|---|
| CZT HV Monitor | 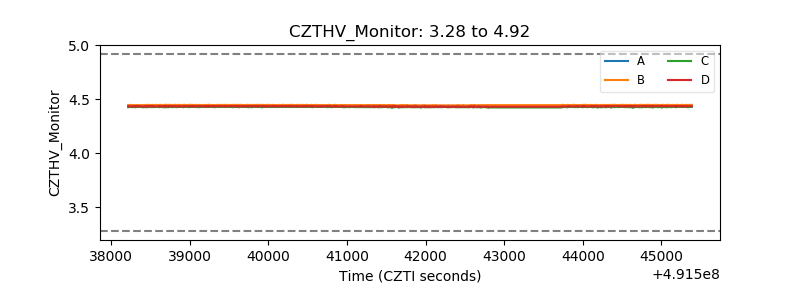 |
| D_VDD | 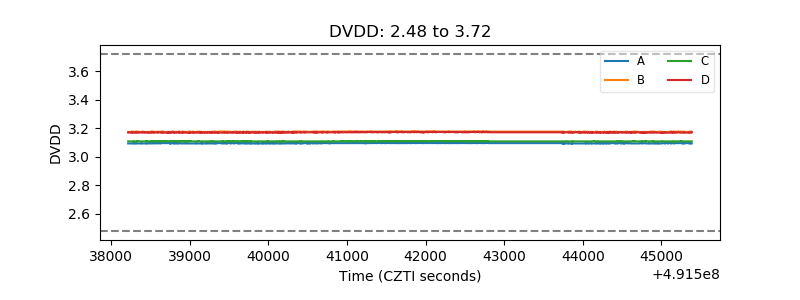 |
| Temperature 1 | 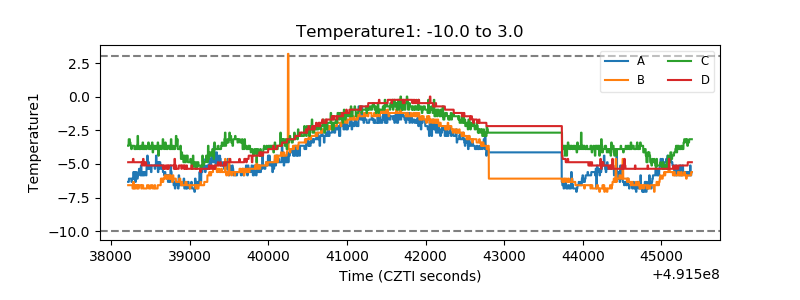 |
| Veto HV Monitor | 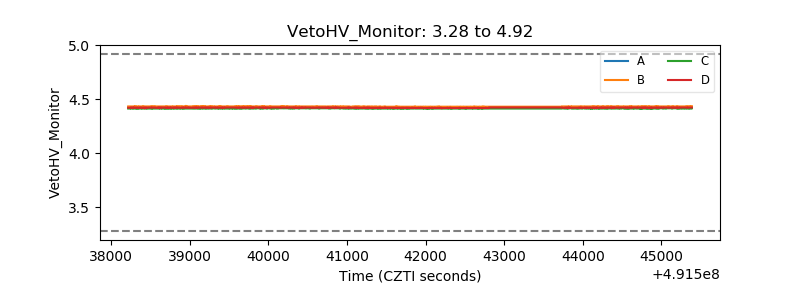 |
| Veto LLD | 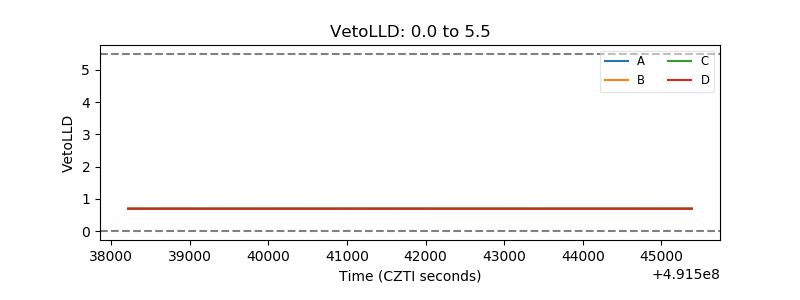 |
| Alpha Counter | 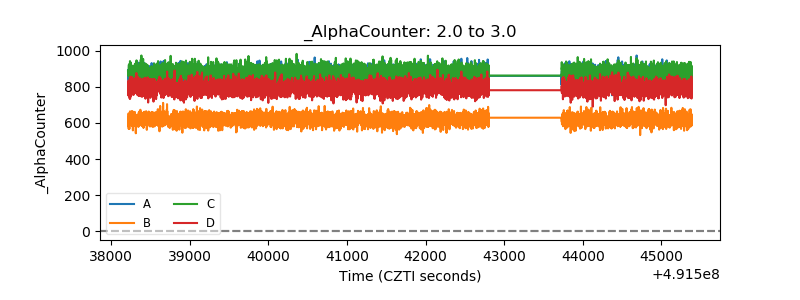 |
| _CPM_Rate | 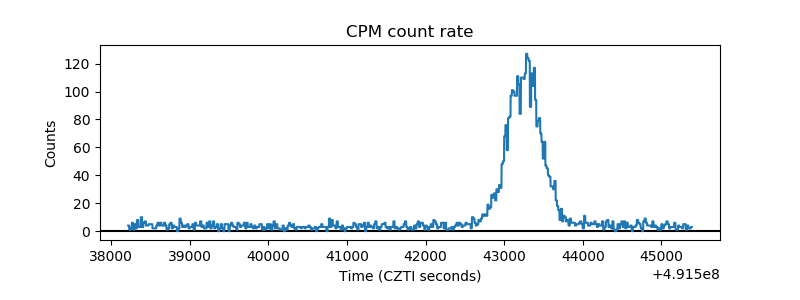 |
| CZT Counter | 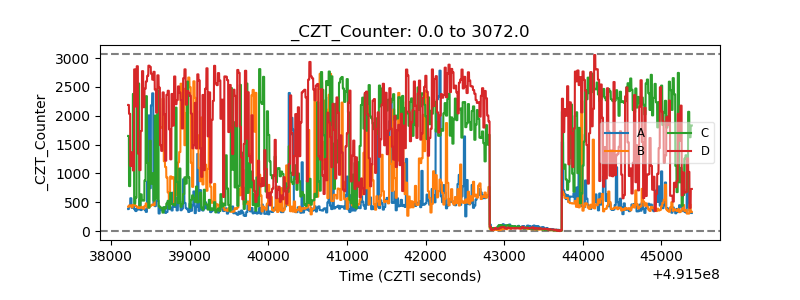 |
| +2.5 Volts monitor |  |
| +5 Volts monitor |  |
| _ROLL_ROT | 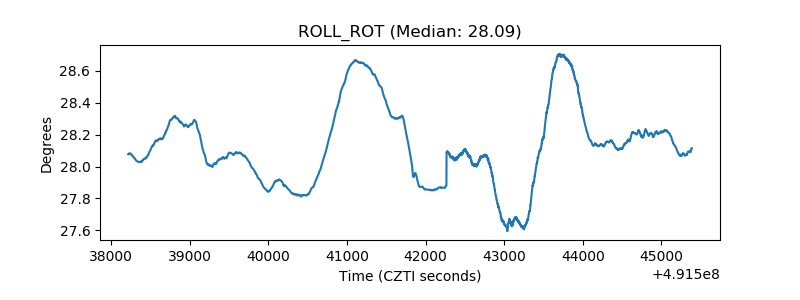 |
| _Roll_DEC | 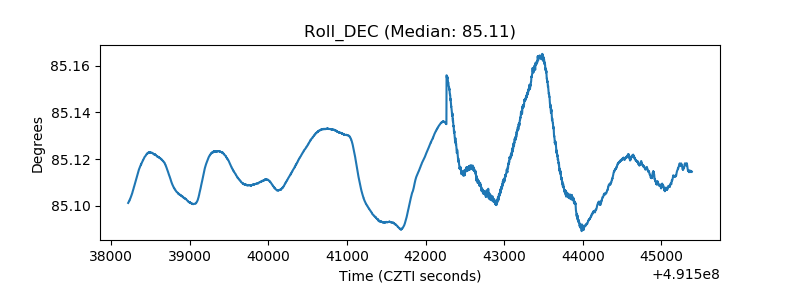 |
| _Roll_RA | 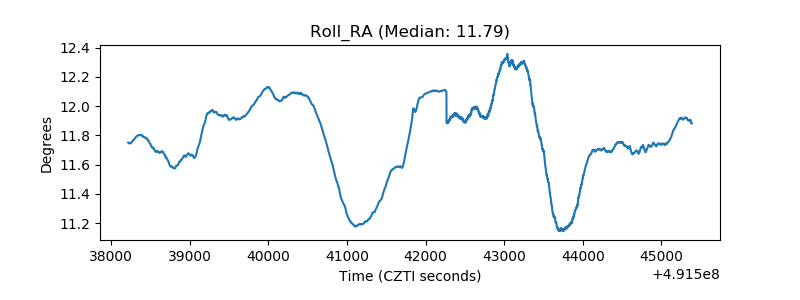 |
| Veto Counter | 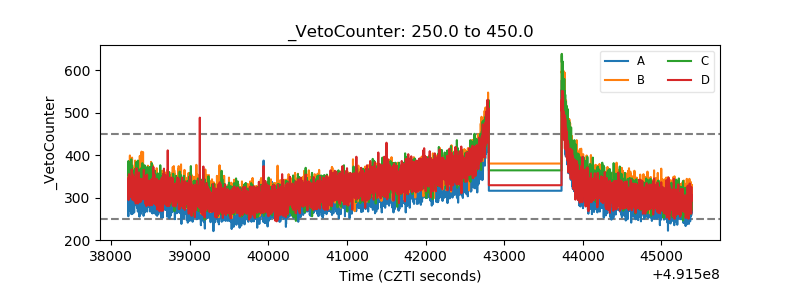 |